FEDS Notes
November 09, 2020
The Stability of Safe Asset Production
Sara Almadani 1, Michael Batty, Danielle Nemschoff, and Wayne Passmore*
A safe asset is a debt instrument that is expected to maintain its value over time, especially during adverse systemic events. Changes in the supply of safe assets can have a significant influence on short-term, risk-free interest rates. (Ferreira & Shousha, 2020) "When the scarcity of safe asset[s] is acute, the zero lower bound (ZLB) becomes binding and the safe asset market equilibrates via a reduction in output…" (Caballero, Farhi, & Gourinchas , 2016).
The supply of safe assets has been concentrated in a small number of advanced economies: Germany, France, the United Kingdom, but most prominently by the United States. Despite their growing public sector deficits in these countries, the supply has not kept pace with the global demand in the past decade. Some observers attribute the lack of supply to the deceleration in the growth rate of the advanced economies relative to the world's growth rate, as well as the rapid growth rate of high saving emerging economies in comparison with the advanced-economy public debt. (Caballero, Farhi, & Gourinchas, 2017)
One remarkable claim is the percentage of safe assets in the United States has remained very stable over time (see e.g. (Gorton, Lewellen, & Metrick, 2012) and (Gorton, 2017)). In particular, the fraction of safe assets to total assets in the economy has remained in a range between 30–35 percent during the past 7 decades. Here, we update the data on safe assets, as defined using the Financial Accounts of the United States (Z.1), and show that this claim is still true. We also update the components of safe assets and show that while the overall proportion has remained the same, there has been a significant shift in the components. For many years, the role of banks in the production of safe assets has been declining. But since the Great Financial Crisis (GFC), safe asset production has shifted back to depositories and away from shadow banking. Still, the declining contribution of banks remains notable.
The Stability of Safe Assets Hypothesis
Gorton, Lewellen, & Metrick (2012) uses information collected in the Federal Reserve's Financial Accounts of the United States for the years 1952 to 2010. Figure 1 below updates the analysis through 2020. The red area represents the safe assets issued by U.S. federal, state, and local governments as a share of total assets in the U.S. economy, the blue area represents safe assets issued by the financial sector, and the dotted line indicates the average proportion of safe assets over the years 1952 to 2020 (31.1 percent). The standard deviation of the safe asset share has been 2.3 percent, suggesting that the hypothesis of a relatively constant proportion of safe assets remain true.
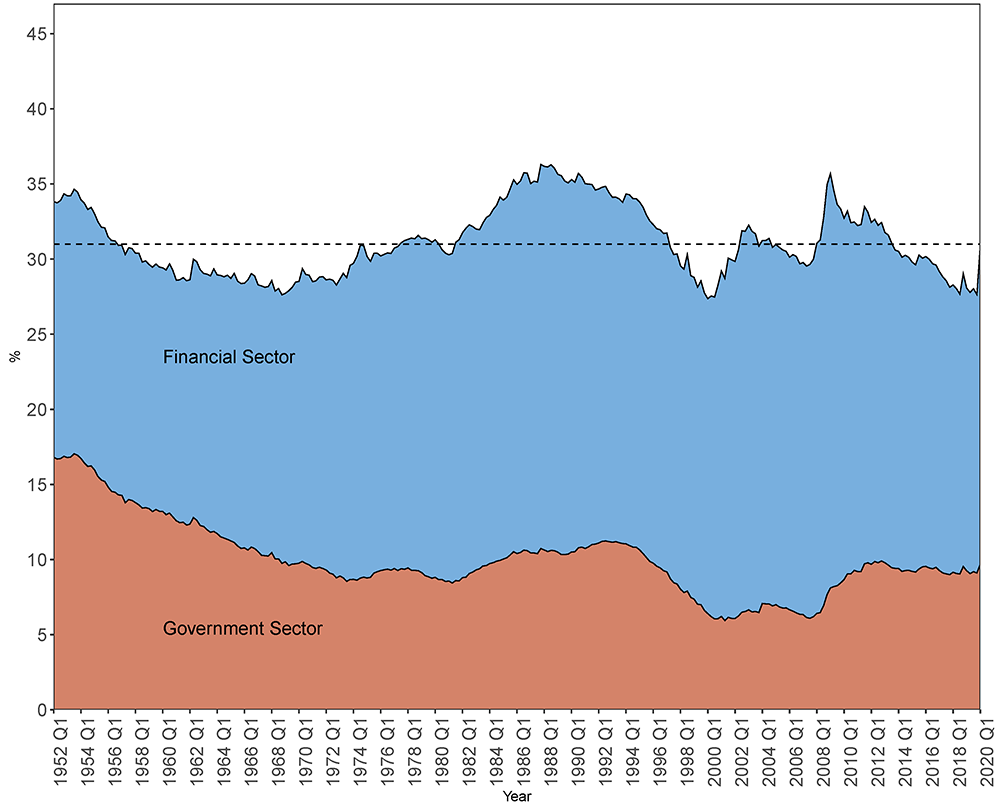
Source: Base on authors' calculation using the Financial Accounts of the United States, and following the method presented in (Gorton, Lewellen, & Metrick, 2012).
Note: Dashed horizontal line marked at about 31%.
Calculating the Share of Safe Assets
Safe assets consist of selected liabilities issued by the financial and government sectors of the U.S. economy.2 Government liabilities are explicitly backed by the United States, and are viewed as the "safest" of safe assets. The financial liabilities we select are produced by the private sector and are deemed by investors as very safe (from credit risk). This clearly is a judgment call, and the judgments can vary across assets and across time. For example, the (time-varying) polices of governments and central banks are key to what assets are deemed to be safe (Gourinchas & Jeanne, 2012). However, as noted by Gorton and his co-authors, the privately produced safe asset component is substantial under a range of plausible assumptions.3
We follow the safe asset share calculation outlined in (Gorton, Lewellen, & Metrick, 2012), adapting it for subsequent changes to the Financial Accounts' categorization of financial instruments and economic sectors. For the numerator of total safe assets, these changes include a variety of technical updates that alter the series number attached to a given liability (marked with * in Appendix A), and adding and classifying liabilities of the financial and government sectors that were not separately identified when the work was first completed (marked with **).4 We calculate the denominator of the safe asset share by summing the asset holdings of all sectors of the Financial Accounts.5
The Rise and Fall[?] of Shadow Banking
Gorton and coauthors break safe financial liabilities into five main categories, as illustrated in Figure 2. Looking at the data from 1952 to 2010, bank deposits declined from approximately 80 percent to 25 percent for the years 1952-2008, followed by a slight increase from 2008 till 2010 to approximately 29 percent. The shortage of safe debt produced by depositories played a role in expanding the shadow banking system, which created USD-denominated debt securities that perceived by investors as being as safe as government liabilities. For example, from 1952 to 2008, the money-like debt and MBS/ABS debt both increased by around 16 percentage points (the share of money-like debt increased from 10 percent to 26 percent, and the share of MBS/ABS debt increased sharply from almost zero percent to 17 percent). Also, the share of corporate bonds increased from 2 percent to 14 percent and other liabilities share increased from 8 percent to 18 percent. As Gorton (2017) states, "The change corresponds to the rise of the shadow banking industry."
Our updated chart shows that the reversal of this trend that began in the aftermath of the GFC has continued over the past ten years, and by 2020 deposits stood at 35 percent of safe assets—a substantial move upwards. This increase is mirrored by decreases in the assets that are produced by the shadow banking system. In particular, the share of money-like debt and MBS/ABS debt fell to 22.7 percent and 15.4 percent respectively from 2008 to 2020. Corporate bonds and other liabilities also fell, though to a lesser degree, with declines to shares of 8.7 percent and 17.3 percent respectively.
Depositories rely on insured deposits. In contrast, the money-like debt and the MBS/ABS debt categories are dominated by the funding of mortgage-related activities using wholesale funds (often collateralized). The characteristics of non-bank funding of mortgages ("banking without deposits") is analyzed in (Jiang, Matvos, Piskorski, & Seru, 2020). One of their results suggests that a substantial proportion of banks take advantage of the deposit subsidy, which drives their capital structure choice. In particular, the banks' leverage ratios are likely pinned down by deposit subsidies and capital requirements. Banks borrow as much as they can subject to capital requirements because they have access to subsidized debt funding. Another result suggests the relative leverage available to the "shadow bank" funder of mortgages can be an important determinant of who funds the mortgage. Many observers have noted that shadow banks take advantage of relatively high capital requirements for safer mortgages in the banking industry.
Thus, we speculate that the decline in the safe asset share at depositories reflects the market investors' pre-GFC views of minimal risks in mortgage markets. Consistent with these views, the stability of insured deposits in banking as a funding source was little valued, and the capital requirements in banking for some mortgages were viewed as too high. After the GFC, the relative advantages of shadow banks diminished some as market-based funders reassessed the risks of banking activities. With shadow banks viewed as more risky, some the decline in the share of safe assets produced by depositories was reversed. The decline of the relative importance of depositories as a producer of safe assets over the past 70 years, however, still remains remarkable. This may in turn have implications for financial stability, as discussed in Gorton (2017).
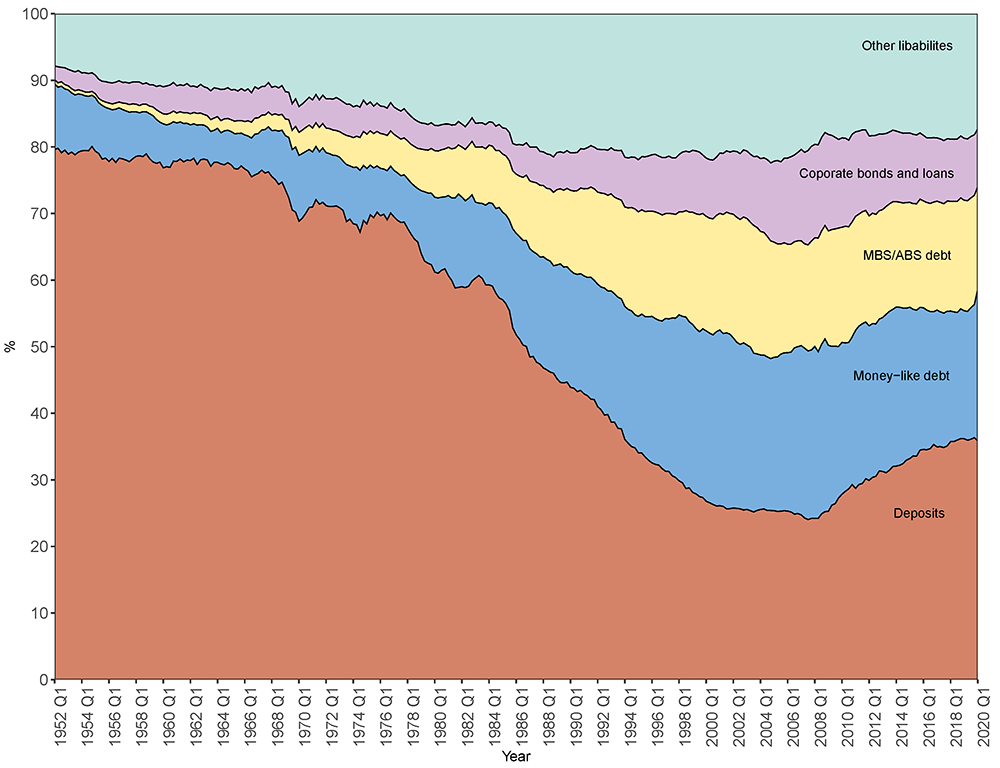
Source: Base on authors' calculation using the Financial Accounts of the United States, and following the method presented in (Gorton, Lewellen, & Metrick, 2012).
Source: Base on authors' calculation using the Financial Accounts of the United States, and following the method presented in (Gorton, Lewellen, & Metrick, 2012).
Appendix A:
The tables below shows which Financial Accounts liabilities of the government and financial sectors are and are not classified as safe assets. “85” indicates that 85% of that liability is counted as a safe asset. “X” indicates that the liability is excluded from total assets because it represents an intergovernmental loan. Entries marked with “*” have changed series numbers in the Financial Accounts since the original work by (Gorton, Lewellen, & Metrick, 2012). Entries marked with “**” represent Financial Accounts liabilities that were not separately identified at that time.
| Government Sector | ||
|---|---|---|
| FL314190005.Q | federal government; total liabilities | |
| FL313111303.Q | federal government; SDRs; allocations; liability | YES |
| FL713014003.Q | monetary authority; SDRs issues by federal government; asset | YES |
| FL313112003.Q | federal government; treasury currency; liability | YES |
| FL313069003.Q | federal government; other loans and advances | YES |
| FL314122005.Q | federal government; credit market instruments; liability | |
| FL313161105.Q | federal government; Treasury securities; liability | YES |
| FL313161705.Q | federal government; budget agency securities; liability | YES |
| FL313165403.Q | federal government; multifamily residential mortgages; liability | YES |
| FL313170005.Q | federal government; trade payables; liability | YES |
| FL313140003.Q | federal government; life insurance reserves; liability | NO |
| FL313190005.Q | federal government; total misc liabilities including nonmarketable gov securities | |
| FL343073045.Q | federal government; claims on pension fund on sponsor | X |
| FL313190015.Q | federal government; total misc liabilites excluding nonmarketable gov securities | YES |
| FL313193013.Q | federal government; liability due to FICO | YES |
| FL313131003.Q | federal government; postal savings system deposits; liability | YES |
| FL313195105.Q | federal government; retiree health care funds; liability | NO |
| FL214190005.Q | state & local, excluding employee retirement funds; total liabilities | |
| FL213162005.Q | state & local, excluding employee retirement funds; municipal securities and loans; liability | |
| FL213162400.Q | state & local, excluding employee retirement funds; short-term municipal securities and loans | YES |
| *FL213162200.Q | state & local, excluding employee retirement funds; long-term municipal securities ####(was FL213162205.Q) | YES |
| FL213169203.Q | state & local, excluding employee retirement funds; US gov loans; liability | X |
| FL213170003.Q | state & local, excluding employee retirement funds; trade payables; liability | YES |
| **FL223073045.Q | state & local government employee DB retirement funds; claims of pension fund on sponsor | X |
| Financial Sector | ||
|---|---|---|
| FL794190005.Q | financial business; total liabilities | |
| FL794110005.Q | financial business; net interbank transactions liability | YES |
| FL793120005.Q | financial business; checkable deposits and currency; liability | YES |
| FL634090005.Q | money market mutual funds; total financial assets | YES |
| FL792150005.Q | financial business; federal funds and security repurchase agreements; liability | YES |
| *FL703130005.Q | private depository institutions; total time and savings deposits ####(was FL793130005.Q) | YES |
| **LM793192005.Q | domestic financial sectors; FDI; liability | NO |
| FL794104005.Q | financial business; credit market instruments; liability | |
| FL793169100.Q | financial business; commercial paper; liability | YES |
| *FL703169605.Q | private DIs; bankers acceptances; liability ####(was FL783169605.Q) | YES |
| FL423161705.Q | GSEs and federally related mortgage pools; US gov agency securities; liability | |
| FL403161785.Q | GSEs; other GSE issues; liability | 85 |
| FL403161795.Q | GSEs; securitized GSE issues; liability | 85 |
| FL413065005.Q | agency and GSE back mortgage pools; total mortgages; asset | 85 |
| FL793163005.Q | financial business; corporate and foreign bonds; liability | |
| *FL763163005.Q | US chartered DIs; corporate and foreign bonds; liability ####(was FL723163003.Q and FL443163053.Q) | 85 |
| FL733163003.Q | holding companies; corporate and foreign bonds; liability | 85 |
| FL673163005.Q | issuers of asset-backed securities; corporate and foreign bonds; liability | 85 |
| *FL613163005.Q | finance companies; corporate and foreign bonds; liability ####(was FL613163003.Q) | 85 |
| *FL643163005.Q | REITs; corporate and foreign bonds; liability ####(was FL643163003.Q) | 85 |
| FL663163003.Q | security brokers and dealers; corporate and foreign bonds; liability | 85 |
| FL503163005.Q | funding corps; corporate and foreign bonds; liability | 85 |
| *FL793168005.Q | private nonbank financial institutions; bank loans nec; liability ####(was FL693168005) | 85 |
| **FL793169005.Q | financial business; other loans and advances; liability FL793169005 - FL153067005 | 85 |
| *FL153067005.Q | household asset of securities to brokers and dealers ####(was FL663167005.Q) | YES |
| *FL123165005.Q | REITs; total mortgages; liability ####(was FL643165005.Q) | NO |
| **FL793170005.Q | domestic financial sectors; trade payables; liability | |
| FL663170003.Q | security brokers and dealers; trade payables; liability | YES |
| **FL523170005.Q | insurance companies; trade payables to reinsurers; liability | NO |
| FL653164205.Q | mutual funds; mutual fund shares; liability | NO |
| *FL543140005.Q | life insurance companies life insurance reserves; liability ####(was FL543140003.Q) | NO |
| **FL583150005.Q | insurance companies and pension funds; pension entitlements | NO |
| FL793178005.Q | financial business; taxes payable; liability | NO |
| FL793190005.Q | financial business; total misc liabilities | YES |
Works Cited
Caballero, R. J., Farhi, E., & Gourinchas , P.-O. (2016). Safe Asset Scarcity and Aggregate Demand. American Economci Review: Papers & Proceedings, 513- 518.
Caballero, R. J., Farhi, E., & Gourinchas, P.-O. (2017). The Safe Assets Shortage Conundrum. Journal of Economic Perspectives, 29–46.
Eden, M., & Kay, B. S. (2019). Safe Assets as Commodity Money. Journal of Money, Credit and Banking, 1651-89.
Ferreira, T., & Shousha, S. (2020). Scarcity of Safe Assets and Global Neutral Interest Rates. International Finance Discussion Papers.
Gorton, G. (2017). The History and Economics of Safe Assets. Annual Review of Economics, 547-586.
Gorton, G., Lewellen, S., & Metrick, A. (2012). The Safe-Asset Share. American Economic Review: Papers & Proceeings, 101-106.
Jiang, E., Matvos, G., Piskorski, T., & Seru, A. (2020). Banking Without Deposits: Evidence from Shadow Bank Call Reports. National Bureau of Economic Research No. 26903.
1. Sara Almadani, Senior Financial Economist, is at the Saudi Arabian Monetary Authority (SAMA). Michael Batty, Senior Economist, and Wayne Passmore, Senior Adviser, are at the Board of Governors of the Federal Reserve System. Danielle Nemschoff is a former Research Assistant at the Federal Reserve, and is now a graduate student at the University of Chicago Harris School. The views expressed are the authors' and should not be interpreted as representing the views of the Federal Open Market Committee, its principals, the Board of Governors of the Federal Reserve System, or any other person associated with the Federal Reserve System. * Corresponding author: Wayne Passmore; [email protected]; 202-452-6432. Return to text
2. Due to the structure of the Financial Accounts, safe assets are most easily constructed by summing the selected liabilities issued by financial and government sectors, as opposed to summing the corresponding asset holdings reported by the purchasers of this debt. Return to text
3. We followed the assumption made by (Gorton, Lewellen, & Metrick, 2012), that only 85 percent of the privately produced long-term debt issued by the financial sector are considered safe debt. Please see the Appendix for more details. Return to text
4. As in the original work, also we exclude several assets that represent various intergovernmental loans. Return to text
5. Technically, we sum all asset holdings, and add to it the "discrepancy" for each financial instrument (other than unidentified miscellaneous financial claims). These discrepancies capture the difference between the total liabilities for a given financial instrument. The most common reason these discrepancies arise is when the liability is at book value and the asset holding is reported at market value. Adding the instrument discrepancies ensures the denominator uses the same valuation basis as the numerator. At the time of the original publication, most assets were reported in the Financial Accounts at book value, and thus instrument discrepancies did not exist. In contrast, (Gorton, Lewellen, & Metrick, 2012) sums total liabilities, plus the asset holdings of corporate and noncorporate equity. The difference between our and the original approach is the relatively small gap between unidentified miscellaneous financial claims that are reported as assets and those that are reported as liabilities. This gap is both positive and negative at different points in its history, but is generally small relative to total assets, and rarely alters the safe asset share by more than half a percentage point. Return to text
Almadani, Sara, Michael Batty, Danielle Nemschoff, and Wayne Passmore (2020). "The Stability of Safe Asset Production," FEDS Notes. Washington: Board of Governors of the Federal Reserve System, November 09, 2020, https://doi.org/10.17016/2380-7172.2787.
Disclaimer: FEDS Notes are articles in which Board staff offer their own views and present analysis on a range of topics in economics and finance. These articles are shorter and less technically oriented than FEDS Working Papers and IFDP papers.