FEDS Notes
October 14, 2020
The Stock Market–Real Economy "Disconnect": A Closer Look
Andrew Chen, Markus Ibert and Francisco Vazquez-Grande1
Between March and September 2020, broad equity price indexes around the world experienced a historic rally. Although this rally followed a significant decline in stock prices, it appears difficult to explain due to continuing concerns about the global pandemic and national economies running far below their potentials.
However, stock prices are forward looking and reflect expectations about profits and discount rates even as far as decades ahead. In this note, we construct assets that are more comparable to near and medium term economic conditions using data on domestic and international dividend futures and the cross section of U.S. stock returns. We find that the disconnect is driven by gains in the market value of long-term (beyond five years) dividends. In contrast, the value of corporate dividends for the next five years remains far below pre-pandemic levels.2 We provide additional evidence supporting this theme using a cross section of U.S. stocks sorted on price-dividend ratios and equity duration, as well as evidence from dividend futures for a cross section of international equity indexes.
Taken together, our evidence suggests that financial markets remained connected to near and medium-term economic conditions during the 2020 summer rally. Specifically, dividend futures prices remained depressed even at five-year horizons both domestically and internationally, and the recovery in stock prices between the middle of March and September has largely been driven by an increase in the prices of far-dated dividend claims as well as high duration stocks.
Evidence from S&P 500 Dividend Futures
S&P 500 dividend futures are contracts that require two parties to exchange, on a specific future date, the dividends that the S&P 500 index paid over the year preceding that date and a predetermined cash amount (the futures price). We use these contracts to create portfolios that decompose the S&P 500 index into the value of S&P 500 dividends that will be paid over different time periods. The market prices of these portfolios are shown in Figure 1.3
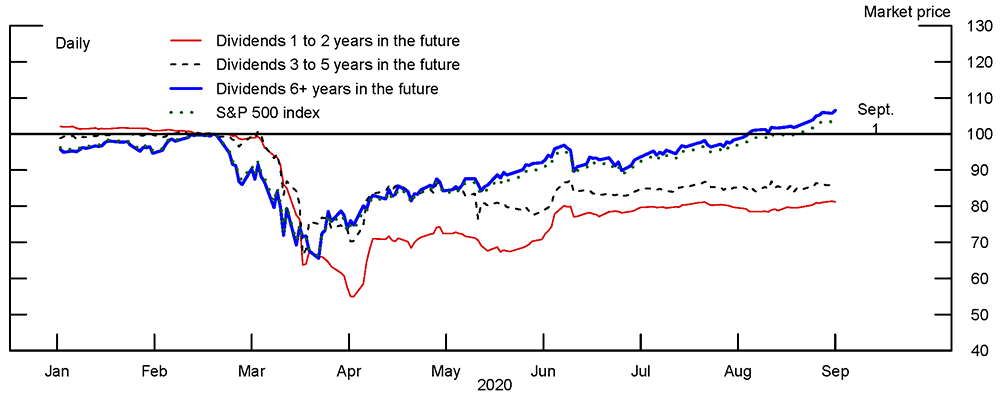
In the figure, the "dividends 1 to 2 years in the future" and "dividends 3 to 5 years in the future" portfolios contain dividend-receiving futures for their respective time horizons. The "dividends 6+ years in the future" portfolio is equivalent to a contract that pays the holder S&P 500 dividends from the sixth year onward. Each portfolio is scaled so to have a price of 100 on Feb 19, just before the market crash. However, the portfolios represent very different proportions of the S&P 500 index value: The first five years of dividends typically account for about 10 percent of the S&P 500 index, and the "dividends 6+ years in the future" portfolio accounts for the remaining 90 percent.
Figure 1 shows that the prices of all three portfolios plummeted in March as the COVID pandemic spread around the world. Afterwards, the prices of these portfolios rebounded, with the "dividends 1 to 2 years in the future" portfolio recovering from extreme lows, consistent with an improvement of economic conditions in April from a very dire near-term outlook. Even so, as of September 1, the price of a claim on the first five years of dividends remains 15 percent below its pre-pandemic level, consistent with depressed current economic fundamentals. On the other hand, the price of the claim on dividends after the first five years has recovered all of its losses and by September 1 was six and a half percentage points above its level at the heights of February. We note that, without accounting for term premiums, our results from dividend futures prices suggest a more pessimistic near and medium term outlook (up to 5 years) compared with the relatively quick recovery in earnings implied by Wall Street analysts' earnings forecasts (see Landier and Thesmar 2020).
Evidence from the Cross Section of U.S. Stocks
Evidence of the sharper recovery of the price of far-dated dividend claims is also seen in the cross section of stocks. Figures 2 and 3 show two methods for forming portfolios of stocks that reflect up to medium-term versus far-term dividends.
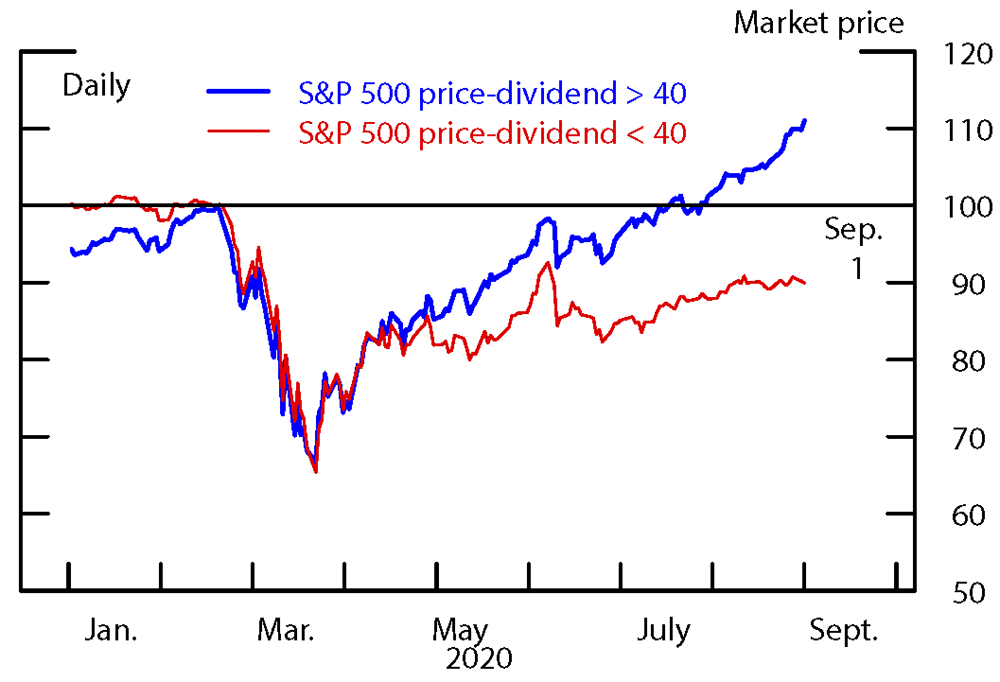
Note: Prices are normalized so that Feb. 19, 2020 = 100. Price and dividend uses averages over the past five years.
Source: Center for Research in Security Prices, CRSP/Compustat Merged Database; S&P Dow Jones Indices.
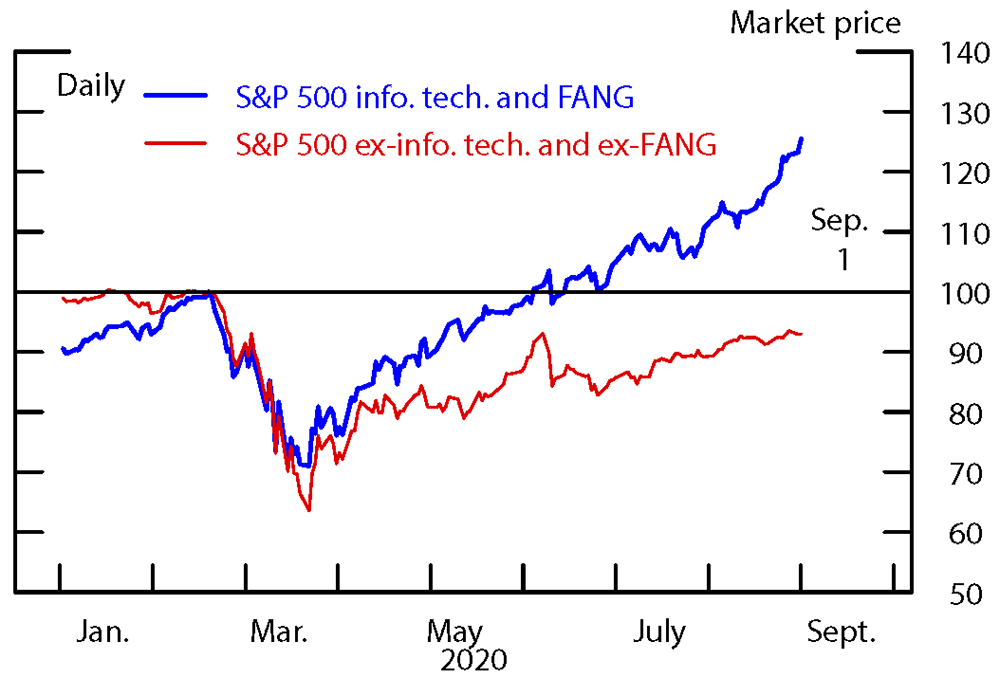
Note: Prices are normalized so that Feb. 19, 2020 = 100. FANG is Facebook, Amazon, Netflix, and Google.
Source: S&P Dow Jones Indices.
Figure 2 divides the S&P 500 into stocks with high price–dividend ratios and stocks with low price–dividend ratios based on data over the past five years. Intuitively, stocks that have high price–dividend ratios—including those that do not currently pay dividends—derive more of their value from cash flows far into the future, as they are expected to pay little in dividends in the near and medium term. Consistent with Figure 1, high price–dividend stocks have recovered all of their COVID-related losses and more between March and September.4 In contrast, low price–dividend ratio stocks remain about 10 percent below their pre-pandemic levels. One can show that the price-dividend ratio is approximately the duration of equity in years (see Gonçalves 2019). Thus, Figure 2 suggests that the rally since April is driven by the value of dividends more than four decades in the future.
Figure 3 divides the S&P 500 stocks into information technology plus FAANG (Facebook, Amazon, Apple, Netflix, and Google) stocks versus ex-info tech and ex-FAANG stocks. The figure mirrors the previous results: Info tech and FAANG firms, which are expected to pay the lion's share of their dividends at distant dates, have recovered all of their losses and more between March and April. The portfolio of remaining stocks, which is more closely tied to the near and medium term, is still below its pre-pandemic level on September 1.
Figure 4 presents more evidence from the cross section of U.S. stock returns. We sort all common stock listed on the NYSE, AMEX and NASDAQ exchanges into three equally sized portfolios based on duration. We follow Weber (2018) and compute the Dechow et al. (2004) measure of cash flow duration at the firm level using balance sheet data.5 We find that the high duration portfolio has fared much better since the onset of the coronavirus outbreak in the U.S., which is consistent with the evidence presented above.6
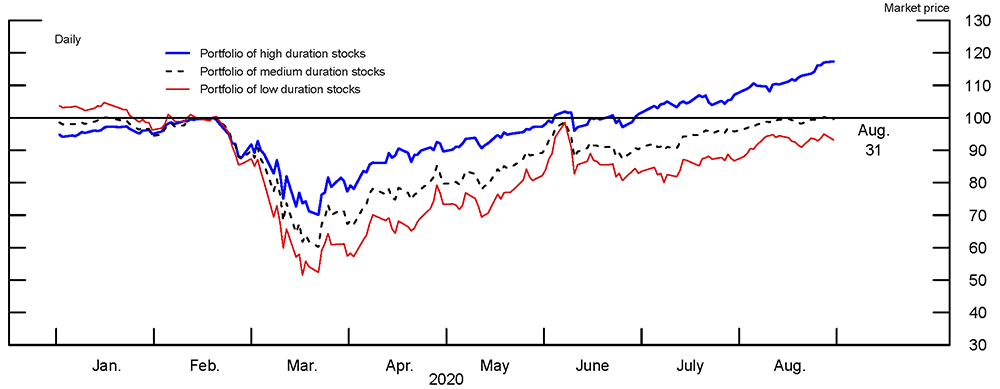
Note: This figure plots prices of value-weighted portfolios of stocks sorted on duration We sort all common stocks listed on NYSE, AMEX, and NASDAQ into terciles based on duration following Weber (2018). Prices are normalized so that Feb. 19, 2020 = 100.)
Source: Center for Research in Security Prices, CRSP/Compustat Merged Database, and Davis et al. (2000) book data.
International Evidence
Additional evidence on the nature of the disconnect comes from a cross section of international equity indexes. Figure 5 plots the decompositions of the EuroStoxx 50, the FTSE 100, and the Nikkei 225 into the values of near-dated, medium-dated, and far-dated dividend claims using dividend futures. In general, the disconnect has been less pronounced internationally in the first place: As of September 1, the FTSE 100 and the EuroStoxx 50 were down 21% and 15%, respectively, since the beginning of the pandemic. The Nikkei 225 recovered more than the EuroStoxx 50 and the FTSE 100 and was down only 1%, but still trailed the S&P 500 by 5%. The international evidence mirrors the evidence on the cross section of U.S. equities showing that equities with high price-dividend ratios have performed better throughout the pandemic. The cumulative returns of the FTSE 100, the EuroStoxx 50, the Nikkei 225, and the S&P 500 correlate positively with their price-dividend ratios at the onset of the pandemic. The price-dividend ratios were 22 (FTSE 100), 31 (EuroStoxx 50), 51 (Nikkei 225), and 56 (S&P 500), respectively.
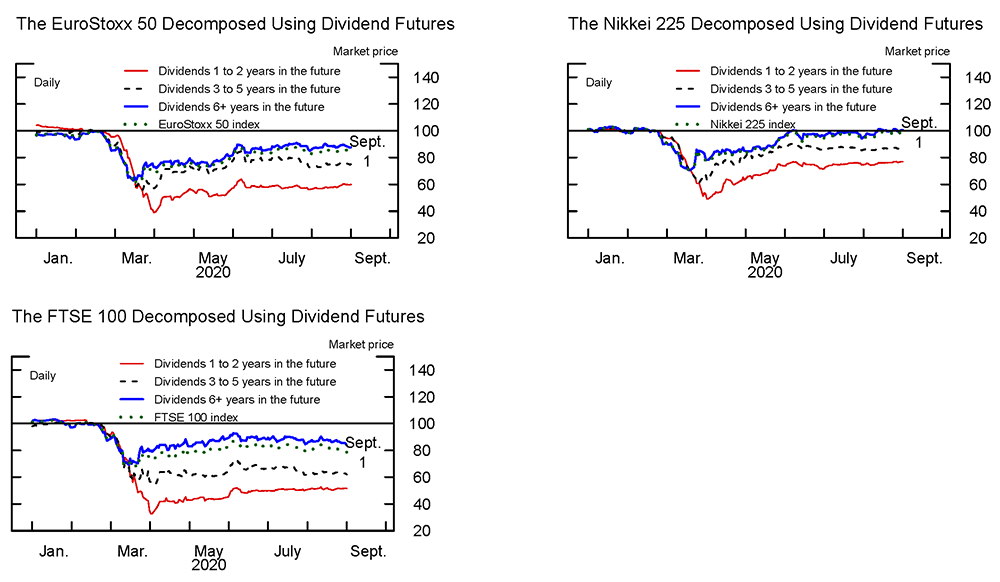
The decompositions of the international equity indexes into dividend claims across maturities show a similar pattern as the decomposition of the S&P 500 index. The prices of far-dated dividend claims recovered significantly more than the prices of near- and medium-dated dividend claims between March and September. The lack of disconnect between financial markets and the real economy is particularly apparent in the prices of the near-dated dividend claims of the EuroStoxx 50 and the FTSE 100, which as of September 1 have declined 40% and 48%, respectively, since the onset of the pandemic. Consistent with a dire economic outlook being reflected in financial markets, parts of these declines in the prices of near-dated dividend claims reflect European regulators urging European banks to suspend dividends in the near future.
References
Avalos, Fernando, and Dora Xia (September 2020). "The short and long end of equity prices during the pandemic" BIS Quarterly Review.
Davis, James L., Eugene F. Fama and Kenneth R. French (2000). "Characteristics, Covariances and Average Returns: 1929-1997." Journal of Finance, vol. 55, pp. 389-406.
Dechow, P.M., Sloan, R.G. & Soliman, M.T. (2004). "Implied Equity Duration: A New Measure of Equity Risk." Review of Accounting Studies vol. 9, pp. 197–228.
Gonçalves, Andrei, (2019). "What Moves Equity Markets? A Term Structure Decomposition for Stock Returns" Kenan Institute of Private Enterprise Research Paper.
Gormsen, Niels Joachim and Ralph S.J. Koijen (2020), "Coronavirus: Impact on Stock Prices and Growth Expectations." Review of Asset Pricing Studies, forthcoming.
Landier, Augustin, and David Thesmar (July 2020), "Earnings Expectations in the COVID crisis."
Macaulay, F. R. (1938). "Some Theoretical Problems Suggested by the Movements of Interest Rates, Bond Yields, and Stock Prices in the United States since 1856." New York: National Bureau of Economic Research.
Ozdagli, Ali, 2018. "Financial frictions and the stock price reaction to monetary policy," Review of Financial Studies, vol. 31 (10) pp. 3895-3936.
Weber, Michael (2018). "Cash flow duration and the term structure of equity returns," Journal of Financial Economics, vol. 128 (3), pp. 486–503.
1. At the time of writing, the authors worked at the Federal Reserve Board. We thank Craig Chikis, Noah Feldman, Thomas George, Jack McCoy and Tyler Pike for excellent research assistance. All errors and omissions are our own responsibility. The views expressed in this note are solely the responsibility of the authors and should not be interpreted as reflecting the views of the Board of Governors of the Federal Reserve System or of anyone else associated with the Federal Reserve System. Return to text
2. In independent work, Avalos and Xia (2020) document similar evidence. Return to text
3. We follow Gormsen and Koijen (2020) and construct constant maturity dividend strip prices from dividend futures. Return to text
4. This result is preserved when building portfolios of stocks based on high and low percentile thresholds of the price divided ratio distribution of the S&P 500. Return to text
5. This measure of duration is based on Macaulay's (1938) measure of bond duration and hence reflects the weighted average time to maturity of expected cash flows. The ratio of discounted cash flows to price determines the weights. Return to text
6. While high duration stocks have been documented to be more sensitive to monetary policy (Ozdagli 2018), the increase in high duration stocks does not necessarily imply that monetary policy is driving most of the stock market rally. Return to text
Chen, Andrew, Markus Ibert, and Francisco Vazquez-Grande (2020). "The Stock Market–Real Economy 'Disconnect': A Closer Look," FEDS Notes. Washington: Board of Governors of the Federal Reserve System, October 14, 2020, https://doi.org/10.17016/2380-7172.2800.
Disclaimer: FEDS Notes are articles in which Board staff offer their own views and present analysis on a range of topics in economics and finance. These articles are shorter and less technically oriented than FEDS Working Papers and IFDP papers.