FEDS Notes
July 03, 2017
The Systemic Nature of Settlement Fails
Rajkamal Iyer and Marco Macchiavelli
1. Introduction
In this note we analyze the systemic nature of settlement fails – the failure to deliver the agreed upon securities – during the 2007-09 period. Large and protracted settlement fails are believed to undermine the liquidity and well-functioning of securities markets, and as a result market groups and policymakers have tried to limit them.1 We show that, at the dealer level, failing to receive a security is passed almost 1-to-1 into failing to deliver the same security. This is true for all the reported asset classes (Treasuries, Agency MBS, Agency Notes, and Corporate Securities). The near-100 percent pass-through of fails suggests a high degree of collateral re-hypothecation together with the inability or unwillingness to borrow or buy the needed securities.2 Only in the pre-crisis period (before the near-collapse of Bear Stearns), the largest dealers are able to mitigate the chain of settlement fails if they have large inventories of such securities. However, this dampening effect of inventories ceases to exist after Bear Stearns' demise.
Finally, we show that the May 2009 implementation of a three percent fails charge for Treasury securities marginally improved the situation: the dealer-specific pass-through from fails to receive to fails to deliver Treasuries is reduces from 90% to about 83%. This decline seems not to be due to a market-wide improvement, since in the same time frame the pass-through for GSE MBS fails increases.
2. Data
We use confidential data from the FR2004 Primary Government Securities Dealers Reports, forms A and C from January 1, 2007 to January 1, 2009.3 Form A reports positions, long and short, at fair (market) value. Positions are broken down by asset class (U.S. Treasuries, Agency Notes and Coupons, Agency MBS and Corporate Securities) and residual maturity buckets, which vary asset-by-asset.4
Form C reports settlement fails, at principal value. Both fails to deliver or receive securities are broken down by security class (Treasuries, Agency Debt, Agency MBS, and Corporate Securities). Fails are reported on a cumulative basis within the reporting period, which ends every Wednesday at close of business: "[f]ailed transactions that are outstanding two days or more should be summed each day they are outstanding during the reporting period". Moreover, fails include the principal value of the securities that were not delivered (received) for outright sales (purchases) and the amount that was to be paid or received as part of a financing transactions. In the start leg of a repo, the dealer sends securities out and in the end leg it receives securities back; a dealer may fail to receive securities back in the end leg of the repo, in which case it does not return the cash and essentially starts borrowing at zero percent until it receives the securities back. Conversely, in the start leg of a reverse repo the dealer receives securities, and in the end leg it sends securities back; a dealer's failure to deliver securities can occur in the end leg, at which point the dealer essentially starts lending at zero percent until it delivers the securities back. In May 2009 a three percent fails charge was applied to Treasuries settlement fails, and in February 2012 to Agency Debt and Agency MBS fails. For more details on settlement fails see Fleming, Garbade (2005).
3. Daisy Chain Example
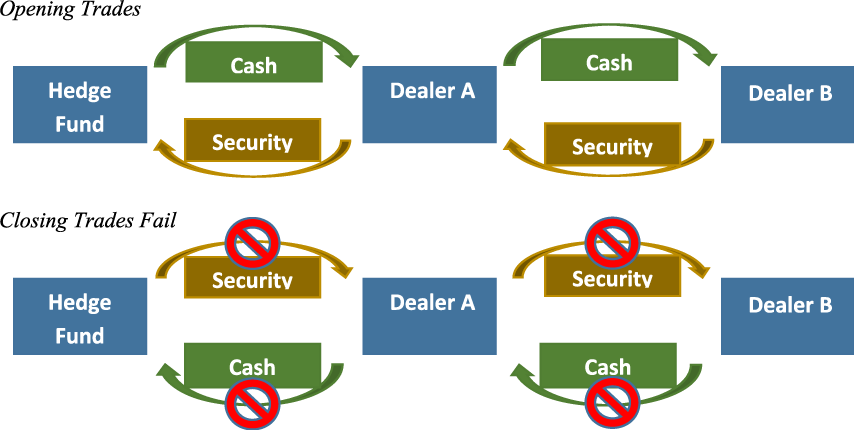
Before moving to the analysis, we will start with an example of a chain of settlement fails (daisy chains), depicted in Figure 1. Suppose that at the beginning of the week, for short-selling purposes, a hedge fund borrows a security from Dealer A, and Dealer A provides such security by borrowing it from another dealer, Dealer B. In other words, Dealer A simultaneously enters into a repo and a reverse repo with the same security as collateral, an example of matched-book activity. The hedge fund proceeds to sell the security, having in mind to buy it back at the end of the week (hopefully at a lower price) to deliver it back to Dealer A, as the term repo expires. Suppose that, at the end of the week, the hedge fund is unable to find the security and thus it is unable to deliver it back to Dealer A – this situation, if widespread, is often called a short squeeze. Then, Dealer A would record a fail to receive starting that day. The repo with the hedge fund is extended at unchanged invoice price until delivery is made, meaning that from that day until the security is delivered Dealer A is essentially borrowing cash against that security at an interest rate of zero.5 If Dealer A is then unable or unwilling to buy that security outright or to borrow it in the bilateral repo market, then Dealer A is also going to fail to deliver the same security to Dealer B, as part of the end leg of the reverse repo.
A daisy chain is started, whereby failing to receive a security translates into failing to deliver the same security to another player. If collateral re-hypothecation is widespread the chain of fails can cause a market-wide deterioration of liquidity for that security: agents who are supposed to receive such security are unable to obtain it within the agreed upon timeline.
4. Effect of Settlement Fails
We analyze the pass-through of settlement fails. To this regard, we run a set of panel regressions (Tables 1 to 3), such as
$$$$ \begin{align}\Delta FTD_{i,t} &= ( \alpha_0 \Delta FTR_{i,t} + \beta_0 \Delta Net\ Pos_{i,t} ) * PreBear_t + ( \alpha_1 \Delta FTR_{i,t} + \beta_1 \Delta Net\ Pos_{i,t} ) * \\ &* PostBear_t + ( \alpha_2 \Delta FTR_{i,t} + \beta_2 \Delta Net\ Pos_{i,t} ) * PostLehman_t + \mu_t + \varepsilon_{i,t} \end{align}$$$$ where $$\Delta FTD$$ is the first difference in the dollar value of securities that a dealer fails to deliver, and $$\Delta FTR$$ is the analogous for fails to receive. $$\Delta Net\ Pos$$ is the weekly change in the dollar value of net positions. Each regression focuses on a certain class of securities that are not received and delivered, from Treasuries to corporate securities. Net positions match the asset class related to the settlement fail.
Table 1: Daisy chains
| (1) Δ FTD Corp Sec |
(2) Δ FTD GSE MBS |
(3) Δ FTD Treasury |
|
|---|---|---|---|
| Pre-Bear X Δ FTR | 0.944*** (0.030) |
0.956*** (0.028) |
0.994*** (0.072) |
| Post-Bear X Δ FTR | 1.008*** (0.010) |
0.992*** (0.001) |
0.982*** (0.044) |
| Post-Lehman X Δ FTR | 1.025*** (0.058) |
0.894*** (0.079) |
0.902*** (0.042) |
| Pre-Bear X Δ Net Position | 0.011 (0.032) |
0.017 (0.025) |
-0.001 (0.034) |
| Post-Bear X Δ Net Position | -0.017 (0.036) |
-0.027 (0.050) |
0.090 (0.110) |
| Post-Lehman X Δ Net Position | 0.185** (0.087) |
-0.284 (0.174) |
0.254 (0.198) |
| Sample Size | 2078 | 2078 | 2078 |
| Week FE | Yes | Yes | Yes |
| R^2 | 0.864 | 0.97 | 0.937 |
Robust standard errors in parentheses; * p < 0.10, ** p < 0.05, *** p < 0.01. FTD stands for fails to deliver, FTR for fails to receive. FTR and Net Position both refer to the same asset class of the FTD.
Table 1 shows that settlement fails are indeed systemic events: the dealer-specific pass-through from fails to receive to fails to deliver is around 90% to 100% across collateral types and time periods. Moreover, it seems that the average dealer does not buy securities outright (it does not expand net positions in that asset class) to cure the chain of settlement fails. In unreported results, we also control for the weekly change in securities in for the same collateral, and results are unchanged: the average dealer does not borrow securities to cure the chain of fails.
Table 2: Dampening of daisy chains
| (1) Δ FTD Treasury |
(2) Δ (FTD - FTR) Treasury |
|
|---|---|---|
| Big5 X Pre-Bear X Δ Net Bills | 0.069 (0.066) |
0.069 (0.078) |
| Big5 X Post-Bear X Δ Net Bills | -0.042 (0.159) |
-0.040 (0.166) |
| Big5 X Post-Lehman X Δ Net Bills | 0.621** (0.243) |
0.500* (0.263) |
| Big5 X Pre-Bear X Δ Net Coupons | -0.217** (0.105) |
-0.209*** (0.051) |
| Big5 X Post-Bear X Δ Net Coupons | 0.651* (0.349) |
0.657* (0.377) |
| Big5 X Post-Lehman X Δ Net Coupons | -0.579 (0.470) |
-0.626 (0.528) |
| Big5 X Pre-Bear X Δ FTR Treasury | 1.001*** (0.094) |
|
| Big5 X Post-Bear X Δ FTR Treasury | 0.972*** (0.052) |
|
| Big5 X Post-Lehman X Δ FTR Treasury | 0.895** (0.077) |
|
| Sample Size | 2078 | 2078 |
| Week FE | Yes | Yes |
| Other PDs X Time X Δ Net Bills | Yes | Yes |
| Other PDs X Time X Δ Net Coupons | Yes | Yes |
| Other PDs X Time X Δ FTR Treasury | Yes | No |
| R^2 | 0.938 | 0.1 |
Robust standard errors in parentheses; * p < 0.10, ** p < 0.05, *** p < 0.01. FTD stands for fails to deliver, FTR for fails to receive. Net Bills and Net Coupons refer to net positions in Treasury bills and coupons.
Next, Table 2 specifically singles out the big U.S. dealers and focuses on Treasuries settlement fails, which constitute the majority of overall settlement fails during our sample period. While column (1) regresses dollar-changes in fails to deliver on dollar-changes in fails to receive, column (2) uses the dollar-change in incremental fails to deliver (i.e. fails to deliver minus fails to receive) as the dependent variable. Results suggest that prior to Bear's near-default, large dealers with a bigger portfolio of Treasury bonds and notes are able to dampen the chain of fails.
Over time, the way the industry handled fails changed. Recognizing that the opportunity cost of a fail to deliver is the overnight GC repo rate, which after Lehman's collapse became essentially zero, market participants and regulators at that time made an effort to change the practice of extending the term of the repo at no explicit cost until the security was delivered. Then, in May of 2009, the Treasury Market Practices Group, a group of market participants and regulators, strongly encouraged market participants to apply a three-percent fails charge for Treasuries settlement fails. Importantly, on May 1, 2009 no penalty was introduced for Agency MBS fails: the Agency fails charge was introduced in February 2012. See Garbade et al. (2010) for more details.6
Table 3: Treasury fails charge introduction – May 1, 2009
| (1) Δ FTD Treasury |
(2) Δ FTD Treasury |
(3) Δ FTD GSE MBS |
(4) Δ FTD GSE MBS |
|
|---|---|---|---|---|
| Pre-Bear X Δ FTR | 0.994*** (0.072) |
0.993*** (0.071) |
0.956*** (0.028) |
0.956*** (0.028) |
| Post-Bear X Δ FTR | 0.983*** (0.044) |
0.984*** (0.042) |
0.991*** (0.010) |
0.992*** (0.01) |
| Post-Lehman X Δ FTR | 0.898*** (0.042) |
0.900*** (0.044) |
0.911*** (0.072) |
0.910*** (0.073) |
| Post-Tsy Fails Charge X Δ FTR | 0.831*** (0.055) |
0.831*** (0.054) |
1.043*** (0.033) |
1.041*** (0.033) |
| Sample Size | 3268 | 3268 | 3268 | 3268 |
| Week FE | Yes | Yes | Yes | Yes |
| Time X Δ Net Tsy Bills | No | Yes | No | Yes |
| Time X Δ Net Tsy Coupons | No | Yes | No | Yes |
| Time X Δ Net TIPS | No | Yes | No | Yes |
| Time X Δ Net GSE MBS | No | Yes | No | Yes |
| R^2 | 0.932 | 0.933 | 0.893 | 0.893 |
Robust standard errors in parentheses; * p < 0.10, ** p < 0.05, *** p < 0.01. FTD stands for fails to deliver, FTR for fails to receive. FTR refers to the same asset class of the FTD; Tsy refers to Treasury.
Table 3 measures the efficacy of the fails charge introduction for Treasuries settlement fails. An incentive to cure the chain of settlement fails would be displayed by a lower pass-through from fails to receive to fails to deliver. We thus compare the pass-through from Lehman's collapse to just before May 1, 2009 – row three – with the pass-through from May 1, 2009 to May 1, 2010 – row four.7 It seems that the Treasury fails charge marginally reduces Treasury fails pass-through while at the same time there is an increase in the GSE MBS fails pass-through; recall there was no fails charge implement for MBS at that time. This suggests that the reduced Treasury fails pass-through is not part of any other market-wide phenomenon that would cure all settlement fails, but can be attributed to the staggered introduction of fails charges for different asset classes. However, the reduction in Treasury fails pass-through seems marginal, even when compared to the increased pass-through in the GSE MBS sphere.
5. Conclusion
In this note we document the systemic nature of settlement fails: a dealer that fails to receive $100 worth of Treasury securities, on average fails to deliver about $90 to $100 worth of Treasuries. This finding suggests a high degree of collateral re-hypothecation, and is also consistent with dealers conducting matched-book activities. The May 2009 introduction of a fails charge for Treasuries marginally improved the situation by decreasing the dealer-specific pass-through from fails to receive to fails to deliver.
References
Fleming, Michael, and Kenneth Garbade (2005). "Explaining Settlement Fails." Current Issues in Economics and Finance 11.9 (2005): 1.
Garbade, Kenneth, Frank Keane, Lorie Logan, Amanda Stokes, and Jennifer Wolgemuth (2010). "The introduction of the TMPG fails charge for US Treasury securities." Economic Policy Review Oct (2010): 45-71.
Iyer, Rajkamal, and Marco Macchiavelli (2017). "Primary Dealers' Behavior during the 2007-08 Crisis: Part I, Repo Runs." FEDS Notes.
Joint report on government securities markets. January 1992 (Department of Treasury, SEC, and Board of Governors of the Federal Reserve System, Washington, DC).
1. See for instance the January 1992 Joint Report on the Government Securities Market by Treasury, SEC and the Federal Reserve Board of Governors, page 10: "In contrast to temporary shortages, an acute, protracted shortage can cause lasting damage to the marketplace, especially if market participants attribute the shortage to market manipulation. Dealers may be more reluctant to establish short positions in the future, which could reduce liquidity and make it marginally more difficult for the Treasury to distribute its securities without disruption". See also Fleming, Garbade (2005), and Garbade et al. (2010). The latter discusses the efforts to cure widespread fails by way of introducing a fails charge. Return to text
2. For a discussion on the determinants of settlement fails, see Fleming, Garbade (2005), and Garbade et al. (2010). Return to text
3. For the instructions, see https://www.federalreserve.gov/reportforms/forms/FR_200420070307_i.pdf. Professor Iyer did not have access to any confidential information during this analysis. Return to text
4. For more information, see Iyer, Macchiavelli (2017). Return to text
5. Indeed, prior to May 2009 for Treasury fails and February 2012 for Agency Debt and MBS fails, the convention was to extend the repo at no explicit penalty until the security was delivered. The only implicit cost was the non-accrual of any further return on the lent cash, usually proxied by the overnight GC repo rate. Return to text
6. The current practice is to charge three percent for both Treasuries and Agency MBS fails. Return to text
7. During these sub-periods, overnight GC repo rates are very similar and just above zero. Return to text
Iyer, Rajkamal, and Marco Macchiavelli (2017). "The Systemic Nature of Settlement Fails," FEDS Notes. Washington: Board of Governors of the Federal Reserve System, July 3, 2017 , https://doi.org/10.17016/2380-7172.1997.
Disclaimer: FEDS Notes are articles in which Board staff offer their own views and present analysis on a range of topics in economics and finance. These articles are shorter and less technically oriented than FEDS Working Papers and IFDP papers.