FEDS Notes
May 21, 2019
There is No Single Best Predictor of Recessions
Abstract
Which term spread, or term spread derived, measure is the most accurate predictor of recessions? I conduct a robustness analysis of different spreads and show that there is no single most accurate predictor at any horizon. Many spreads do a good job of predicting recessions: short-very short spreads at short horizons, long-very short spreads at medium horizons, and medium-short spreads at long horizons. Testing models derived from the yield curve shows that a principal components decomposition of the yield curve is the most robust predictor of recessions.
Introduction
It's hard to predict recessions. We haven't had many, and we don't fully understand the causes of the ones we've had. Nevertheless, we persist in trying. The most widely used method to predict an incoming recession is a historical correlation between recessions and the spread between two Treasuries of different maturities. Choosing which two maturities, and hence which spread, to consider is always a debate. This note shows that there is no single most accurate spread to use to predict a recession at any horizon: the most accurate spread depends on the sample used. Additionally, the most accurate spread is always statistically indistinguishable from other similar spreads.
While there is no unique best predictor, there are general guidelines as to which term spread to use to predict recessions at different horizons. To predict recessions at short horizons, use a spread between short and very short Treasuries. To predict at medium horizons, use a spread between long and very short Treasuries. To predict at long horizons, use a spread between medium and short Treasuries. The strength of the yield curve to predict recessions at very long horizons (2 years) is surprisingly strong. Overall, if you can only use a single term spread derived measure, use the principal components of the yield curve model of Johansson and Meldrum (2018).
Methodology
To measure the accuracy of a spread, I use the area under the receiver operator characteristic curve (AUROC). This statistic indicates the accuracy of a model by measuring the ratio of true positives to false positives the model predicts on the estimated sample. The most accurate model possible would have an AUROC of 1, indicating that all its predicted positives are true positives. A predictor with an AUROC of 0.5 is a coin flip: half its predicted positives are true positives and half are false positives.
I gather data from FRED containing monthly yields on the 10-year, 5-year, 3-year, 2-year, 1-year, 3-month Treasury bonds, notes, and bills, and the effective Federal Funds Rate from 1954 to 2018.1 I compute every long-short spread combination possible, and see how accurately each spread predicts a recession starting at horizons from 1 to 24 months.2 The dependent variable is an indicator that, conditional on not being in a NBER dated recession this month, a recession begins within the next [horizon] months, the most relevant statistic currently.3
Term Spread Models
The results are easy to see graphically. Figure 1 illustrates the full sample.
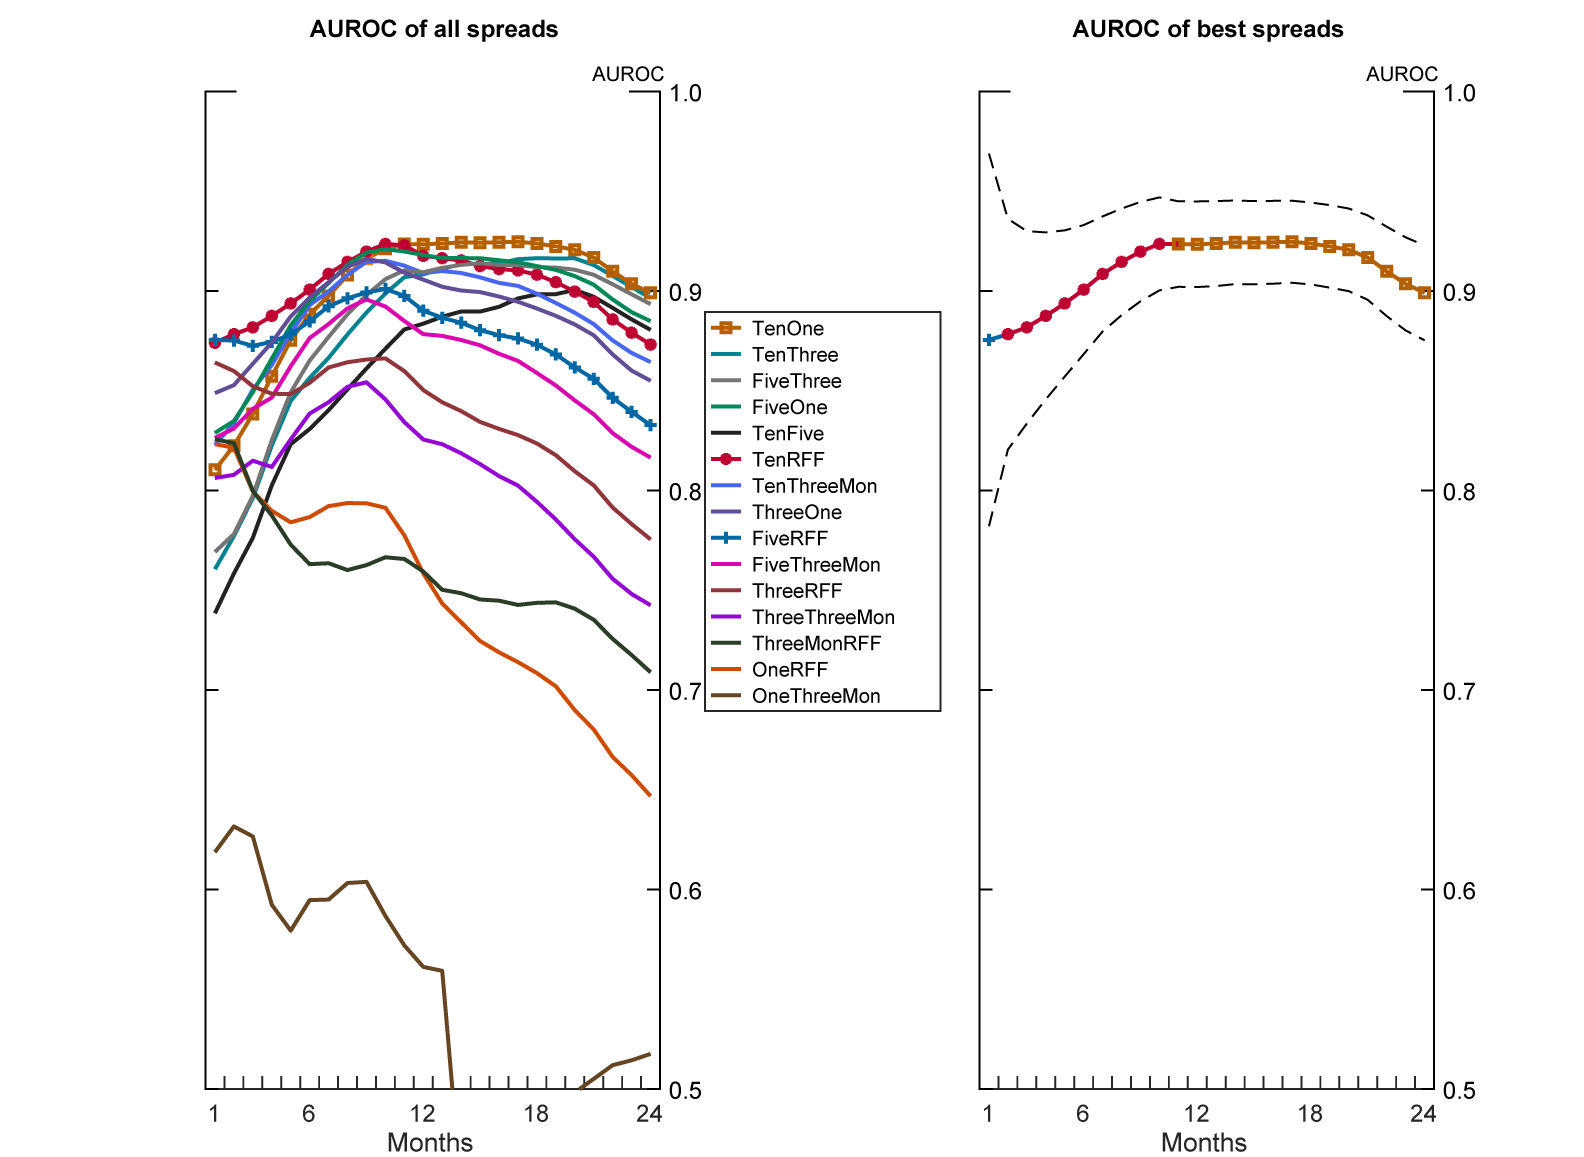
Legend entries ordered vertically by AUROC at horizon of 24 months.
Dashed lines indicate 95 percent confidence interval.
Source: Author's calculation.
The left hand side shows the AUROC for each possible spread at horizons from 1 to 24 months. The right hand side shows the spread with the highest AUROC score at each horizon with the 95% confidence interval illustrated by the dashed lines. Comparing the confidence intervals displayed on the right hand side with the spreads on the left hand side shows that many spreads are statistically indistinguishable predictors of a recession at each horizon. This non-uniqueness result holds for any sample chosen.
The US economy has changed greatly over the past 70 years. Many economists date the beginning of the modern era of the US economy, the Great Moderation period, to 1984. There's little reason to expect a correlation from long ago to remain constant. Figure 2 illustrates the sample from the Great Moderation to 2018.4
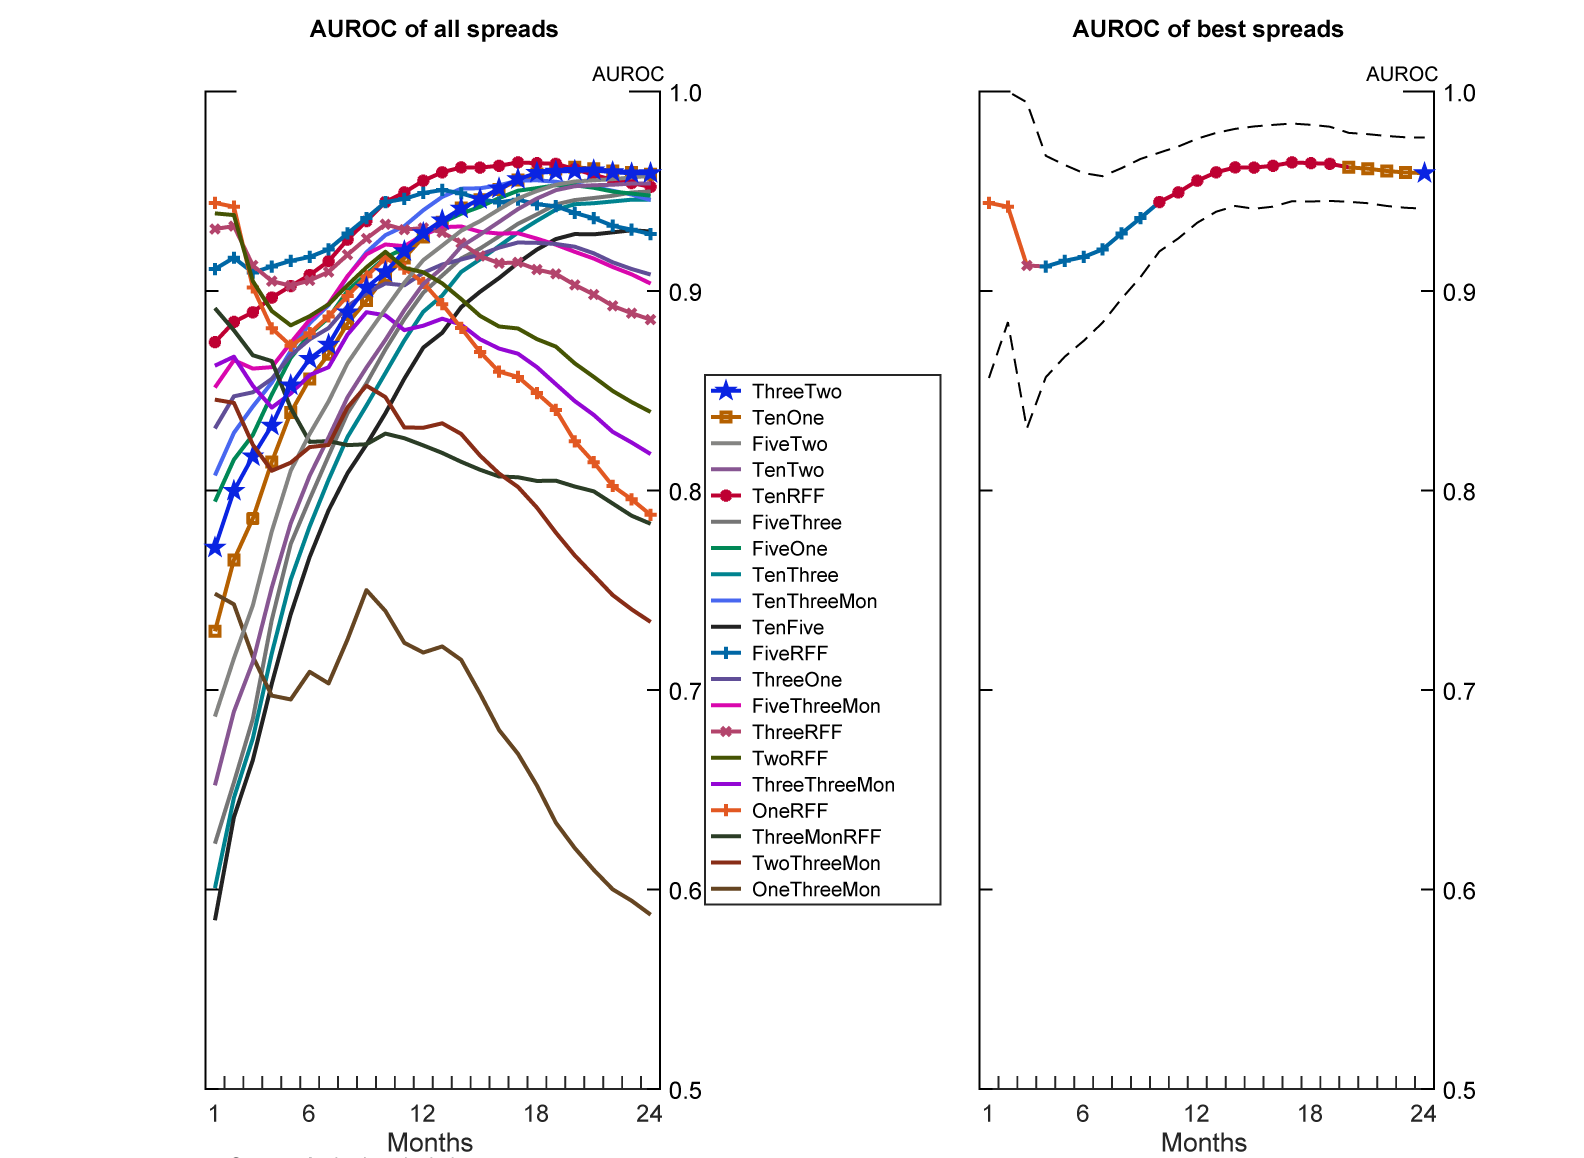
Legend entries ordered vertically by AUROC at horizon of 24 months.
Dashed lines indicate 95 percent confidence interval.
Source: Author's calculation.
Compared to Figure 1, different spreads are the most accurate predictor of a recession starting at most horizons. Figure 3 illustrates the sample from 1976-2010 to compare to previous figures. The most accurate predictor at most horizons is different still.
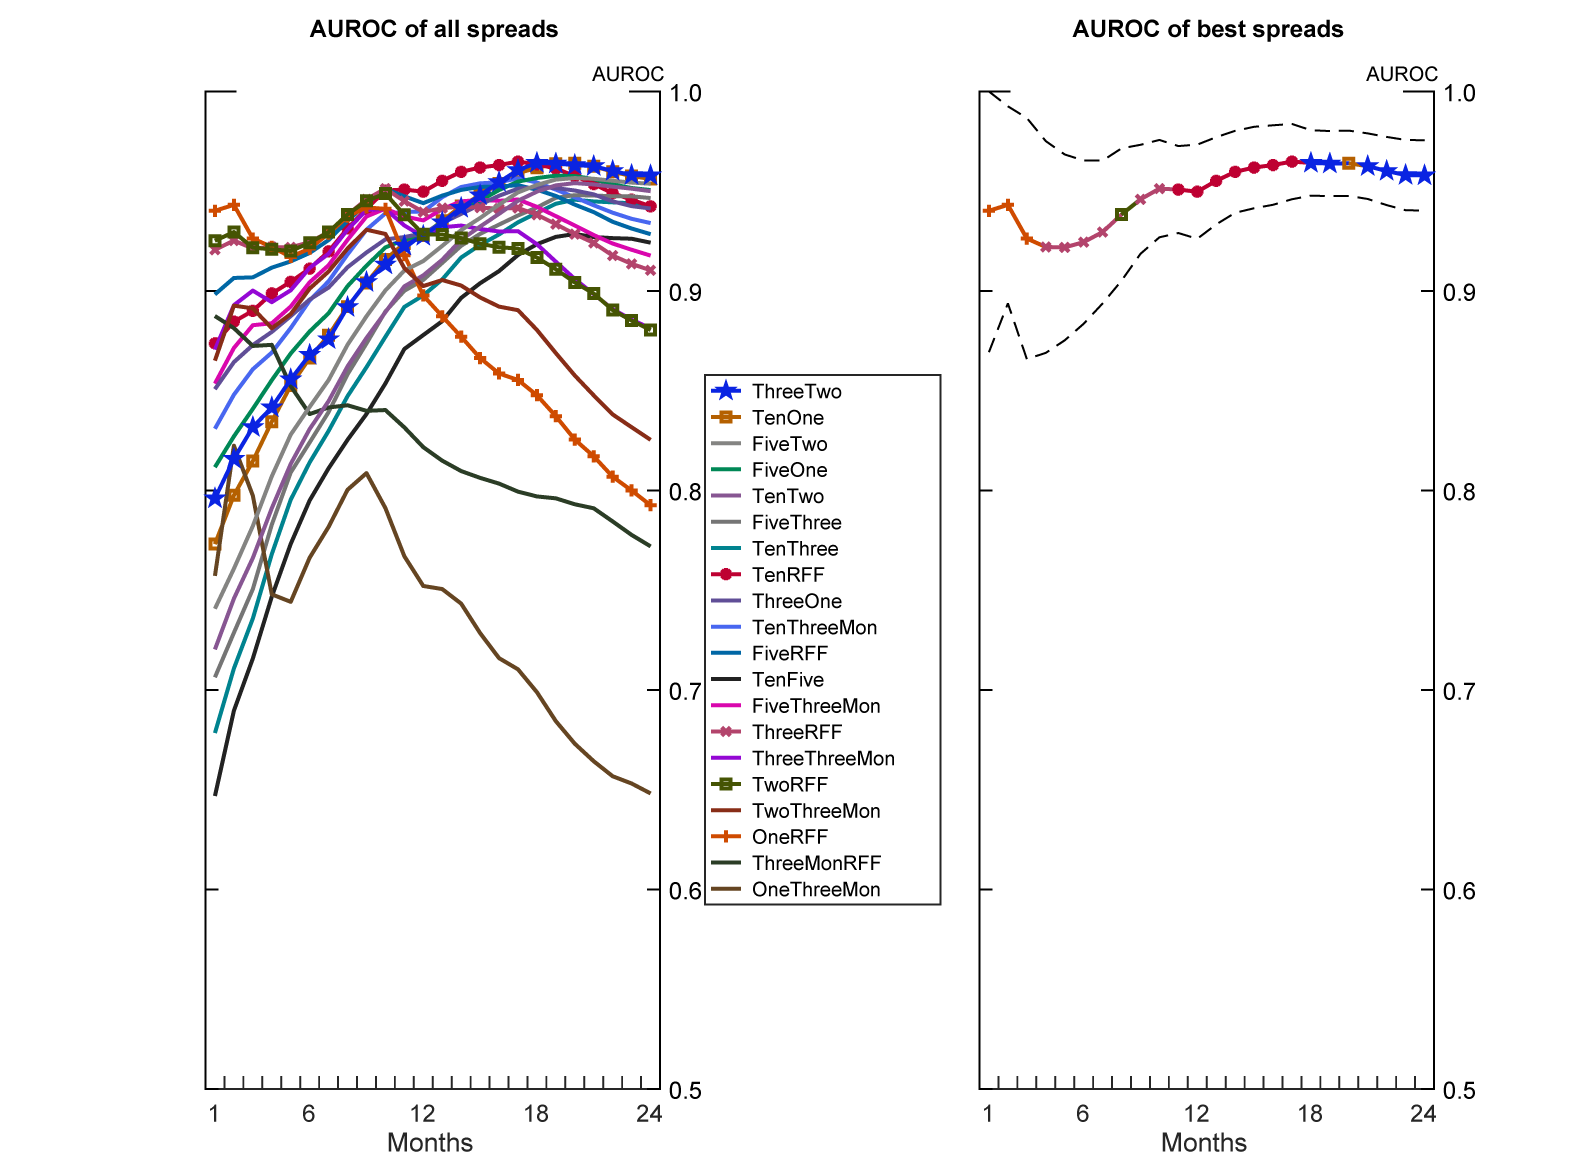
Legend entries ordered vertically by AUROC at horizon of 24 months.
Dashed lines indicate 95 percent confidence interval.
Source: Author's calculation.
Figure 3 illustrates the general guidelines regarding which spreads to use at different horizons. At short horizons, spreads between short and very short Treasury maturities are the most accurate, e.g. the spread between the 1-Year Treasury note and the effective Federal Funds Rate. At medium horizons, spreads between long and very short Treasury maturities are the most accurate, e.g. the spread between the 10-Year Treasury bond and the Federal Funds Rate. At long horizons, spreads between the medium and short Treasury maturities are the most accurate, e.g. the spread between the 3-Year Treasury note and 2-Year Treasury note.
Models Derived from Term Spreads
I test models that manipulate or augment term spreads to predict recessions in the same fashion I tested the pervious spread combinations. Specifically, I test the following models against the best spreads derived from the results above: Favara, Gilchrist, Lewis, and Zakrajsek (2016), which uses the excess bond premium to augment the 10-Year to 2-Year term spread, Johansson and Meldrum (2018), which uses the first three principal components of the yield curve, and Engstrom and Sharpe (2018), which uses the six-quarter one-quarter ahead forward to 3-month Treasury spread. I find that the principal components model is the most accurate, though generally statistically indistinguishable from the best spread calculated previously.
Figure 4 illustrates the sample from 1984 to 2018. Other samples are extremely similar. The Best line graphs the best simple term spread to use at each horizon.5 The principal components model is the most accurate predictor of recessions at all horizons between 6 and 20 months. The best simple spread measure wins at short horizons. The Favara, Gilchrist, Lewis, and Zakrajsek (2016) model shows some strength at long horizons.
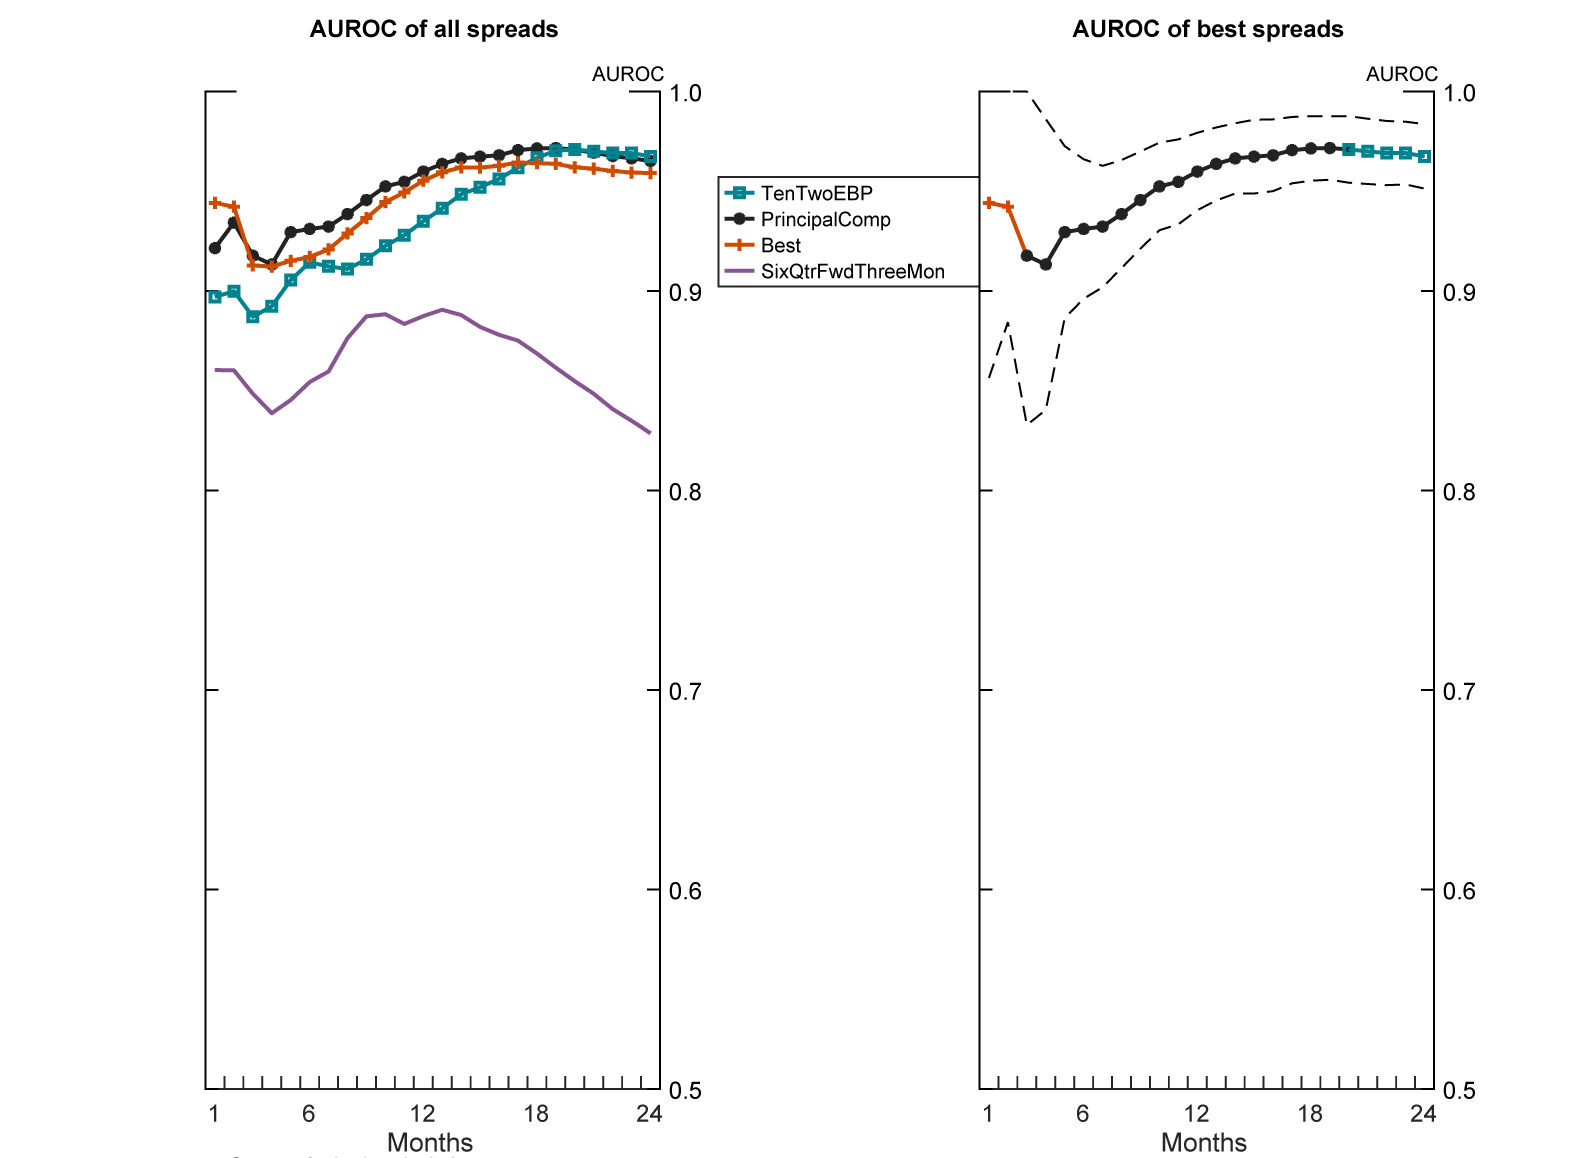
Legend entries ordered vertically by AUROC at horizon of 24 months.
Dashed lines indicate 95 percent confidence interval.
Source: Author's calculation.
The results are driven by the construction of the principal components model. From the previous results, long-very short spreads dominate at medium horizons. The principal components model's first component is, roughly, the slope of the yield curve--equivalent to a long-very short spread. The best spread at short horizons is a short-very short spread. The principal component model doesn't have the necessary degrees of freedom to mimic the short term curvature of the yield curve independently from the rest of the curve.
Conclusion
Without fully understanding the cause of recessions, and hence what meaning to derive from the yield curve, we will never discover a perfect predictor. While no single spread is robustly 'best', many spreads are statistically equivalent good predictors of recessions. The easiest rule-of-thumb is to use the principal components model of Johansson and Meldrum (2018).
References
Favara, Giovanni, Simon Gilchrist, Kurt F. Lewis, and Egon Zakrajsek (2016). "Recession Risk and the Excess Bond Premium," FEDS Notes. Washington: Board of Governors of the Federal Reserve System, April 8, 2016, http://dx.doi.org/10.17016/2380-7172.1739.
Johansson, Peter, and Andrew Meldrum (2018). "Predicting Recession Probabilities Using the Slope of the Yield Curve," FEDS Notes. Washington: Board of Governors of the Federal Reserve System, March 1, 2018, https://doi.org/10.17016/2380-7172.2146.
Engstrom, Eric C., and Steven A. Sharpe (2018). “The Near-Term Forward Yield Spread as a Leading Indicator: A Less Distorted Mirror," Finance and Economics Discussion Series 2018-055. Washington: Board of Governors of the Federal Reserve System, https://doi.org/10.17016/FEDS.2018.055r1. Forthcoming in the Financial Analyst Journal.
1. The 2-year Treasury note series begins in 1976. It is not included in samples that begin before that date. Return to text
2. Using an indicator of whether a given spread has inverted, rather than the spread itself, as the independent variable has similar results. Return to text
3. The analysis is robust to using a dependent variable that indicates the probability of transitioning to or remaining in a recession within the next [horizon] months, as is done in some of the literature. Return to text
4. Similar results hold if we exclude the effective lower bound period for short rates. Return to text
5. Hence the Best line is composed of different spreads at different horizons. Return to text
Miller, David S. (2019). "There is No Single Best Predictor of Recessions," FEDS Notes. Washington: Board of Governors of the Federal Reserve System, May 21, 2019, https://doi.org/10.17016/2380-7172.2367.
Disclaimer: FEDS Notes are articles in which Board staff offer their own views and present analysis on a range of topics in economics and finance. These articles are shorter and less technically oriented than FEDS Working Papers and IFDP papers.