FEDS Notes
September 25, 2020
What Do Quoted Spreads Tell Us About Machine Trading at Times of Market Stress? Evidence from Treasury and FX Markets during the COVID-19-Related Market Turmoil in March 2020
Dobrislav Dobrev and Andrew Meldrum1
The electronic platforms where recently-issued Treasury securities and Treasury futures contracts are traded are the most liquid markets for government securities in the world. They are at the heart of the financial system and play an important role in the transmission of monetary policy. Thus, it is important for policymakers to understand the unprecedented deterioration in trading conditions for Treasury securities on these electronic platforms in March of this year, as concerns about the impact of COVID-19 rapidly intensified. In this Note, we shed further light on the factors behind this deterioration.
In March, widespread stresses became evident in even the most highly liquid electronic trading platforms for benchmark (on-the-run) Treasury securities and Treasury futures contracts. These platforms are where dealers trade among themselves and other entities, including so called "principal trading firms" (PTFs). PTFs, along with some dealers, are known to adopt high-speed automated trading strategies that account for a significant share of trading. In previous periods of market stress, PTFs are known to have contributed to keeping quoted bid-ask spreads in these parts of the Treasury market relatively tight.2 However, in March, bid-ask spreads widened sharply also on the leading electronic trading platforms in cash Treasury markets. To fully understand why this happened, we need to use granular, high-frequency data on quotes and executed trades because it provides insights into how market participants changed their order placement and execution of trades.
We highlight four main results from our analysis:
- First, we find that quoted spreads did not merely rise to much higher than usual levels on average, but were also oscillating over a wider range; while at some points within the day spreads were substantially wider than on a typical day, at other times spreads were as narrow as on a typical day. This result suggests that market participants, likely including both dealers and PTFs, became less willing to replenish the order book fast enough to keep quoted bid-ask spreads consistently tight in these markets, which may have amplified the initial shock to liquidity, particularly for the 30-year bond.
- Second, using alternative volume-weighted quoted spread measures we put forward in this note, we also find evidence that some market participants employing machine trading strategies were nonetheless able to mitigate the increase in trading costs—by executing trades when bid-ask spreads were relatively tight.
- Third, we further document that liquidity conditions in Treasury futures markets deteriorated less than those in Treasury cash markets.
- Fourth, we find that quoted spreads in other liquid futures markets, such as those for major foreign exchange (FX) rates, increased notably more than most of the Treasury futures market (the exception being the 30-year Ultra Treasury bond futures contract). Our findings thus point to the systemic nature of the market strains in March, extending beyond differences in market structure and participation. Our findings also underscore the potential benefits from the use of sophisticated algorithmic execution strategies that can adapt rapidly to changing liquidity conditions.
Background to Treasury Market Strains in March 2020
End-investors in the Treasury market trade primarily on an over-the-counter basis with dealers, who make the market by providing quotes to buy and sell securities. During late February and early March, the prices of Treasury securities rose substantially and became more volatile, as concerns about the economic impact of COVID-19 intensified. At the same time, dealers faced heavy net selling pressure of Treasury securities from clients, and absorbed large volumes of Treasuries into their inventories, eventually running into constraints on their ability to purchase more Treasuries.3
Intuitively, we would anticipate dealers responding to heavy net selling from clients by cutting both bid (buy) and ask (sell) prices. However, prices actually rose substantially in the face of heavy selling through the first week of March. While prices subsequently began to fall, this was apparently insufficient to stem the flow of net client sales and reduce dealers' inventories. By mid-March, trading conditions had deteriorated to the point where some clients reportedly found it increasingly difficult to obtain quotes from dealers and execute trades, amid a significant widening in the spreads between bid and ask prices. We would typically interpret wider quoted spreads as an indication of worse liquidity conditions, as dealers seek greater compensation for the increased risk of making markets.
These stresses in the "dealer-to-client" part of the Treasury market spilled over into the more liquid "interdealer broker" part of the market where predominantly dealers and PTFs trade on electronic platforms. By far the largest such platform in the cash market is BrokerTec, where electronic trading in recently issued on-the-run securities takes place using a Central Limit Order Book (CLOB). On a CLOB, participants can post quotes for buying and selling securities, with incoming orders matched to outstanding quotes using an electronic matching engine. During past episodes of elevated market volatility and reduced market liquidity, high-speed electronic trading has functioned relatively smoothly.4 However, by mid-March, there were signs of unprecedented strains even in this most liquid part of the market. At the same time, market commentary pointed to a wider pullback from markets by some participants.
Using High-Frequency Data to Shed Light on the Functioning of Electronic Interdealer Broker Platforms
To properly understand the March strains in the functioning of electronic interdealer broker platforms in the Treasury market, we need to analyze sufficiently granular data capturing the orders placed and trades executed by high-speed trading entities.5 As a baseline for comparison, Figure 1 summarizes trading activity for the 10-year Treasury bond on the BrokerTec platform on February 21, a fairly typical day before the COVID-19 concerns intensified. In the top panel, we plot the prices of buyer-initiated trades as blue dots on the left axis and the prices of seller-initiated trades as red dots on the right axis. The black dots show the corresponding ask and bid quotes, respectively. The data are plotted at millisecond frequency; if trades or quotes occur at multiple price points within a millisecond, then we plot multiple dots at that time. On this typical day, prices and quotes varied more-or-less continuously, that is, without material price gaps between successive trades.
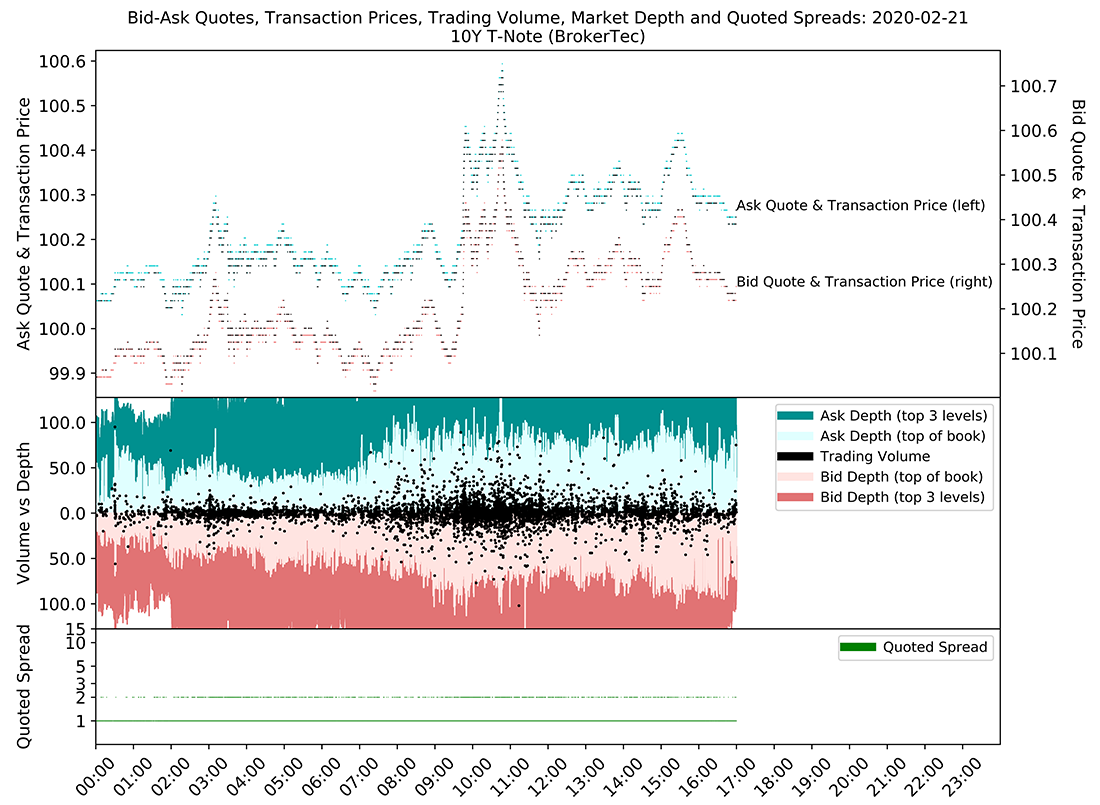
Source: BrokerTec and authors' calculations.
Note: Top panel units are $ per $100 par value; center panel units are $ millions, key identifies regions in order from top to bottom: Ask Depth (top 3 levels), Ask Depth (top of book), Trading Volume, Bid Depth (top of book), Bid Depth (Top 3 levels); bottom panel units are multiples of tick size (minimum price increment equal to 1.5625 cents per $100 of par value) with vertical axis based on a logarithmic scale. Time stamps for the cash market are Eastern Standard Time.
In the center panel, we plot the maximum volume of posted quotes ("market depth") across the top 1 and 3 ask prices during each millisecond above the horizontal axis, in pale and dark blue, respectively; and the depth across the top 1 and 3 bid prices below the horizontal axis, in pale and dark red, respectively. Using black dots, we also plot a measure of transaction flow: the sum of buyer- and seller-initiated trades in each millisecond, above and below the horizontal axis, respectively. On this typical day, the total trade flow in each millisecond is almost always well within the maximum depth available near top of the order book, which suggests that the volume of quotes replenishing the order book is adequate to cope with incoming trade flow without a substantial variation in bid-ask spreads.
The bottom panel confirms this conjecture. Here, we plot the spreads between the best ask and bid quotes as green dots. These spreads are again plotted at a millisecond frequency; if the spread varies within the millisecond, multiple dots may be plotted. On this typical day, we see quoted spreads oscillating between only two values, which are one tick (the minimum price increment) apart. That suggests that trades are consistently taking place at prices close to the best prices available within each millisecond, and that posted depth near the top of the book is being replenished quickly enough following executed trades to avoid exhausting multiple levels of the order book and any associated widening of the quoted spreads.
Now consider Figure 2, which shows the equivalent plots for March 13, just ahead of the unscheduled Federal Open Market Committee meeting on March 15, by which time liquidity conditions in the Treasury market had deteriorated substantially. We observe several instances with large gaps between successive prices and quotes (shown in the top panel) and when the trade flow within each millisecond was well outside the maximum posted depth (shown in the center panel), which had dropped to record low levels. In the bottom panel, we see that bid-ask spreads were much wider and more volatile than usual, at times oscillating over a range from one to more than ten ticks. Taken together, these observations tell us that, at times, order book replenishment must have been too slow to cope with the flow of orders. Large trade flows quickly used up all of the posted quotes near the top of the book (that is, at the best prices) and were executed at substantially worse prices for a period until the book was replenished and bid-ask spreads narrowed again.
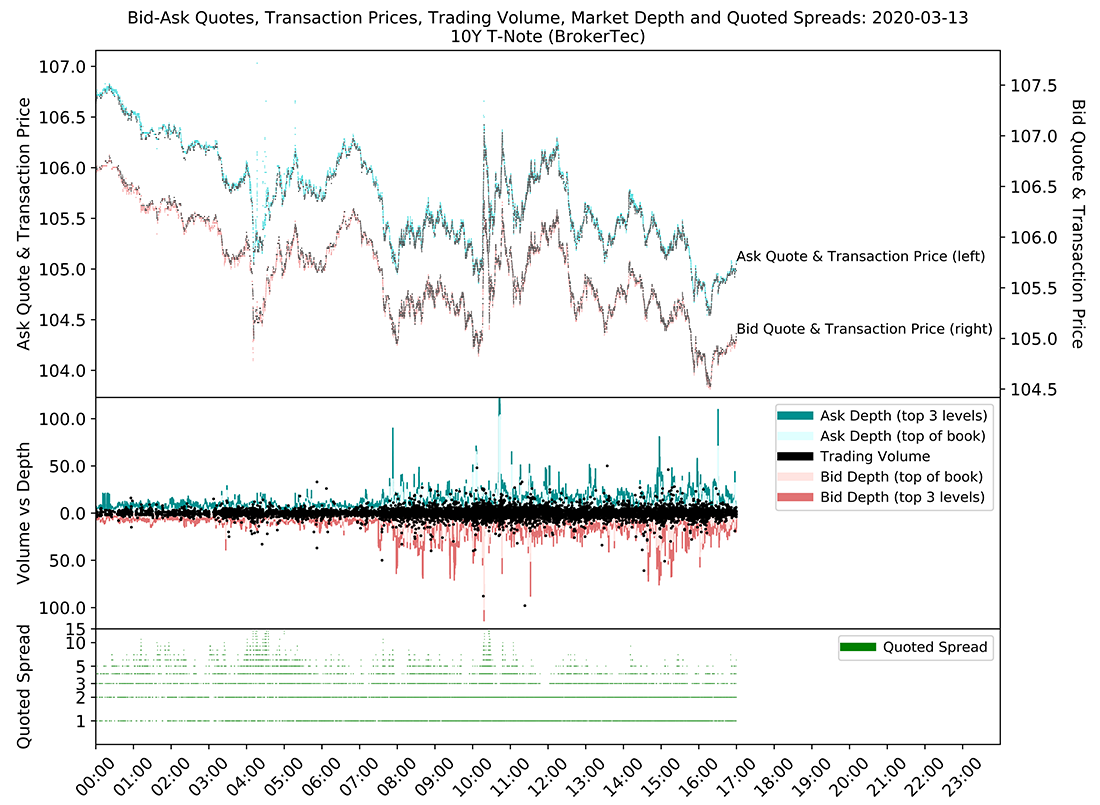
Source: BrokerTec and authors' calculations.
Note: Top panel units are $ per $100 par value; center panel units are $ millions, key identifies regions in order from top to bottom: Ask Depth (top 3 levels), Ask Depth (top of book), Trading Volume, Bid Depth (top of book), Bid Depth (Top 3 levels); bottom panel units are multiples of tick size (minimum price increment equal to 1.5625 cents per $100 of par value) with vertical axis based on a logarithmic scale. Time stamps for the cash market are Eastern Standard Time.
This inference strongly suggests an unusual reduction in how quickly dealers and PTFs were replenishing quotes on the order book in response to trades. As shown in the Joint Staff Report on the U.S. Treasury Market on October 15, 2014 (PDF), PTFs in particular (and likely also dealers employing high-speed trading technology) are able to support heightened trading volumes during periods of high volatility without widening bid-ask spreads; instead they tend to manage exposure to volatility risk by reducing posted depth and replenishing the order book faster as another way to support increased order flow during periods of elevated volatility. The fact that order book replenishment was not sufficiently fast to avoid significantly heightened bid-ask spread volatility in mid-March suggests that this episode was different: dealers, PTFs and other high-speed trading entities likely scaled down Treasury market-making activity, at least in aggregate. That may have been a rational response to a number of factors (potentially involving feedback loops), including: the considerably elevated economic uncertainty; the exceptionally high volatility of Treasury yields; the unusual correlations between Treasury yields and the prices of other assets; and possible concerns about the settlement risks associated with trades with counterparties experiencing financial strains.
How did Liquidity Evolve over Time According to Traditional Daily Average Bid-Ask Spread Measures?
Each of the above plots sheds light on trading conditions in a single security on a given day. To enable more straightforward comparisons across securities and over time, we next examine some standard time-series summary statistics. The red lines in Figure 3 plots time series of the daily average of quoted bid-ask spreads for 5-, 7-, 10-, and 30-year Treasuries. The spreads are expressed in terms of the tick size for each security, on a log scale. For all tenors, spreads rose sharply in mid-March, but the deterioration in liquidity was much greater for the 30-year bond than for shorter tenors, which is consistent with previous findings by Fleming and Ruela (2020), as well as market commentary at the time.6
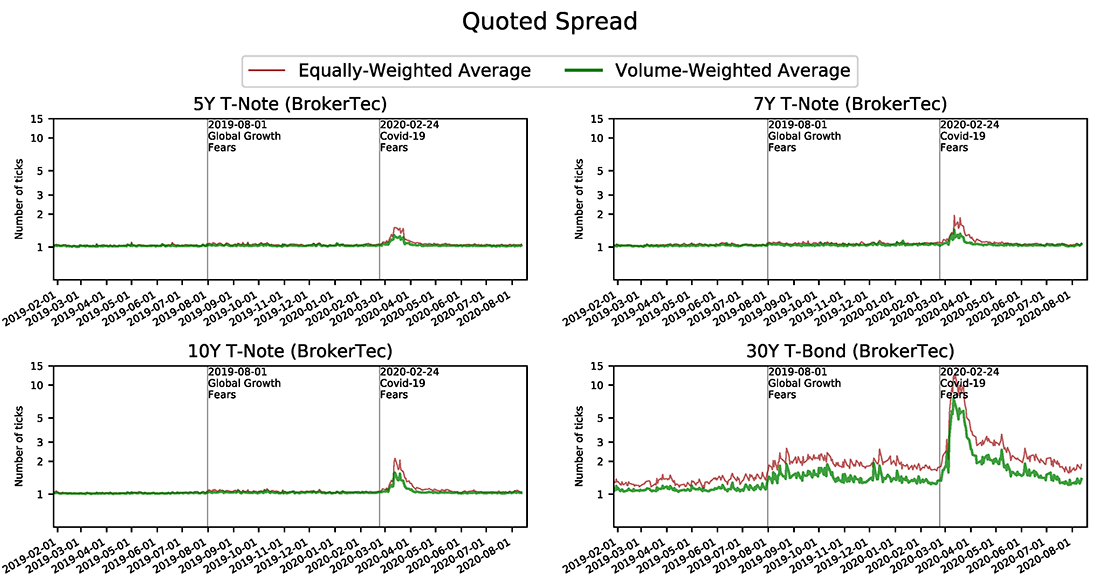
Source: BrokerTec and authors calculations.
Note: Bid-ask spreads are expressed as a multiple of tick size (minimum price increment). The tick size for the 5-year Treasury Note is 0.78125 cents per $100 of par value while that for the 7-year Treasury Note, 10-year Treasury Note and the 30-year Treasury bond is 1.5625 cents per $100 of par value. The vertical axis is based on a logarithmic scale.
The Federal Reserve took several policy actions in response to the strains in the Treasury market in mid-March, including purchases of Treasury securities.7 As a result of these actions, the passage of the CARES Act, and an improvement in investor sentiment, liquidity conditions in the Treasury market have since improved steadily. Spreads have fallen substantially since their peaks, although for the 30-year bond it took some time for spreads to subside closer to their prior levels.
Alternative Volume-Weighted Spread Measures Accounting for Modern Execution Strategies
As documented by Figure 2 above, at times when the order book is being replenished relatively slowly, not only the average level of bid-ask spreads may increase, but also the range over which the quoted bid-ask spreads oscillate may widen. We therefore also examine how the volatility of quoted spreads has varied over time. As shown by the red line in Figure 4, the intraday volatility of bid-ask spreads spiked sharply higher in mid-March but has since fallen back to pre-COVID-19 levels for all but the 30-year bond, for which it remains slightly elevated. Unreported results suggest that market depth was also slow to recover after its unusually large drop in mid-March, but the absence of price gapping and the reduction in the level and volatility of bid-ask spreads all suggest that order book replenishment has improved sufficiently to cope with transaction flows.
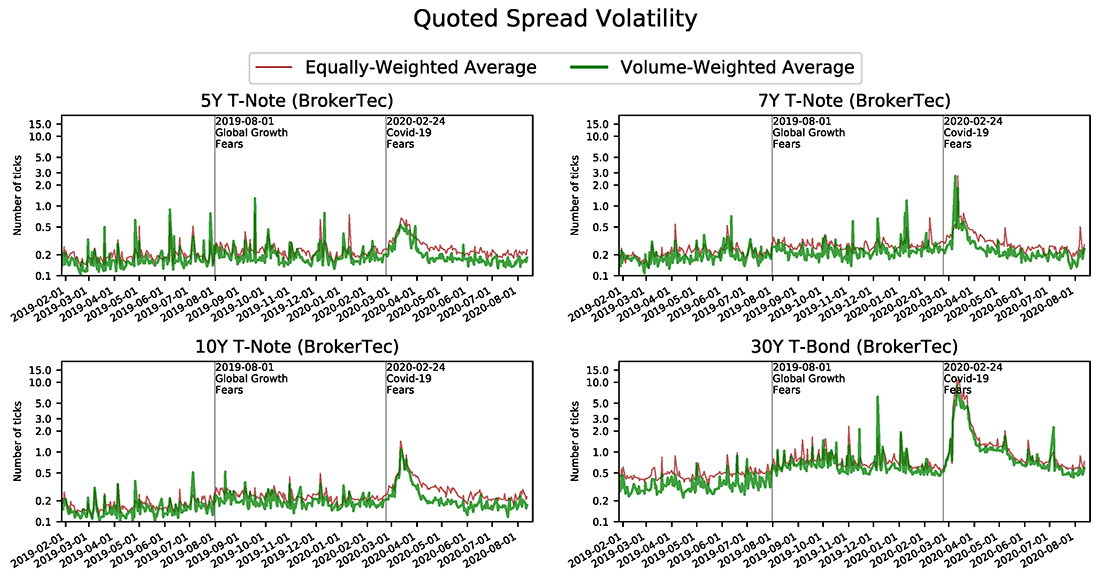
Source: BrokerTec and authors calculations.
Note: Bid-ask spread volatility is expressed as a multiple of tick size (minimum price increment). The tick size for the 5-year Treasury Note is 0.78125 cents per $100 of par value while that for the 7-year Treasury Note, 10-year Treasury Note and the 30-year Treasury bond is 1.5625 cents per $100 of par value. The vertical axis is based on a logarithmic scale.
The simple daily average of quoted bid-ask spreads reported in Figure 3 above is a popular metric for following changes in liquidity conditions over time. However, we note that they can be misleading in markets dominated by machine trading, where quote-to-trade ratios can routinely be as high as 100-to-1 and quoted spreads can become highly volatile during episodes of elevated market stress.8 As more sophisticated machine trading strategies may be able to respond to trading conditions in real time, it is actually possible that trading tends to take place predominantly at instances within the day when market liquidity conditions are more favorable. If so, simple daily averages of quoted spreads would overstate the trading costs faced by investors that employ sophisticated strategies to better time the execution of their trades.
The green lines in Figures 3 and 4 show alternative measures of the daily level and volatility of bid-ask spreads we put forward. These alternative measures are based on volume-weighted averaging of spreads, as a way to account for the actual amount of trading that takes place at each quoted spread value during the day. According to these volume-weighted average bid-ask spread measures, liquidity conditions experienced by sophisticated market participants worsened by much less, and have recovered much faster, than traditional unweighted measures would suggest.9 This result indicates that, rather than executing trades when bid-ask spreads were at their widest levels, some investors were able to use trading strategies that could wait a short period for spreads to narrow when the order book had been replenished. Of course, on the flip side, this result also underscores the potentially significant extra costs that could be incurred when trading large amounts without employing more sophisticated execution strategies, particularly at times of market stress.10
Before the COVID-19-related episode, the difference between equally- and volume-weighted spreads was small for most tenors because spreads did not vary substantially during the day. However, there was a modest gap between the two spread measures for the 30-year bond throughout 2019. This gap became a little wider after the financial market strains that emerged in August 2019, which market commentary linked to growing concerns about the outlook for global economic growth. Thus, it appears that machine trading strategies that optimize execution have been relatively important for the 30-year bond even before the recent, COVID-19-related strains.
Differences in Quoted Spread Levels and Volatility between Treasury Cash and Futures Markets
We next consider whether conditions in the Treasury futures market deteriorated less than in the cash market. One might have expected this to be the case for the following combination of reasons: The risk-adjusted volume of futures contracts traded on the CLOB at the Chicago Board of Trade (CBOT) can rival that of cash trading on BrokerTec, particularly during times of market stress.11 The number of participants engaging in all-to-all trading in the CBOT futures market is also much higher than that in the BrokerTec cash market. And futures trades are centrally cleared, which can reduce the settlement risk faced by participants, as recently discussed by Duffie (2020) (PDF). Thus, it does seems plausible for the futures market to have remained relatively liquid compared with the cash market in March.
To examine whether this is the case, we extend the above analysis using high-frequency data on Treasury futures trading at the CBOT. Figure 5 shows equally-weighted and volume-weighted daily average bid-ask spreads for various contracts.12 Spreads also increased sharply in mid-March but by much less than in the cash market (as is evident from a comparison with Figure 3). Liquidity conditions in the futures contract for the 30-year bond were again worse than for shorter tenors, but the difference was not as pronounced as in the cash market. Unreported results show that the volatility of bid-ask spreads also rose by less in the futures market than the cash market, while market depth fell by less and recovered faster. These findings suggest that futures markets did indeed remain more liquid than cash markets, and may provide the more reliable source of price information during times of stress, as recently noted also by Baker, McPhail and Tuckman (2020).
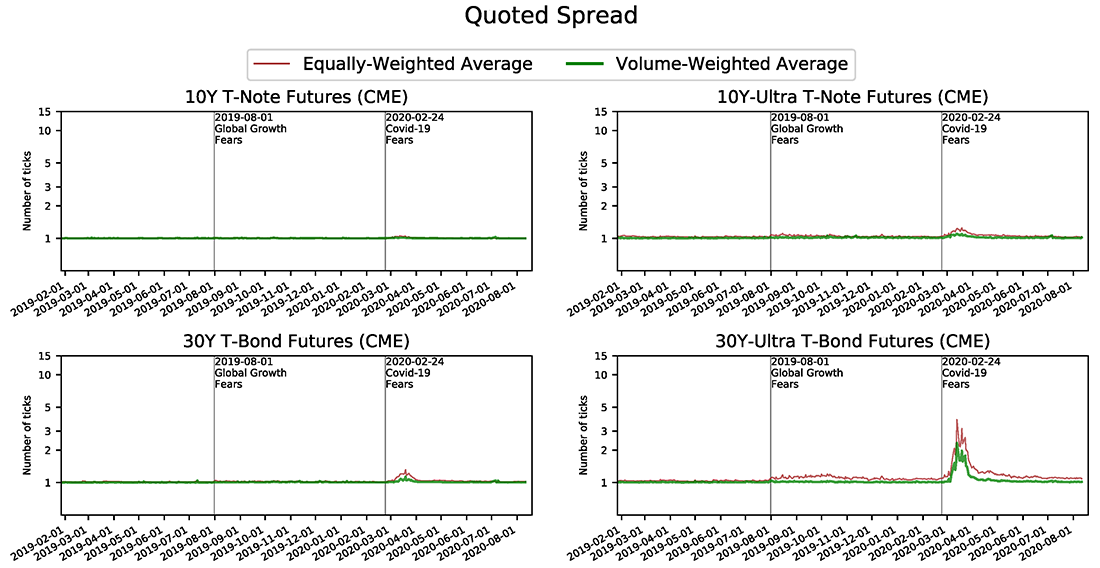
Source: Refinitiv, Datascope Tick History and authors calculations.
Note: Bid-ask spreads are expressed as a multiple of tick size (minimum price increment). The tick size for the 10-year Treasury Note Futures and the 10-year Ultra Treasury Note Futures is 1.5625 cents per $100 of par value, while that for the 30-year Treasury Bond Futures and the 30-year Ultra Treasury Bond Futures is 3.125 cents per $100 of par value. The vertical axis is based on a logarithmic scale.
Comparison with Quoted Spread Levels and Volatility in Futures Markets for Other Asset Classes
Given the role of the Treasury market at the heart of the financial system, it is natural to examine the extent to which strains were mirrored in other markets. We therefore extend our analysis to various other futures markets: foreign exchange (the dollar-euro and dollar-sterling exchange rates), equities (the S&P 500 e-mini contract), and crude oil (WTI futures).13
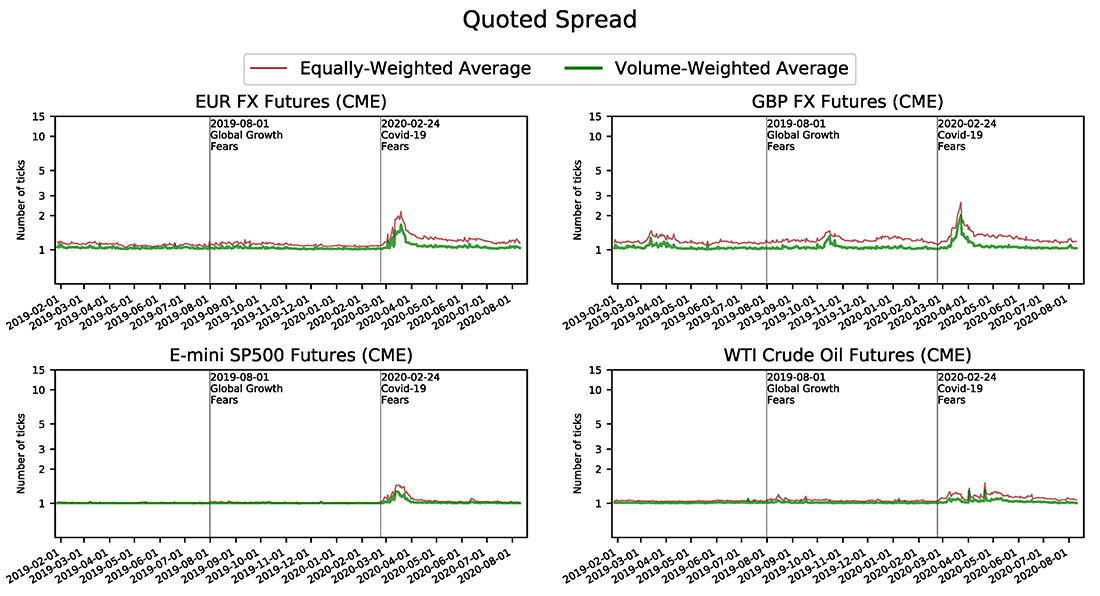
Figure 6 shows equally- and volume-weighted quoted spreads for these other futures contracts. The figure reveals that in foreign exchange markets there was also a notable increase in quoted spreads in mid-March and the gap between equally- and volume-weighted spreads widened. The deterioration in these markets was comparable to that for the 30-year Ultra Treasury bond futures and significantly larger than that of all other Treasury futures contracts with shorter duration. There was also some increase in quoted spreads in the equity futures market, albeit to a lesser extent. In contrast, quoted spreads in the oil futures market remained relatively stable throughout March; there have only been a couple of small, very short-lived spikes in the volume-weighted spread measure around the time of front month contract expiration when prices briefly breached negative territory due to unusually elevated costs of physical delivery.
Quoted spreads in the considered FX futures markets therefore appear to indicate potentially more severe strains in liquidity provision than energy futures markets, equity futures markets, and Treasury futures markets (with the exception of the 30-year Ultra Treasury Bond Futures), even though FX market volatility was not as elevated.14 Unreported results show that spot FX markets for these and other currency pairs have also exhibited similar levels of deterioration in quoted spreads as in FX futures markets. Furthermore, the fact that volume-weighted spreads were consistently lower than equally-weighted spreads in FX markets is again indicative of the role played by sophisticated execution strategies during the COVID-19 market turmoil.15
Overall, our findings that FX markets appear to have exhibited greater strains than Treasury markets (with the exception of the longest dated Treasuries) in terms of quoted spread levels and volatility thus point to a systemic nature of the market turmoil in March 2020 extending beyond differences in market structure and participation. The persistent wedge we document between volume-weighted and equally-weighted quoted spreads in both Treasury and FX markets underscores the potential benefits from the use of more sophisticated algorithmic execution strategies capable of adapting in real time to rapidly changing liquidity conditions.
Source: Refinitiv, Datascope Tick History and authors calculations.
Note: Bid-ask spreads are expressed as a multiple of tick size (minimum price increment). The tick size for the Euro FX Futures is 0.005 cents per euro, the tick size for the British Pound Futures is 0.01 cents per pound, the tick size for the E-mini S&P 500 Futures is 25 cents per index point, while that for the WTI Crude Oil Futures contract is 1 cent per barrel. The vertical axis is based on a logarithmic scale.
References
Baker L., L. McPhail, and B. Tuckman (2020). "The Liquidity Hierarchy in the US Treasury Cash and Futures Market." Journal of Fixed Income, 30 (1), pp. 90-99.
Bank for International Settlements (2018). "Monitoring of Fast Paced Electronic Markets", Markets Committee Report, No 10.
Bank of England (2020). "Interim Financial Stability Report: May 2020 (PDF)."
Brainard, L. (2018). "The Structure of the Treasury Market: What Are We Learning?" Speech delivered at "The Evolving Structure of the U.S. Treasury Market" Fourth Annual Conference, Federal Reserve Bank of New York, December 3, 2018.
Board of Governors of the Federal Reserve System (2020). "Financial Stability Report: May 2020 (PDF)."
Board of Governors of the Federal Reserve System (2020). "Monetary Policy Report submitted to the Congress on June 12, 2020, pursuant to section 2B of the Federal Reserve Act."
Brain, D., M. De Pooter, D. Dobrev, M. Fleming, P. Johansson, C. Jones, F. Keane, M. Puglia, L. Reiderman, T. Rodrigues, and O. Shachar (2018). "Unlocking the Treasury Market through TRACE." FEDS Notes. Washington: Board of Governors of the Federal Reserve System, September 28, 2018, https://doi.org/10.17016/2380-7172.2251.
Chung, K.H., B.F. Van Ness, and R.A. Van Ness (2004). "Trading Costs and Quote Clustering on the NYSE and NASDAQ after Decimalization." Journal of Financial Research, 27, pp. 309-328.
Dobrev, D. and E. Schaumburg (2018). "High-Frequency Cross-Market Trading: Model Free Measurement and Applications (PDF)." Working Paper, Federal Reserve Bank of Atlanta Workshop on "Financial Stability Implications of New Technology", October 18-19, 2018.
Duffie, D. (2020). "Still the World's Safe Haven? Redesigning the U.S. Treasury Market after the COVID-19 Crisis (PDF)." Hutchins Center Working Paper 62.
Federal Open Market Committee (2020). "Minutes of the Federal Open Market Committee, March 15, 2020."
Fleming M., B. Mizrach and G. Nguyen (2018). “The Microstructure of a U.S. Treasury ECN: The BrokerTec Platform.” Journal of Financial Markets, 40, pp. 2-22.
Fleming M., G. Nguyen, and F. Ruela (2019). "Tick Size Change and Market Quality in the U.S. Treasury Market (PDF)." Federal Reserve Bank of New York Staff Reports No. 886.
Fleming, M. and F. Ruela (2020). "Treasury Market Liquidity during the COVID-19 Crisis." Federal Reserve Bank of New York Liberty Street Economics, April 17, 2020.
Harkrader J. C. and M. Puglia (2020). "Principal Trading Firm Activity in Treasury Cash Markets," FEDS Notes. Washington: Board of Governors of the Federal Reserve System, August 04, 2020, https://doi.org/10.17016/2380-7172.2620
Holden, C.W. and S. Jacobsen (2014). "Liquidity Measurement Problems in Fast, Competitive Markets: Expensive and Cheap Solutions." The Journal of Finance, 69, pp. 1747-1785.
Joint Staff Report (2015). "The U.S. Treasury Market on October 15, 2014 (PDF)." U.S. Department of the Treasury, Board of Governors of the Federal Reserve System, Federal Reserve Bank of New York, U.S. Securities and Exchange Commission, and U.S. Commodity Futures Trading Commission.
Johnson, O. (2020). "Bond Trading: Setting Recent Volatility in Context." CME Group, June 2020.
Nguyen G., R. Engle, M. Fleming and E. Ghysels (2020). “Liquidity and Volatility in the U.S. Treasury Market.” Journal of Econometrics, 217, pp. 207-229.
Ranasinghe D. and S. Chatterjee (2020). “Pandemic Propels Old-School Bond Traders Towards an Electronic Future.” Reuters Business News, June 22, 2020.
Schrimpf, A., H.-S. Shin, and V. Sushko (2020). "Leverage and Margin Spirals in Fixed Income Markets during the COVID-19 Crisis." BIS Bulletin 2, April 2, 2020.
Wilkes T. and S. Chatterjee (2020). "Locked-Down Investors Aim Algorithms at Chaotic Currency Markets." Reuters Business News, April 17, 2020.
1. We thank Alain Chaboud, Michiel De Pooter, Don Kim, and Peter Van Tassel for helpful discussions. Return to text
2. PTFs have become increasingly important in electronic financial markets over the past several years. They now account for the majority of traded volumes on electronic interdealer broker platforms in the Treasury market, playing an important role in the provision of liquidity by posting quotes and replenishing those quotes quickly. For further details see the Joint Staff Report on the U.S. Treasury Market on October 15, 2014 (PDF) (the JSR), Brain et al (2018) and Harkrader and Puglia (2020), among others. Return to text
3. For further discussion of these developments, see for example the Minutes of the March 15, 2020 FOMC Meeting, the May 2020 Financial Stability Report (PDF), and Schrimpf, Shin, and Sushko (2020) (PDF). Return to text
4. As discussed in the JSR (PDF), this was the case during the Treasury market flash rally on October 15, 2014. Return to text
5. Our analysis is in part based on transaction and order book data from the BrokerTec platform analyzed in related work by Fleming, Mizrach and Nguyen (2018), Fleming, Nguyen and Ruela (2019) (PDF),Fleming and Ruela (2020) and Nguyen, Engle, Fleming and Ghysels (2020). Return to text
6. See also Johnson (2020) for analysis of the observed changes in trading costs in the 30-year bond relative to volatility. Return to text
7. A summary of these actions was provided by the June 2020 Monetary Policy Report. Return to text
8. The need for alternative ways of gauging liquidity and transaction costs for markets dominated by high-speed algorithmic trading has been discussed previously by Brainard (2018). More broadly, new challenges with measuring liquidity in fast-paced electronic markets have been studied also by Holden and Jacobsen (2014), the Bank for International Settlements (2018) and Dobrev and Schaumburg (2018) (PDF), among others. Return to text
9. While the volume-weighted average spread (VWAS) measures we employ are constructed similarly to often-applied volume-weighted average prices (VWAP), to the best of our knowledge, the concept of VWAS is not as well established as VWAP and certainly not for the purpose we employ VWAS for. Of note, though, unrelated prior work by Chung, Van Ness and Van Ness (2004) has employed VWAS measures in the cross-section of stocks (rather than in the time series dimension as we do) for the purposes of comparing quoted spreads across different exchanges. Volume-averaging can be applied also to other liquidity measures traditionally aggregated by simple averaging. We leave this for further research beyond the scope of this Note. Return to text
10. Naïve "time-weighted average price" (TWAP) trading strategies would have faced trading costs roughly corresponding to the simple weighted averages of bid-ask spreads. Our results therefore reveal a significant footprint of other more sophisticated trading strategies that are able to adapt trade execution in response to changes in liquidity conditions in real time. Consistent with this, a Thomson Reuters news article by Ranasinghe and Chatterjee (2020) “Pandemic propels old-school bond traders towards an electronic future” notes that the deterioration in liquidity conditions in Treasury markets during the COVID-19-related market turmoil in March pushed some of those previously not trading electronically to break orders up into smaller chunks and process them electronically, thereby contributing to an increase in more sophisticated execution of trades. Return to text
11. See Baker, McPhail and Tuckman (2020). Return to text
12. The chart plots these for the standard 10-Year Treasury Note Futures, the 10-Year Ultra Treasury Note Futures, the standard 30-year Treasury Bond Futures and the 30-year Ultra Treasury Bond Futures. The plotted daily values are for the most liquid contract month of each Treasury futures contract. Return to text
13. We again report results for the most liquid contract month of each of these futures contracts. Return to text
14. The notable increase in quoted spreads in FX markets relative to other government bond markets has been noted also in the May 2020 Bank of England Interim Financial Stability Report (PDF). Return to text
15. Also consistent with our findings, a Thomson Reuters news article by Wilkes and Chatterjee (2020) "Locked-down investors aim algorithms at chaotic currency markets" notes the surge in use of machine trading algorithms for improved execution of trades during the COVID-19 related strains in FX markets. Return to text
Dobrev, Dobrislav, and Andrew Meldrum (2020). "What Do Quoted Spreads Tell Us About Machine Trading at Times of Market Stress? Evidence from Treasury and FX Markets during the COVID-19-Related Market Turmoil in March 2020," FEDS Notes. Washington: Board of Governors of the Federal Reserve System, September 25, 2020, https://doi.org/10.17016/2380-7172.2748.
Disclaimer: FEDS Notes are articles in which Board staff offer their own views and present analysis on a range of topics in economics and finance. These articles are shorter and less technically oriented than FEDS Working Papers and IFDP papers.