IFDP Notes
April 11, 2017
Corporate Buybacks and Capital Investment: An International Perspective
Joseph W. Gruber and Steven B. Kamin1
In recent years, a great deal of attention has been paid in the United States to the simultaneous occurrence, depicted in Figure 1 below, of relatively weak corporate capital investment (especially at this point in the business cycle) and historically elevated net share buybacks.2 (Dividend payments, which like buybacks distribute resources to shareholders, are also high by historical standards; however, the increase in buybacks has been more pronounced and hence has attracted more attention.) Much of this commentary bemoans the fact that corporations are returning resources to shareholders instead of using them to boost capital investment, economic growth, and jobs.
But the causal connection between equity buybacks and dividends, on the one hand, and capital expenditures, on the other, is murky. One possibility, consistent with the hypothesis noted above, is that corporations are actively reducing investment in order to finance share repurchases and dividend payments. Another interpretation, though, is that pessimism about future demand and economic growth is leading corporations to defer capital spending, and companies are simply returning cash to their shareholders for want of attractive investment opportunities. Finally, it may simply be coincidence – or the result of correlations of both buybacks and investment with third factors – that payouts have surged around the time that investment has weakened.
Several studies of U.S. firms provide some, albeit inconclusive, evidence in support of the first hypothesis listed above: that a desire to boost payouts to shareholders explains the weakness of investment. Gutierrez and Philippon (2016) show that U.S. corporate investment has fallen below levels indicated by Tobin's Q, a measure of the prospective profitability of investment projects, and this underperformance in part owes to "changes in governance that encourage shares buyback instead of investment." Lee, Shin, and Stultz (2016) find that the relationship for U.S. industries between Tobin's Q and external financing has broken down, and high-Q industries tend to exhibit heavy share repurchases and weak investment spending. Almeida, Fos, and Kronlund (2016) show that firm decisions to repurchase shares are associated with reduced investment.

To shed further light on this issue, we exploit the fact the elevated payouts to shareholders and weak corporate investment of recent years have not been confined to the United States, but, as indicated in the figures below, are a global phenomenon. Figure 2 plots GDP-weighted averages of share repurchases, dividend payments, and corporate investment for 26 OECD economies (including the United States); figure 3 plots median averages of these same variables, in order to prevent the largest economies from dominating the sample. (An appendix provides details on the data used in the paper.)
Figure 2: Buybacks, Dividends, and Investment - GDP Weighted Average*

* Average across economies, weighted by share of nominal GDP. Return to figure

Is there a systematic relationship between corporate payouts (both buybacks and dividends) and capital spending? We can examine the cross-country variation in these variables to address that question. Figure 4 is a scatterplot of changes in corporate payouts and investment from the period largely preceding the global financial crisis (2002-2008) to the period after the crisis (2009-2014); each dot represents the data for a separate economy. On the x-axis is plotted the change in the sum of corporate buybacks and dividends, deflated by the GDP deflator and scaled by the real corporate capital stock. On the y-axis is plotted the change in real corporate investment, scaled by the capital stock, from before to after the GFC.

The figure indicates that most countries experienced both increases in buybacks and dividends and declines in investment spending. However, it shows no statistically significant relationship between the two variables across countries. Thus, it provides no evidence either that increasing share repurchases was a motivation for cutting back on investment, or that a lack of investment opportunities was a central reason for boosting repurchases.
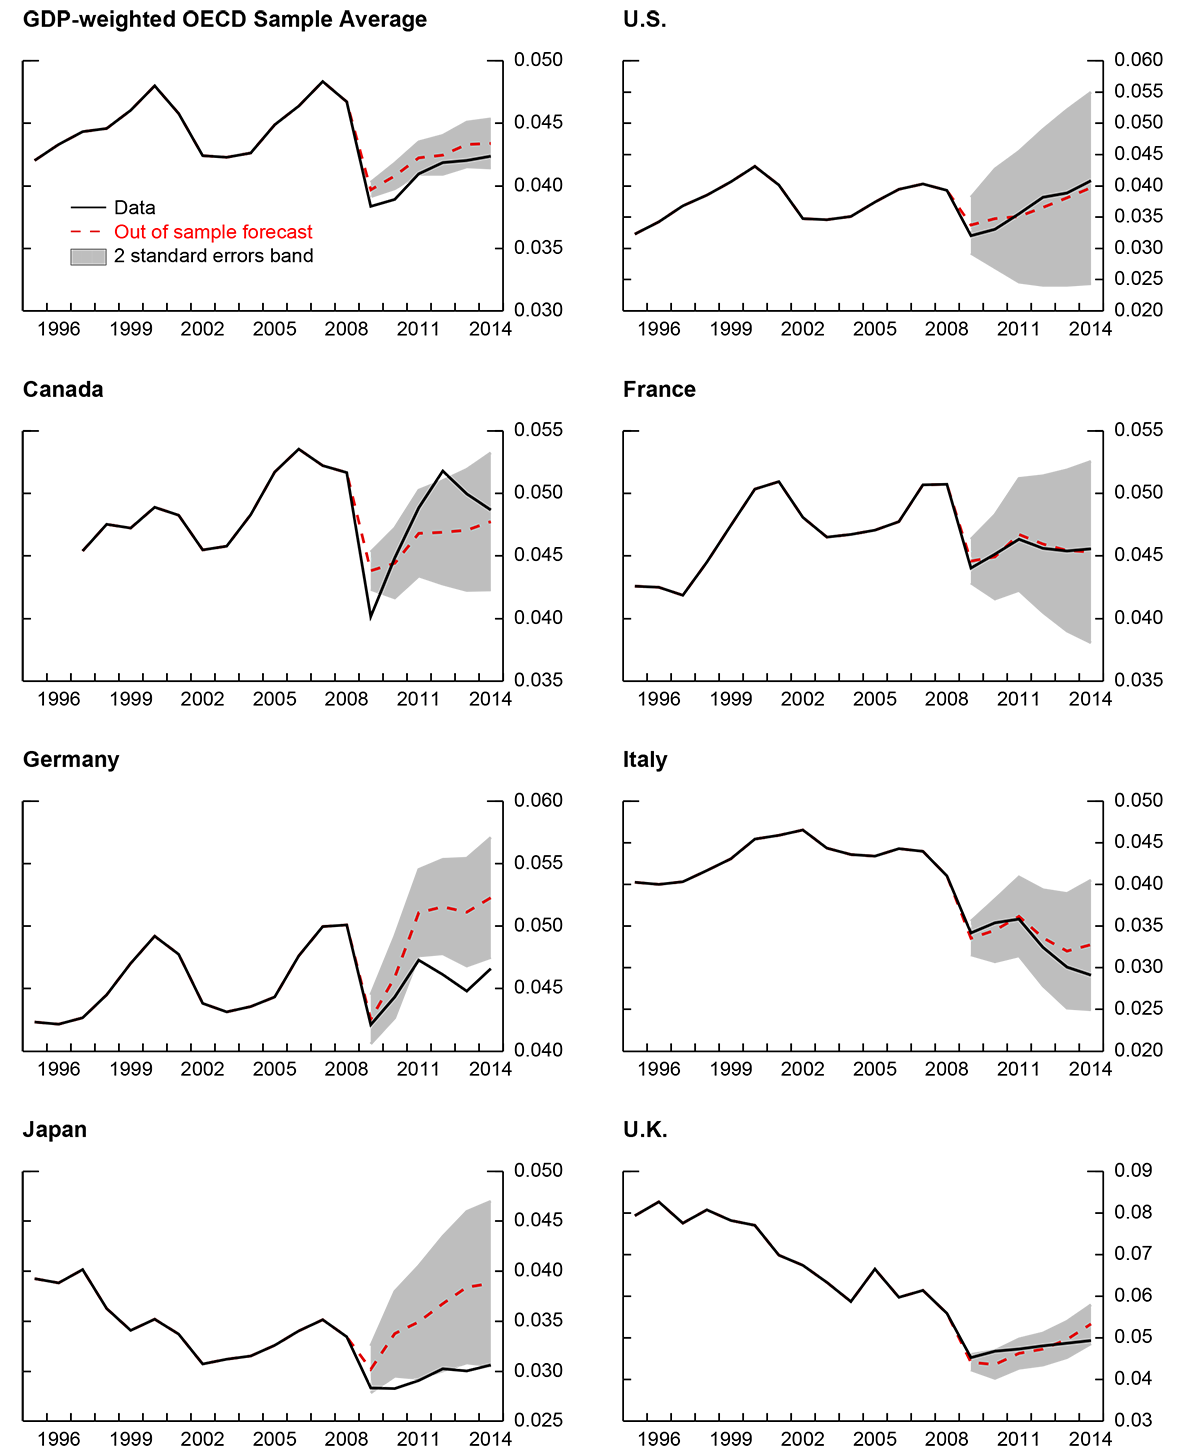
However, Figure 4 does not provide a clear reading on the relationship between buybacks, dividends, and investment since it does not hold constant the other factors that might also influence investment. To address this problem, and as described in Gruber and Kamin (2016), we estimated a cross-country panel regression model for investment as a share of the capital stock; this specification is based on traditional accelerator models as described in Oliner, Rudebusch, and Sichel (1995). As shown in the first column of Table 1, the explanatory variables include lagged investment (I/K), GDP growth (ΔY/K), change in the user cost of capital ΔCost/K (which incorporates interest rates and the change in the investment deflator), a time trend, and corporate profits. The model is estimated for the period 1995-2008 and then used to forecast out of sample for 2009-2014; actual values of the explanatory variables during this period are used as inputs, except for lagged investment, which is forecast dynamically. As might be expected, the results in Table 1 show that investment increases with the growth of output and profits; however, somewhat surprisingly, higher costs are also associated with increased investment. The out-of-sample forecasts for the regression in column 1 are shown in Figure 5. By and large, the model does a good job of tracking actual investment since the GFC. However, it overpredicts investment for the GDP-weighted average of OECD sample countries by a small, not-statistically-significant margin, and it overpredicts investment for a number of countries, such as Germany and Japan, more substantially.
Table 1: Panel Regression
Dependent Variable: It/Kt-1
| (1) 1995-2008 |
(2) 1995-2014 |
|
|---|---|---|
| ΔYt/Kt-1 | 0.27* 10.35 |
0.25* 12.56 |
| ΔYt-1/Kt-1 | 0.07* 2.10 |
0.07* 3.66 |
| It-1/Kt-1 | 0.79* 21.91 |
0.74* 23.20 |
| ΔCostt/Kt-1 | 13.67* 4.21 |
9.90* 2.98 |
| Time Trend*1000 | 0.10** 1.71 |
0.07** 1.63 |
| Profits/Kt-1 | 0.05* 2.28 |
0.06* 2.27 |
| Net Dividend Payments/Kt-1 | -0.04 -1.13 |
|
| Equity Buybacks/Kt-1 | 0.00 0.29 |
|
| #Observations | 307 | 409 |
| R^2 | 0.96 | 0.94 |
| SER | 0.003 | 0.004 |
| D-W Statistic | 1.74 | 1.73 |
Note: All regressions include unreported constant, 1/K(t-1), and country fixed effects.
* indicates significance at the 5 percent level. ** indicates significance at the 10 percent level. T-statistics reported under coefficients.
For those countries where investment proved weaker than predicted by the model, might this shortfall be explained by the rise in buybacks and dividends? To assess this possibility, for each country we compute the difference between actual investment spending and the investment predicted by our panel regression model. Figure 6 shows the correlation across countries between the change in buybacks and dividends since the GFC, on the x axis, and the unexplained part of the change in investment, on the y axis. But, again, there is no statistically significant relationship between the two variables. In addition, the second column of Table 1 extends our investment regression to include buybacks and net dividend payments as explanatory variables. Insignificant coefficients on both dividends and buybacks are consistent with the lack of significant statistical correlation identified in Figure 6.

In conclusion, we find little evidence that economies that have experienced larger shortfalls in corporate investment spending have experienced larger increases in share buybacks and/or dividend payments. It may be that these two developments are genuinely unrelated, and that even had investment opportunities around the world been more plentiful, we would still have seen increases in corporate buybacks. For example, corporations may be taking advantage of low interest rates and borrowing to finance buybacks, regardless of their profits and investment opportunities.
But it could also be that the recent relationship between buybacks and capital spending is not apparent at the aggregate, economy-wide level, and can only be identified using firm- and industry-level data, as in Gutierrez and Philippon (2016) and Lee, Shin, and Stultz (2016). Accordingly, more analysis of this issue is needed.
DATA APPENDIX
Country Sample: Austria, Belgium, Canada, Czech Republic, Denmark, Estonia, Finland, France, Greece, Hungary, Ireland, Germany, Italy, Japan, Korea, Netherlands, Norway, Poland, Portugal, Slovak Republic, Slovenia, Spain, Sweden, Switzerland, United Kingdom, United States.
Data Sources and Descriptions:
GDP: Real and nominal GDP are from the OECD Economic Outlook.
GDP and Investment Deflators: From the OECD Economic Outlook with the exception of the United States which are taken from the BEA National Accounts. The OECD investment deflators are for Gross Fixed Capital Formation. For the United States, the investment deflator is for Private Fixed Investment.
Real Capital Stock: From the OECD Economic Outlook.
Investment, Profits, Net Dividends: All data is for the non-financial corporate sector with the exception of Switzerland where the data is for the total corporate sector. Data are from the OECD National Accounts, with the exception of the United States and Canada where data are from their respective national Integrated Macroeconomic Accounts.
- Investment is defined as gross fixed capital formation.
- As described in the text, profits are defined as the gross operating surplus less net interest payments, rent, and taxes.
- Net dividends are the distributed payments of corporations plus reinvested earnings on foreign direct investment in the domestic economy less the distributed income of corporations and reinvested earnings of domestic corporations abroad.
Share Buybacks: The negative of the net incurrence of equity liabilities from the OECD National Accounts. Except for the U.S and Canada, where the data are from national Integrated Macroeconomic Accounts.
Interest Rates: 10-year sovereign bond yields from the OECD Economic Outlook. Except for Estonia where the lending rate as reported in the World Bank World Development Indicators was used.
Depreciation Rate: Productive capital stock scrapping rate as reported in the OECD Economic Outlook.
REFERENCES
Almeida, Heitor, Vyacheslav Fos, and Mathias Kronlund (2016), "The Real Effects of Share Repurchases," Journal of Financial Economics, 119, 168-185.
Brettell, Karen, David Gaffen, and David Rohde (2015), "The Cannibalized Company" Reuters Special Report.
Gutierrez, German and Thomas Philippon (2016), "Investment-Less Growth: An Empirical Investigation," NBER Working Paper 22897, December.
Gruber, Joseph and Steven Kamin (2016), "The Corporate Saving Glut and Falloff of Investment Spending in OECD Economies", IMF Economic Review, 64:777.
Hanauer, Nick (2015), "Stock Buybacks are Killing the American Economy," The Atlantic, February 8. http://www.theatlantic.com/politics/archive/2015/02/kill-stock-buyback-to-save-the-american-economy/385259/
Koller, Tim (2015), "Are Share Buybacks Jeopardizing Future Growth?" McKinsey & Company, October. http://www.mckinsey.com/business-functions/strategy-and-corporate-finance/our-insights/are-share-buybacks-jeopardizing-future-growth
Lazonick, William (2014), "Profits Without Prosperity," Harvard Business Review, September. https://hbr.org/2014/09/profits-without-prosperity
Lee, Dong, Han Shin, and Rene Stulz (2016), "Why Does Capital No Longer Flow More to the Industries with the Best Growth Opportunities," NBER Working Paper 22924, December.
Oliner, Stephen, Glenn Rudebusch, and Daniel Sichel (1995) "New and Old Models of Business Investment: A Comparison of Forecasting Performance," Journal of Money, Credit and Banking, Vol. 27, No. 3.
Trainer, David (2016), "How Stock Buybacks Destroy Shareholder Value," Merrill Edge Trading, February 24. https://www.newconstructs.com/buybacks-destroy-shareholder-value/
Wang, Lu and Callie Bost (2014), "S&P 500 Companies Spend Almost All Profits on Buybacks," Bloomberg, October 6. https://www.bloomberg.com/news/articles/2014-10-06/s-p-500-companies-spend-almost-all-profits-on-buybacks-payouts
1. The authors are Associate Director and Director of the International Finance Division, Board of Governors of the Federal Reserve System, Washington DC 20551 U.S.A. They can be reached at [email protected] and [email protected]. The views in this paper are solely the responsibility of the authors and should not be interpreted as reflecting the views of the Board of Governors of the Federal Reserve System or of any other person associated with the Federal Reserve System. Tessa Morrison provided superb research assistance. Return to text
2. See, among others, Brettell, Gaffen, and Rohde (2015), Hanaeur (2015), Koller (2015), Lazonick (2014), Trainer (2016), and Wang and Bost (2014). Return to text
Gruber, Joseph W., and Steven Kamin (2017). "Corporate Buybacks and Capital Investment : An International Perspective," IFDP Notes. Washington: Board of Governors of the Federal Reserve System, April 11, 2017, https://doi.org/10.17016/2573-2129.30.
Disclaimer: IFDP Notes are articles in which Board economists offer their own views and present analysis on a range of topics in economics and finance. These articles are shorter and less technically oriented than IFDP Working Papers.