IFDP Notes
May 16, 2018
The Effect of Real Estate Prices on Chinese Bank Performance
Anil K. Jain and Samuel M. Mackey
1. Introduction
Chinese banks have large exposures to the Chinese real estate market. Direct Chinese bank loans to the Chinese real estate sector (for example, loans to real estate developers, commercial mortgage loans, and residential mortgage loans) are about 22 percent of total bank lending. In addition, indirect bank loans to the real estate sector (for example, loans collateralized by real estate) are estimated to be an additional 28 percent of total bank lending. As such, weakness in the real estate market may hinder economic growth in the wider economy, and consequently reduce banks' profits through higher loan defaults, lower fee income, and lower net interest margins.
There are significant fluctuations in real estate prices over time and across regions in China (Figure 1.). Average real estate prices in tier 3 cities have gyrated over the last six years, whereas average real estate prices in tier 1 cities have skyrocketed. Between December 2010 and February 2017, prices for tier 1 cities increased 77 percent, and prices for tier 2 cities increased 30 percent. Meanwhile, prices for tier 3 cities have increased only 8 percent.
Given banks' large exposures to the real estate market, a notable decline in real estate prices could cause big losses for Chinese banks, and given the historically large fluctuations in real estate prices, a large fall in real estate prices is quite plausible.
This note examines how a major fall in real estate prices could affect banks' performances. We exploit spatial variation in banks' branch networks to estimate the effect of (relatively small) changes in real estate prices on banks' performances. We use these estimates to predict how potentially larger changes in real estate prices may affect banks' performances. Specifically, we analyze three different components of banks' performances; banks' nonperforming loan (NPL) ratios, banks' stock prices, and banks' total assets.
Our main findings are that real estate prices are strongly positively correlated with higher bank stock prices, that increases in real estate prices are positively correlated with increases in bank size, and that there is little correlation between increases in real estate prices and increases in banks' NPL ratio.
Estimating the relationship between real estate prices and banks' performances is difficult due to the multiple other factors affecting banks' performances, such as a growing economy. To overcome this problem we use two sources of variation. First, we use variation in banks' branch networks, that is, we exploit that some banks have very different regional bank branch concentrations. Second, we use variation in real estate prices in different cities over time. By using bank level variation in branch networks and real estate price fluctuations over time, we can estimate the correlation between real estate prices and bank performance. Moreover, we can include time dummies and bank dummies in our econometric specification. Including time dummies ensures we can control for an aggregate change in banks' performances over time, while including bank dummies ensures we can control for banks' different initial conditions. For instance, a bank's NPLs will likely differ according to said bank's regional focus. Figure 2 depicts the distribution of (a) Bank of Beijing's and (b) Bank of China's branch networks, with larger circles representing larger shares of a bank's branches being located in that city. While Bank of Beijing's branches are primarily located in the city of Beijing, Bank of China's branches are spread out across the Southeastern region of China. A decline in the Beijing real-estate market may therefore affect Bank of Beijing's exposures differently than it would Bank of China's exposures.
Our econometric strategy has three main limitations. First, the strategy estimates the relationship between bank performance and real estate prices using only relatively small changes in real estate prices. Therefore, to forecast the possible disruption on bank performance from a real estate crisis, we have to extrapolate, assuming a linear model, our estimates to significantly larger changes in real estate prices. Second, to estimate a bank's regional exposure, we use the fraction of a bank's total branches in that city. This fraction will likely be strongly correlated with a bank's exposure to that region's real estate market, but not perfectly so since it is measuring overall exposure to the region. Ideally, to estimate a bank's regional exposure to the real estate market, we would use the fraction of the bank's loans to the real estate sector in that region. Unfortunately, those data are not available. Finally, data on regional real estate prices are only available since January 2010. Therefore, we can estimate the relationship using only recent changes in real estate prices.
2. Methodology
There are four steps in the methodology.
First, we compute each bank's exposure to a city, $$bank exposure_{c}$$. To do so, we divide the number of a bank's branches in city c, by the total number of a bank's branches. For simplicity, we only take a bank's branch network at single point of time (March 2016).2
Second, to compute an empirical proxy for a banks overall exposure to the real estate sector, defined as $$Bank Regional Real Estate_{bt}$$, we multiply the bank's regional exposure with the logarithm (ln) of that city's real estate price index. Specifically,
$$Bank Regional Real Estate_{bt}=\sum_{c} x \ln(city real estate price index_{ct})$$
We use quarterly real estate data for the roughly largest 70 cities in China. Data are available since the first quarter of 2010.
Third, we regress a bank's performance on changes in a bank's real estate price index variable and additional controls. The regression is as follows:
$$Bank performance_{bt} = \beta _{1}Bank regional real estate price exposure_{bt} + \alpha _{t} + \alpha _{b}+\varepsilon _{bt},$$
Where $$\alpha_{t}$$ is a time fixed effect, and $$\alpha_{b}$$ is a bank fixed effect. A bank's performance is measured in three different ways; the logarithm of a bank's stock price, the logarithm of a bank's total assets, and the bank's NPL ratio. The standard errors are clustered at the bank level.
Fourth, we expand the results to consider whether changes in real estate prices affect some types of banks differently.
3. Results
Table 1: Increases in real estate prices are associated with increases in banks' stock prices.
| Bank stock price | Total assets | NPL ratio† | |
|---|---|---|---|
| Bank regional real estate exposure | 1.64** (2.9) |
0.91 (1.01) |
|
| Bank regional real estate exposure | -0.001 (0.91) |
||
| Number of banks | 15 | 20 | 20 |
Standard errors clustered at the level of the bank. T-statistics in parentheses. * p<0.10 ** p<0.05 *** p<0.01. Bank and Time (Quarter) fixed effects included. †The effect of a fall in asset prices or a reduction in a debtor's ability to pay, will likely affect a loan's repayment with a delay. Therefore, we lag our measure of bank real estate prices, when estimating the relationship between real estate prices and banks' NPLs.
The results in column 1 show that banks that were most exposed to regions with higher real estate price growth had the largest increases in their stock prices. Specifically, a 1 percent rise in a bank's real estate price index is associated with a 1.64 percent rise in a bank's stock price. The results suggest a large fall in property prices would, in turn, be associated with an even larger fall in banks' stock prices.
The effects of changes in real estate prices on banks' total assets and banks' NPLs are less clear. The results suggest that the increases in real estate prices are associated with bank growth, but not to a statistically significant extent.
The effect of increases in real estate prices on banks' future NPLs is somewhat ambiguous. The results in the final column of table 1 suggest that increases in real estate prices are associated with decreases in a bank's future NPLs. However, the result is not economically or statistically significant—a 1 percent increase in a bank's real estate price index is associated with only a one-tenth of a basis point reduction in that bank's NPL ratio and the relationship is not statistically significant. Finally, the relationship is not robust to varying the time lag between changes in real estate prices and banks future NPLs.
The lack of a strong and consistent relationship between changes in real estate prices and banks NPLs could be due to irregularities in banks' NPL designations, or because the changes in real estate prices have not been sufficiently large.
Table 2: The effect of changes in real estate prices is more pronounced for smaller, regional banks.
| Bank stock price | Total assets | NPL ratio† | |
|---|---|---|---|
| Bank regional real estate exposure | 1.076* (2.05) |
0.346 (0.45) |
-0.002* (2.24) |
| Bank regional real estate exposure X Big five dummy | -0.99*** (3.08) |
-2.04*** (4.09) |
0.003** (2.86) |
| Number of banks | 15 | 20 | 20 |
Standard errors clustered at the level of the bank. T-statistics in parentheses. * p<0.10 ** p<0.05 *** p<0.01. Bank and Time (Quarter) fixed effects included. †The results in column 3 (for the NPL ratio) use lagged dependent variables (lagged two years).
In table 2, we examine if there are significant differences in bank performance between large and small banks. The regressions include the change in the bank real estate price index variable interacted with a dummy for the largest five banks in China ("the big five"). Overall, the results are in-line with anecdotal evidence—the smaller, more regional banks are more sensitive to changes in real estate prices.
The results in column 1 clearly show that changes in real estate prices had almost no effect on the largest banks' stock prices (the effect on large banks is captured by the sum of the two coefficients, which is close to 0). Whereas, for the smaller banks, a 1 percent rise in a bank's real estate index is associated with a 1 percent rise in the bank's stock price.
The results for bank size (column 2) are less clear. The results suggest that smaller banks were more likely to grow in response to increases in real estate prices, while the largest banks were more likely to contract during periods of real estate price increases. A possible interpretation of this result is that the largest banks were more likely to grow, and expand market share, during periods when the smaller, more regional banks were more constrained.
The results for banks' NPL ratios (column 3) are similar to the results in table 1. The results suggest that increases in real estate prices are associated with lower bank NPL ratios at the smaller banks, but not for the larger banks. However, the economic size of the effect is small—a 1 percent rise in a small bank's real estate index is associated with only two-tenths of a basis point fall in the bank's future NPL ratio.
Table 3: Do banks' performances respond asymmetrically to higher or lower real estate prices?
| Bank stock price | Total assets | NPL ratio† | |
|---|---|---|---|
| Bank regional real estate exposure | 1.65** (2.94) |
0.93 (1.01) |
-0.001 (0.73) |
| Property price growth dummy | 0.033 (1.69) |
0.090* (1.96) |
-0.001*** (3.26) |
| Number of banks | 15 | 20 | 20 |
Standard errors clustered at the level of the bank. T-statistics in parentheses. * p<0.10 ** p<0.05 *** p<0.01. Bank and Time (Quarter) fixed effects included. †The results in column 3 (for the NPL ratio) use lagged independent variables (lagged two years).
In table 3, we examine whether there are asymmetric effects from increases versus decreases in real estate prices. The regressions include a dummy variable, the property price growth dummy, which is equal to 1 only if the bank's real estate index increased in that quarter. The property price growth dummy only has a significant statistical effect (at the five percent significance level) on banks' NPL ratios. Moreover, the point-estimates for the effect of positive price growth are economically small for all three specifications. Overall, the results suggest that there is little asymmetric effect on banks' performances from positive or negative property price changes.
4. Conclusion
The results provide some evidence that there is a positive relationship between real estate prices and banks' performances. The strongest relationship is between increases in banks' stock prices and increases in real estate prices. But higher real estate prices seem to be only somewhat related with faster growth of bank assets. Finally, the results suggest little overall relationship between real estate prices and banks' future NPL ratios, but the result do suggest that smaller banks NPLs would be more adversely affected by a sharp decline in real estate prices.
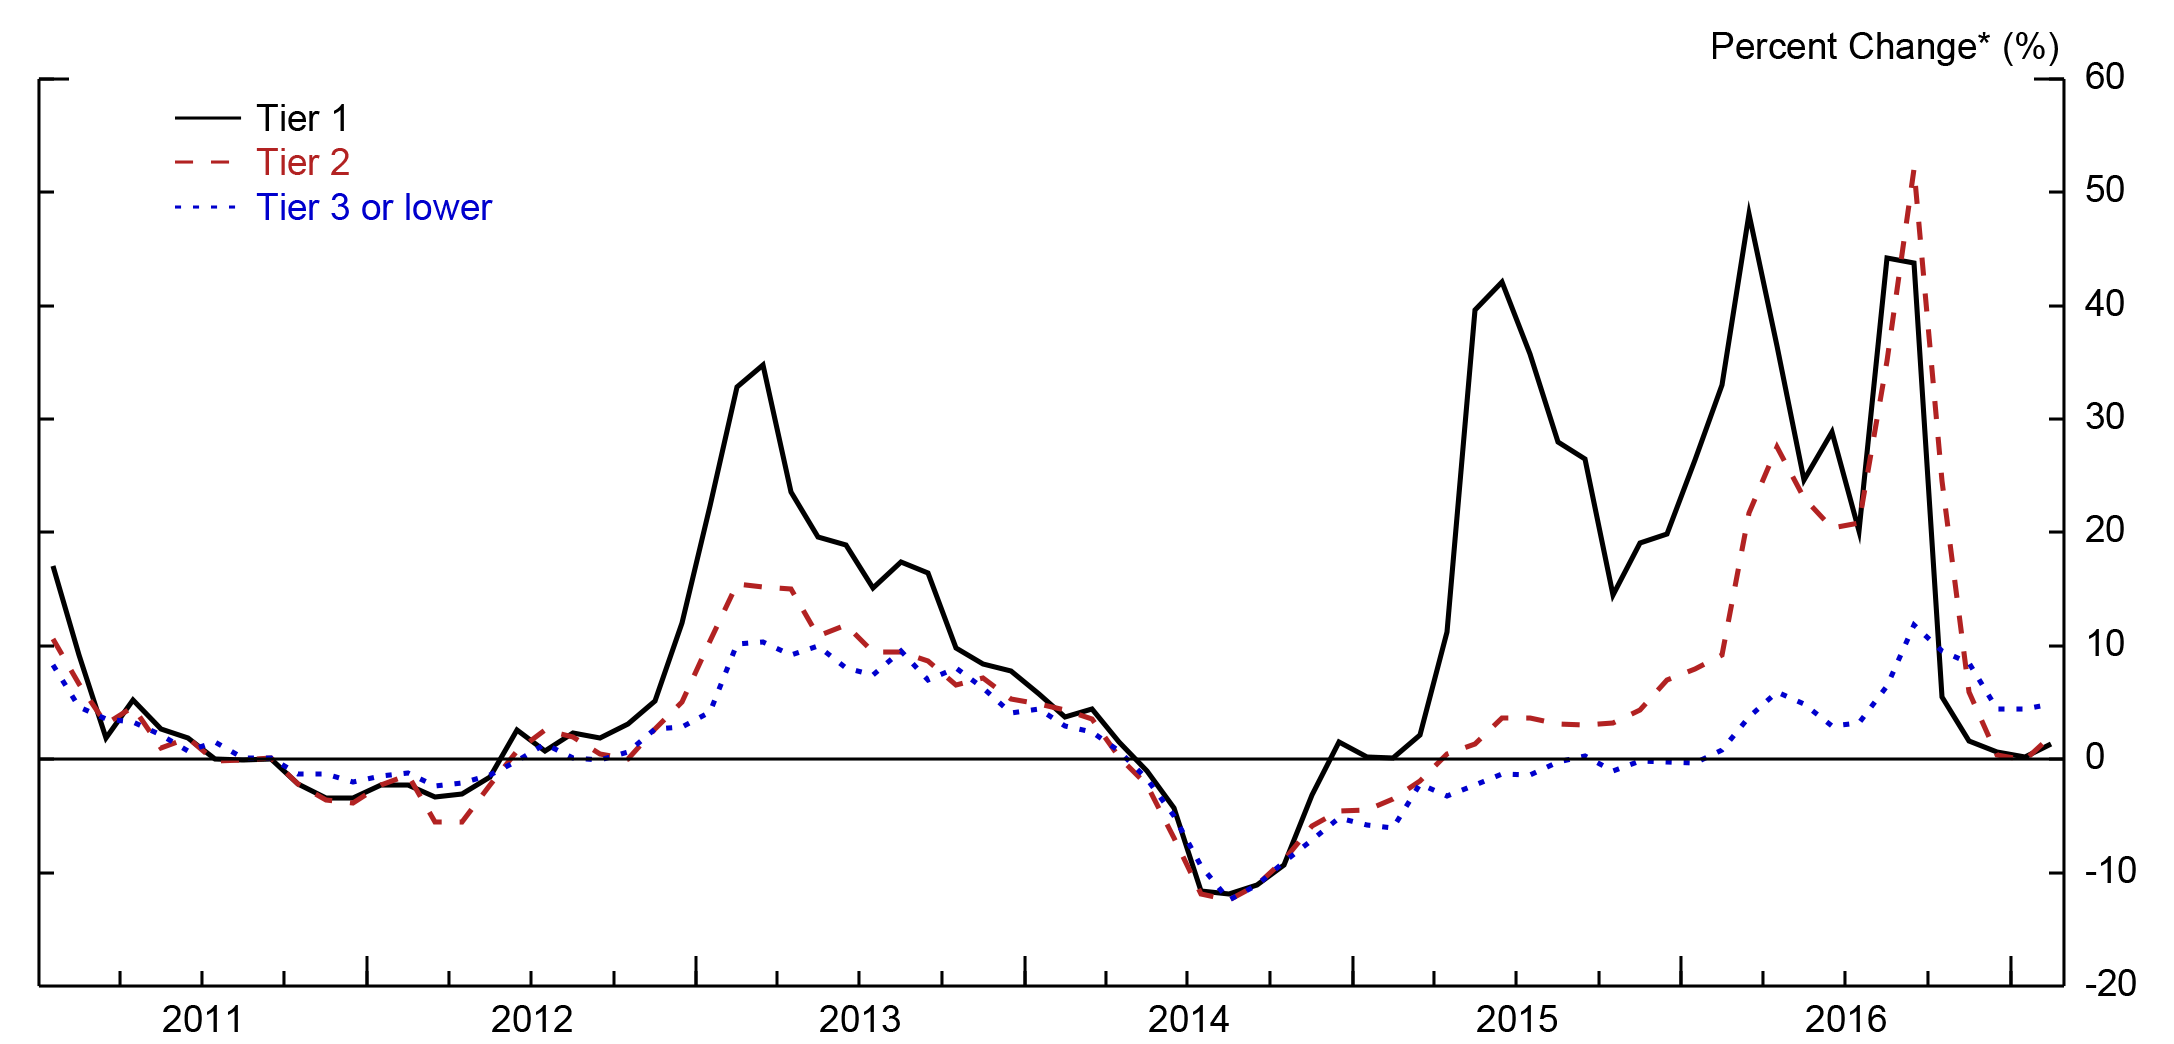
*Monthly percent changes at an annual rate.
Last data value: Feb. 2017.
Source: Haver Analytics.
Bank of Beijing
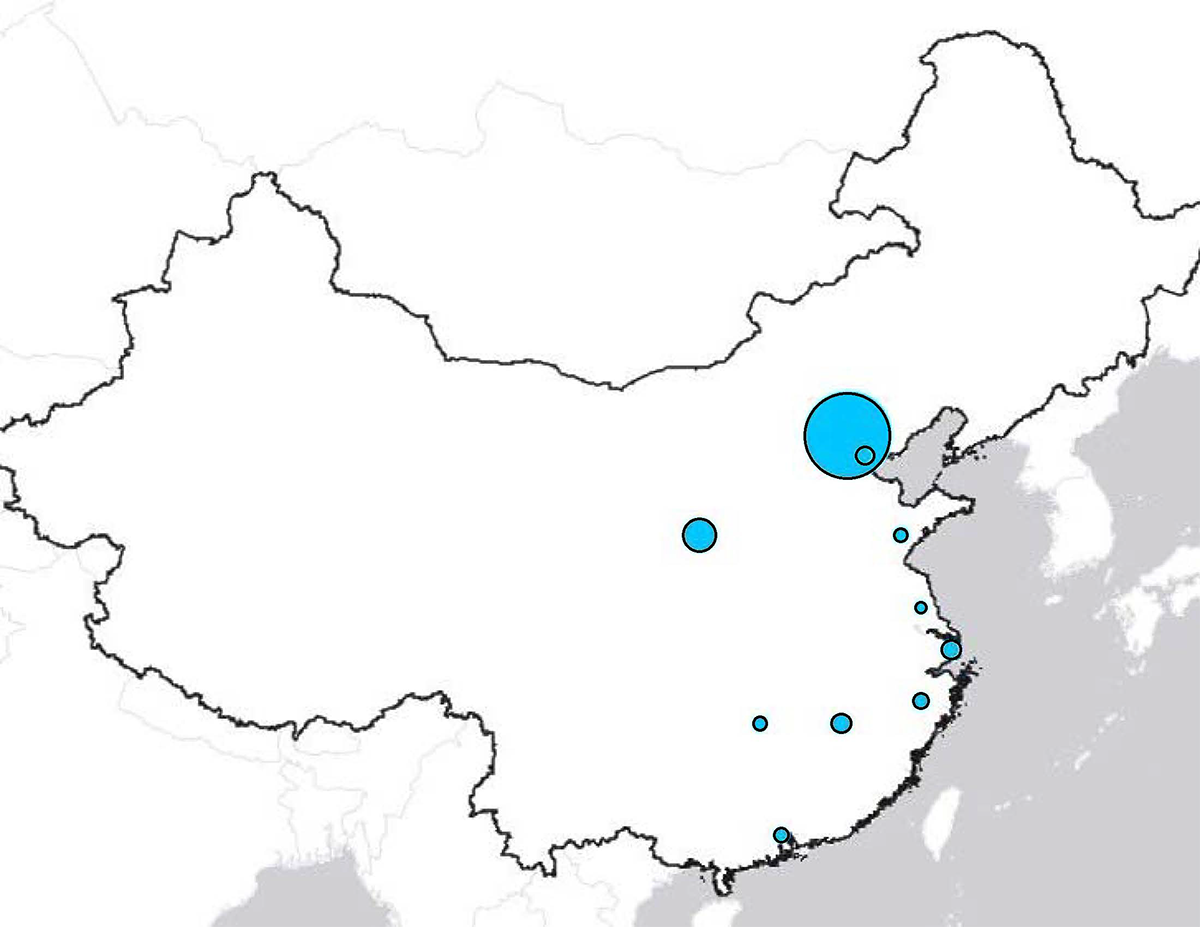
This graph shows the distribution of Bank of Beijing's branches across China, with larger circles representing a larger portion of the bank's branches being located in a given province.
Bank of China

This graph shows the distribution of Bank of China's branches across China, with larger circles representing a larger portion of the bank's branches being located in a given province.
1. Anil K. Jain is a Senior Economist, and Samuel M. Mackey is a Senior Research Assistant, with the International Finance Division, Board of Governors of the Federal Reserve System, Washington DC 20551 U.S.A. They can be reached at [email protected] and [email protected], respectively. The views expressed are solely the responsibility of the authors and should not be interpreted as reflecting the views of the Board of Governors of the Federal Reserve System or of any other person associated with the Federal Reserve System. Return to text
2. Data for all bank branches and changes in real estate prices are not available. For the purposes of our estimation, we estimate a bank's regional exposure using only the set of cities for which data are available. Return to text
Jain, Anil K. and Samuel M. Mackey (2018). "The Effect of Real Estate Prices on Chinese Bank Performance." IFDP Notes. Washington: Board of Governors of the Federal Reserve System, May 2018., https://doi.org/10.17016/2573-2129.44.
Disclaimer: IFDP Notes are articles in which Board economists offer their own views and present analysis on a range of topics in economics and finance. These articles are shorter and less technically oriented than IFDP Working Papers.