Minutes of the Federal Open Market Committee
September 25-26, 2018
In conjunction with the Federal Open Market Committee (FOMC) meeting held on September 25–26, 2018, meeting participants submitted their projections of the most likely outcomes for real gross domestic product (GDP) growth, the unemployment rate, and inflation for each year from 2018 to 2021 and over the longer run.1 Each participant's projections were based on information available at the time of the meeting, together with his or her assessment of appropriate monetary policy--including a path for the federal funds rate and its longer-run value--and assumptions about other factors likely to affect economic outcomes. The longer-run projections represent each participant's assessment of the value to which each variable would be expected to converge, over time, under appropriate monetary policy and in the absence of further shocks to the economy.2 "Appropriate monetary policy" is defined as the future path of policy that each participant deems most likely to foster outcomes for economic activity and inflation that best satisfy his or her individual interpretation of the statutory mandate to promote maximum employment and price stability.
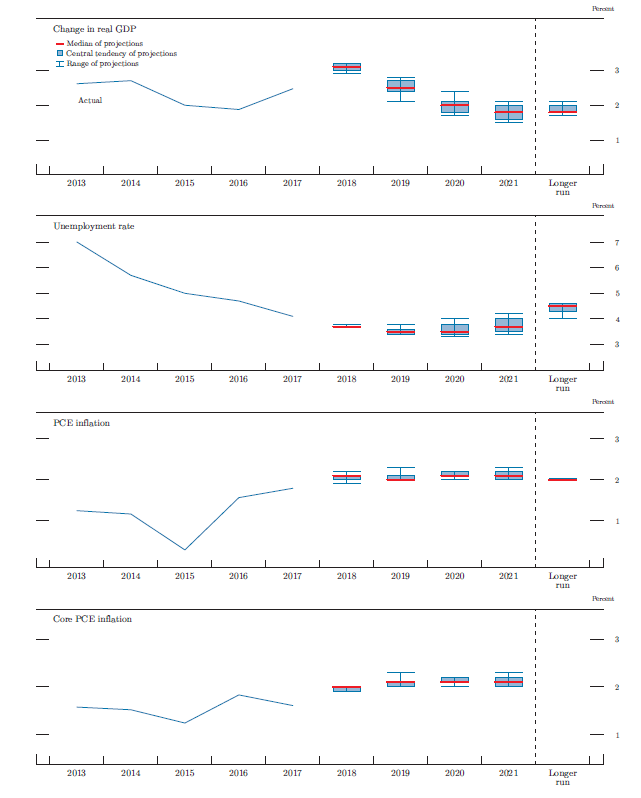
All participants who submitted longer-run projections expected that, in 2018, real GDP would expand at a pace exceeding their individual estimates of the longer-run growth rate of real GDP. All participants anticipated that real GDP growth would moderate in the coming years, and a majority of participants projected growth in 2021 to be below their estimates of the longer-run rate. All participants who submitted longer-run projections expected that the unemployment rate would run below their estimates of its longer-run level throughout the projection period. Participants generally projected that inflation, as measured by the four-quarter percentage change in the price index for personal consumption expenditures (PCE), would be at or near the Committee's 2 percent objective at the end of 2018 and would continue at close to that rate through 2021. Compared with the Summary of Economic Projections (SEP) from June, a solid majority of participants marked up their projections of real GDP growth and most increased their forecast of the unemployment rate in 2018, with participants indicating that these revisions mostly reflected incoming data. Participants' projections of inflation were largely unchanged from June. Table 1 and figure 1 provide summary statistics for the projections.
Table 1. Economic projections of Federal Reserve Board members and Federal Reserve Bank presidents, under their individual assessments of projected appropriate monetary policy, September 2018
Percent
| Variable | Median1 | Central tendency2 | Range3 | ||||||||||||
|---|---|---|---|---|---|---|---|---|---|---|---|---|---|---|---|
| 2018 | 2019 | 2020 | 2021 | Longer run | 2018 | 2019 | 2020 | 2021 | Longer run | 2018 | 2019 | 2020 | 2021 | Longer run | |
| Change in real GDP | 3.1 | 2.5 | 2.0 | 1.8 | 1.8 | 3.0 - 3.2 | 2.4 - 2.7 | 1.8 - 2.1 | 1.6 - 2.0 | 1.8 - 2.0 | 2.9 - 3.2 | 2.1 - 2.8 | 1.7 - 2.4 | 1.5 - 2.1 | 1.7 - 2.1 |
| June projection | 2.8 | 2.4 | 2.0 | n.a. | 1.8 | 2.7 - 3.0 | 2.2 - 2.6 | 1.8 - 2.0 | n.a. | 1.8 - 2.0 | 2.5 - 3.0 | 2.1 - 2.7 | 1.5 - 2.2 | n.a. | 1.7 - 2.1 |
| Unemployment rate | 3.7 | 3.5 | 3.5 | 3.7 | 4.5 | 3.7 | 3.4 - 3.6 | 3.4 - 3.8 | 3.5 - 4.0 | 4.3 - 4.6 | 3.7 - 3.8 | 3.4 - 3.8 | 3.3 - 4.0 | 3.4 - 4.2 | 4.0 - 4.6 |
| June projection | 3.6 | 3.5 | 3.5 | n.a. | 4.5 | 3.6 - 3.7 | 3.4 - 3.5 | 3.4 - 3.7 | n.a. | 4.3 - 4.6 | 3.5 - 3.8 | 3.3 - 3.8 | 3.3 - 4.0 | n.a. | 4.1 - 4.7 |
| PCE inflation | 2.1 | 2.0 | 2.1 | 2.1 | 2.0 | 2.0 - 2.1 | 2.0 - 2.1 | 2.1 - 2.2 | 2.0 - 2.2 | 2.0 | 1.9 - 2.2 | 2.0 - 2.3 | 2.0 - 2.2 | 2.0 - 2.3 | 2.0 |
| June projection | 2.1 | 2.1 | 2.1 | n.a. | 2.0 | 2.0 - 2.1 | 2.0 - 2.2 | 2.1 - 2.2 | n.a. | 2.0 | 2.0 - 2.2 | 1.9 - 2.3 | 2.0 - 2.3 | n.a. | 2.0 |
| Core PCE inflation4 | 2.0 | 2.1 | 2.1 | 2.1 | 1.9 - 2.0 | 2.0 - 2.1 | 2.1 - 2.2 | 2.0 - 2.2 | 1.9 - 2.0 | 2.0 - 2.3 | 2.0 - 2.2 | 2.0 - 2.3 | |||
| June projection | 2.0 | 2.1 | 2.1 | n.a. | 1.9 - 2.0 | 2.0 - 2.2 | 2.1 - 2.2 | n.a. | 1.9 - 2.1 | 2.0 - 2.3 | 2.0 - 2.3 | n.a. | |||
| Memo: Projected appropriate policy path | |||||||||||||||
| Federal funds rate | 2.4 | 3.1 | 3.4 | 3.4 | 3.0 | 2.1 - 2.4 | 2.9 - 3.4 | 3.1 - 3.6 | 2.9 - 3.6 | 2.8 - 3.0 | 2.1 - 2.4 | 2.1 - 3.6 | 2.1 - 3.9 | 2.1 - 4.1 | 2.5 - 3.5 |
| June projection | 2.4 | 3.1 | 3.4 | n.a. | 2.9 | 2.1 - 2.4 | 2.9 - 3.4 | 3.1 - 3.6 | n.a. | 2.8 - 3.0 | 1.9 - 2.6 | 1.9 - 3.6 | 1.9 - 4.1 | n.a. | 2.3 - 3.5 |
Note: Projections of change in real gross domestic product (GDP) and projections for both measures of inflation are percent changes from the fourth quarter of the previous year to the fourth quarter of the year indicated. PCE inflation and core PCE inflation are the percentage rates of change in, respectively, the price index for personal consumption expenditures (PCE) and the price index for PCE excluding food and energy. Projections for the unemployment rate are for the average civilian unemployment rate in the fourth quarter of the year indicated. Each participant’s projections are based on his or her assessment of appropriate monetary policy. Longer-run projections represent each participant’s assessment of the rate to which each variable would be expected to converge under appropriate monetary policy and in the absence of further shocks to the economy. The projections for the federal funds rate are the value of the midpoint of the projected appropriate target range for the federal funds rate or the projected appropriate target level for the federal funds rate at the end of the specified calendar year or over the longer run. The June projections were made in conjunction with the meeting of the Federal Open Market Committee on June 12-13, 2018. One participant did not submit longer-run projections for the change in real GDP, the unemployment rate, or the federal funds rate in conjunction with the June 12-13, 2018, meeting, and one participant did not submit such projections in conjunction with the September 25-26, 2018, meeting.
1. For each period, the median is the middle projection when the projections are arranged from lowest to highest. When the number of projections is even, the median is the average of the two middle projections. Return to table
2. The central tendency excludes the three highest and three lowest projections for each variable in each year. Return to table
3. The range for a variable in a given year includes all participants’ projections, from lowest to highest, for that variable in that year. Return to table
4. Longer-run projections for core PCE inflation are not collected. Return to table
Figure 1. Medians, central tendencies, and ranges of economic projections, 2018-21 and over the longer run*
Accessible version of figure 1 | Return to figure 1
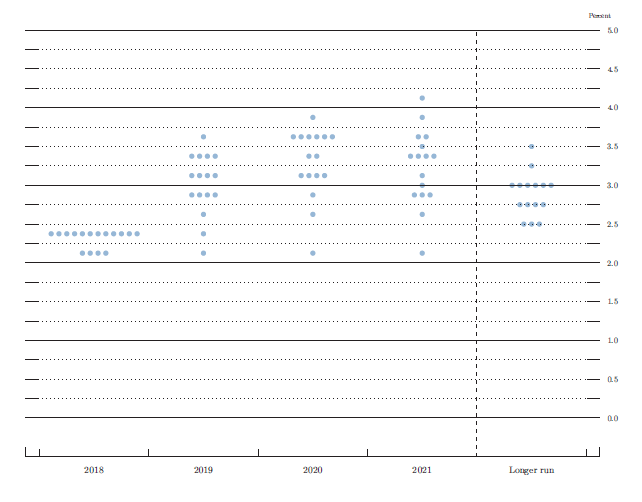
As shown in figure 2, almost all participants continued to expect that the evolution of the economy, relative to their objectives of maximum employment and 2 percent inflation, would likely warrant further gradual increases in the federal funds rate. The medians of participants' projections of the federal funds rate through 2020 were unchanged relative to their June projections, and the median of participants' projections for 2021 was the same as that for 2020. The median projection for the longer-run federal funds rate rose slightly, with several participants citing increases in model-based estimates of the longer-run real federal funds rate and strong economic data as reasons for the revision. A substantial majority of participants expected that the year-end 2020 and 2021 federal funds rate would be above their estimates of the longer-run rate.
Figure 2. FOMC participants' assessments of appropriate monetary policy: Midpoint of target range or target level for the federal funds rate*
Accessible version of figure 2 | Return to figure 2
In general, participants continued to view the uncertainty around their economic projections as broadly similar to the average of the past 20 years. Risks to their outlooks were viewed as balanced, although a couple more participants than in June saw risks to their inflation projections as weighted to the upside.
The Outlook for Economic Activity
The medians of participants' projections for the growth rate of real GDP, conditional on their individual assessments of appropriate monetary policy, were 3.1 percent for 2018, 2.5 percent for 2019, and 2.0 percent for 2020. For this SEP, participants also submitted projections for economic variables in 2021 for the first time. Participants' projections for real GDP growth in 2021 were almost all below participants' projections of growth in 2020 and, for a majority of participants, below their longer-run projections of real GDP growth. Some participants cited the waning of fiscal stimulus, less accommodative monetary policy, or anticipated appreciation of the dollar as factors contributing to their forecasts for a moderation of real GDP growth over the course of the projection period.
While most participants made slight upward revisions to their unemployment rate projections for this year, their projections in subsequent years and in the longer run were largely unchanged. A substantial majority of participants expected the unemployment rate to bottom out in 2019 or 2020 at levels below their estimates of the unemployment rate in the longer run, and then to rise a little in 2021.
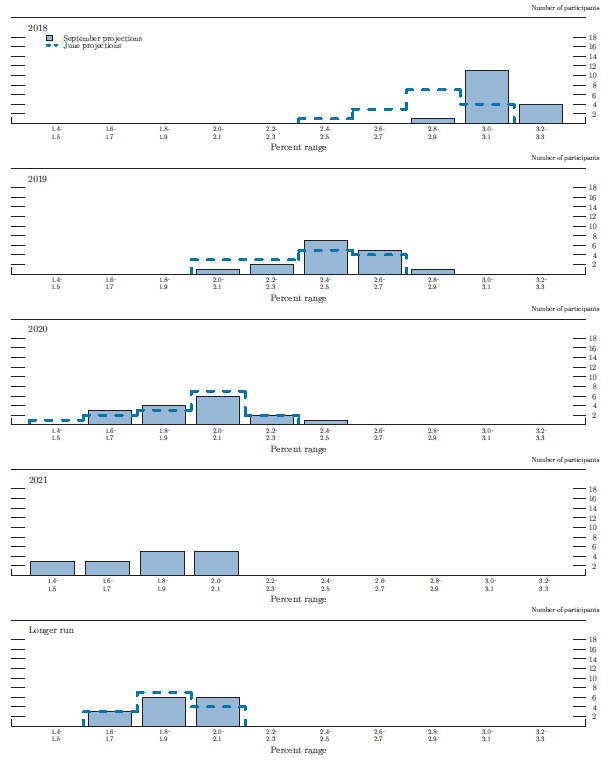
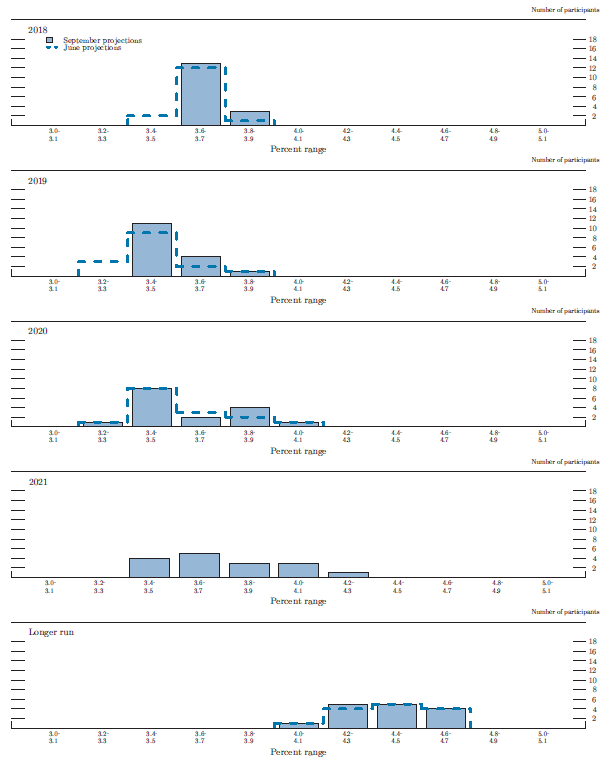
Figures 3.A and 3.B show the distributions of participants' projections for real GDP growth and the unemployment rate from 2018 to 2021 and over the longer run. The distribution of individual projections for real GDP growth for this year shifted noticeably to the right relative to that in the June SEP; the distribution for projected real GDP growth for 2019 also shifted to the right, albeit only a little. The distributions of individual projections for the unemployment rate in 2018 and 2019 shifted up a little relative to the distributions in June, while the distributions of the projections for the unemployment rate in the longer run were largely unchanged.
Figure 3.A. Distribution of participants' projections for the change in real GDP, 2018-21 and over the longer run*
Accessible version of figure 3.A | Return to figure 3.A
Figure 3.B. Distribution of participants' projections for the unemployment rate, 2018-21 and over the longer run*
Accessible version of figure 3.B | Return to figure 3.B
The Outlook for Inflation
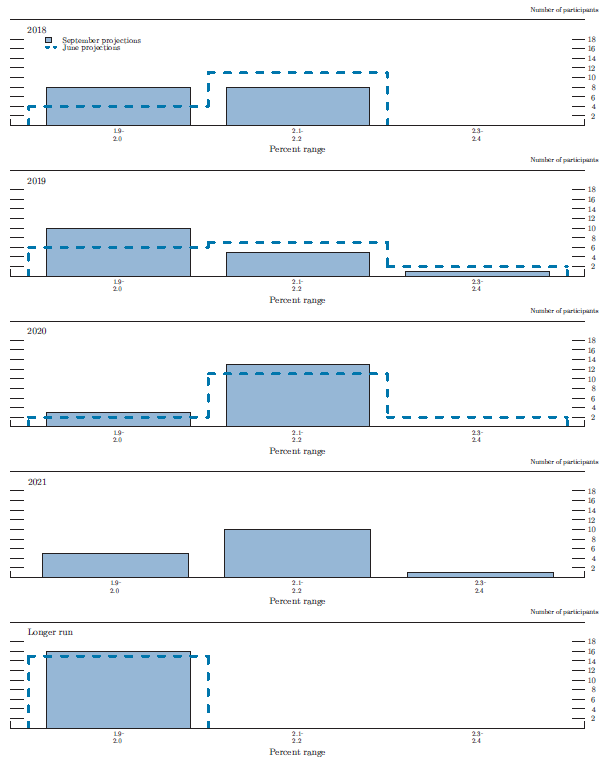
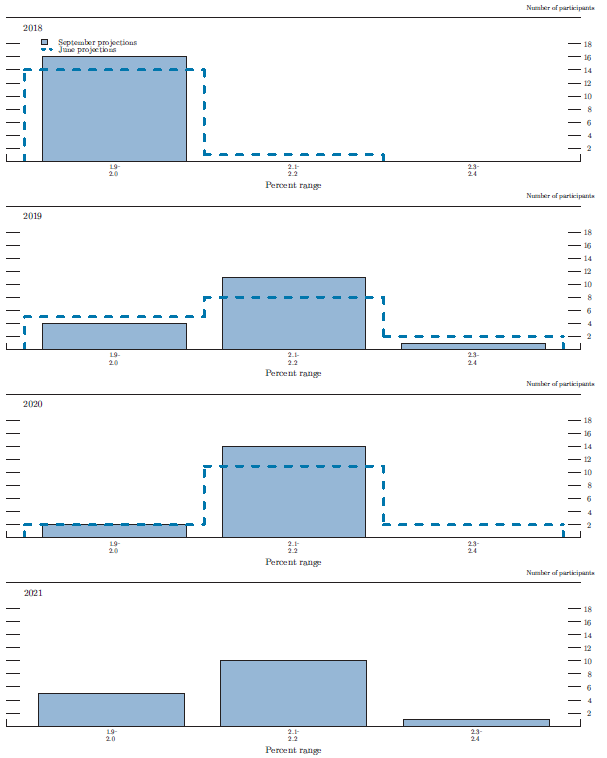
The medians of projections for total PCE price inflation were 2.1 percent in 2018, 2.0 percent in 2019, and 2.1 percent in 2020 and 2021. The medians of projections for core PCE price inflation were 2.0 percent in 2018 and 2.1 percent in 2019, 2020, and 2021. For the entire period between 2018 and 2020, these medians were very similar to the June SEP. Figures 3.C and 3.D provide information on the distributions of participants' views about the outlook for inflation. Relative to the June SEP, a number of participants revised slightly down their projections for total PCE inflation this year and next. Most participants projected total PCE price inflation in the range of 1.9 to 2.0 percent for 2018 and 2019 and 2.1 to 2.2 percent in 2020 and 2021. Most participants projected that core PCE inflation would run at 1.9 to 2.0 percent in 2018 and at 2.1 to 2.2 percent in 2019, 2020, and 2021. Relative to the June SEP, a larger number of participants projected that core PCE inflation in 2019 and 2020 would fall in the 2.1 to 2.2 percent range.
Figure 3.C. Distribution of participants' projections for PCE inflation, 2018-21 and over the longer run*
Accessible version of figure 3.C | Return to figure 3.C
Figure 3.D. Distribution of participants' projections for core PCE inflation, 2018-21*
Accessible version of figure 3.D | Return to figure 3.D
Appropriate Monetary Policy
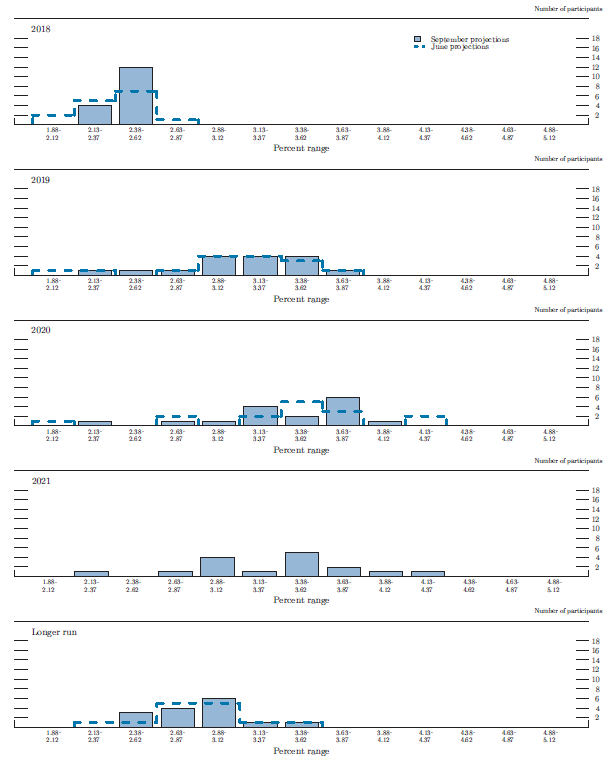
Figure 3.E shows distributions of participants' judgments regarding the appropriate target--or midpoint of the target range--for the federal funds rate for the end of each year from 2018 to 2021 and over the longer run. The distribution of projected policy rates for year-end 2018 was higher than in the June SEP, with projections clustered around 2.4 percent. The distributions of participants' views of the appropriate federal funds rate at the ends of 2019 and 2020 were relatively wide, as was the case in the June SEP.
Figure 3.E. Distribution of participants' judgments of the midpoint of the appropriate target range for the federal funds rate or the appropriate target level for the federal funds rate, 2018-21 and over the longer run*
Accessible version of figure 3.E | Return to figure 3.E
In discussing their projections, almost all participants continued to express the view that the appropriate trajectory of the federal funds rate would likely involve gradual increases. This view was predicated on several factors, including a judgment that a gradual path of policy firming would appropriately balance the risk of a buildup of inflationary pressures or other imbalances associated with high levels of resource utilization, against the risk that factors such as diminishing fiscal stimulus and adverse developments in foreign economies could become a significant drag on real GDP growth. As always, the appropriate path of the federal funds rate would depend on incoming economic data and their implications for participants' economic outlooks and assessments of risks.
Uncertainty and Risks
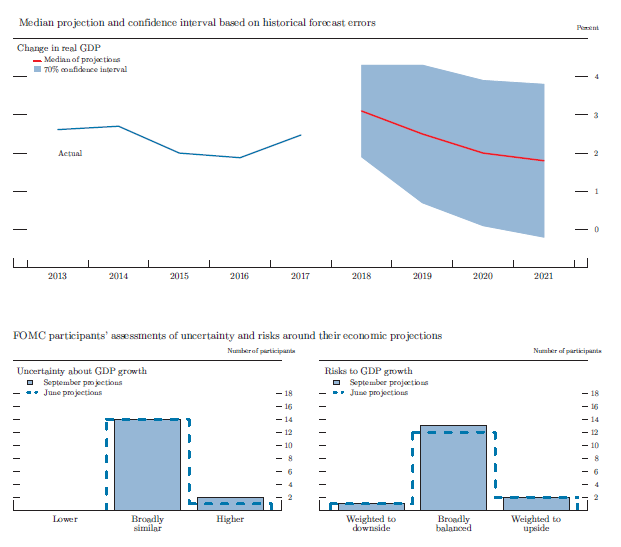
In assessing the appropriate path of the federal funds rate, FOMC participants take account of the range of possible economic outcomes, the likelihood of those outcomes, and the potential benefits and costs should they occur. As a reference, table 2 provides measures of forecast uncertainty, based on the forecast errors of various private and government forecasts over the past 20 years, for real GDP growth, the unemployment rate, and total PCE price inflation. Those measures are represented graphically in the "fan charts" shown in the top panels of figures 4.A, 4.B, and 4.C. The fan charts display the median SEP projections for the three variables surrounded by symmetric confidence intervals derived from the forecast errors reported in table 2. If the degree of uncertainty attending these projections is similar to the typical magnitude of past forecast errors and the risks around the projections are broadly balanced, then future outcomes of these variables would have about a 70 percent probability of being within these confidence intervals. For all three variables, this measure of uncertainty is substantial and generally increases as the forecast horizon lengthens.
Table 2. Average historical projection error ranges
Percentage points
| Variable | 2018 | 2019 | 2020 | 2021 |
|---|---|---|---|---|
| Change in real GDP1 | ±1.2 | ±1.8 | ±1.9 | ±2.0 |
| Unemployment rate1 | ±0.3 | ±1.1 | ±1.6 | ±2.0 |
| Total consumer prices2 | ±0.8 | ±1.0 | ±1.1 | ±1.1 |
| Short-term interest rates3 | ±0.5 | ±1.7 | ±2.3 | ±2.7 |
Note: Error ranges shown are measured as plus or minus the root mean squared error of projections for 1998 through 2017 that were released in the spring by various private and government forecasters. As described in the box “Forecast Uncertainty,” under certain assumptions, there is about a 70 percent probability that actual outcomes for real GDP, unemploy-ment, consumer prices, and the federal funds rate will be in ranges im-plied by the average size of projection errors made in the past. For more information, see David Reifschneider and Peter Tulip (2017), "Gauging the Uncertainty of the Economic Outlook Using Historical Forecasting Errors: The Federal Reserve's Approach (PDF)," Finance and Economics Dis-cussion Series 2017-020 (Washington: Board of Governors of the Feder-al Reserve System, February),
1. Definitions of variables are in the general note to table 1. Return to table
2. Measure is the overall consumer price index, the price measure that has been most widely used in government and private economic forecasts. Projection is percent change, fourth quarter of the previous year to the fourth quarter of the year indicated. Return to table
3. For Federal Reserve staff forecasts, measure is the federal funds rate. For other forecasts, measure is the rate on 3-month Treasury bills. Historical projections are the average level, in percent, in the fourth quarter of the year indicated. Return to table
Participants' assessments of the level of uncertainty surrounding their individual economic projections are shown in the bottom-left panels of figures 4.A, 4.B, and 4.C. Nearly all participants viewed the degree of uncertainty attached to their economic projections for real GDP growth and inflation as broadly similar to the average of the past 20 years.3 A couple more participants than in June viewed the uncertainty around the unemployment rate as higher than average.*
Figure 4.A. Uncertainty and risks in projections of GDP growth*
Accessible version of figure 4.A | Return to figure 4.A
Figure 4.B. Uncertainty and risks in projections of the unemployment rate*
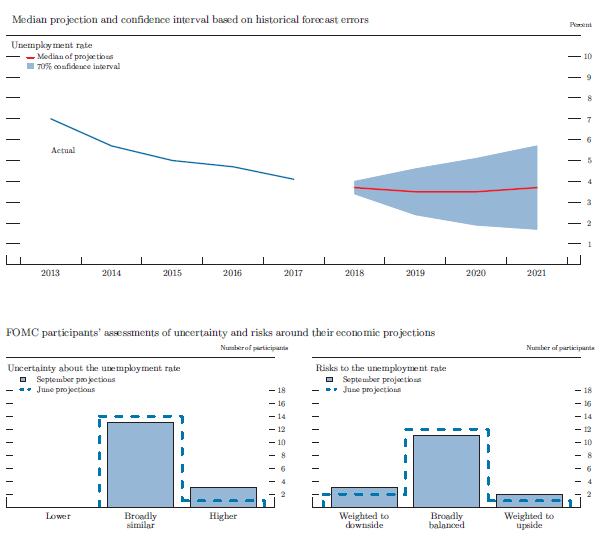
Accessible version of figure 4.B | Return to figure 4.B
Figure 4.C. Uncertainty and risks in projections of PCE inflation*
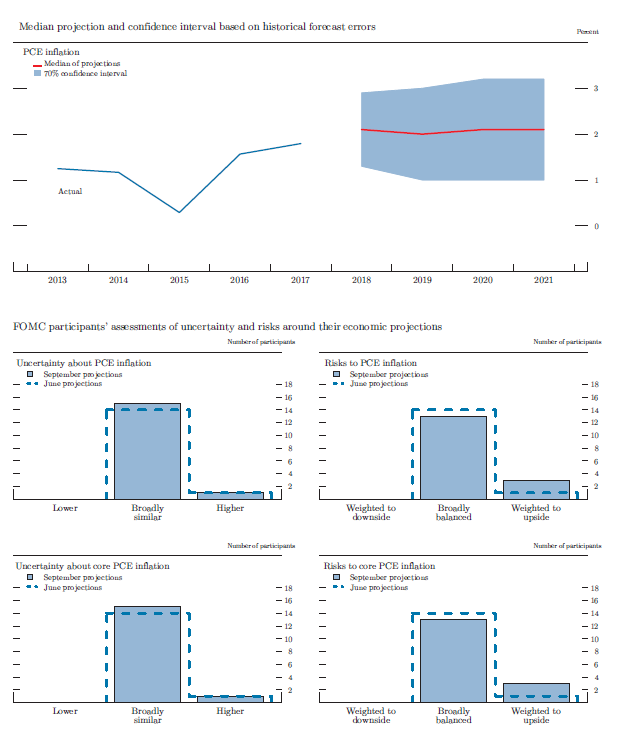
Accessible version of figure 4.C | Return to figure 4.C
Because the fan charts are constructed to be symmetric around the median projections, they do not reflect any asymmetries in the balance of risks that participants may see in their economic projections. Participants' assessments of the balance of risks to their economic projections are shown in the bottom-right panels of figures 4.A, 4.B, and 4.C. Most participants assessed the risks to their projections of real GDP growth and the unemployment rate as broadly balanced--in other words, as broadly consistent with a symmetric fan chart.
Those participants who did not judge the risks to their real GDP growth and unemployment rate projections as balanced were roughly evenly split between those who viewed the risks as being weighted to the upside and those who viewed the risks as being weighted to the downside. Risks around both total and core inflation projections were judged to be broadly balanced by a solid majority of participants; however, those participants who saw the risks as uneven saw them as weighted to the upside.
In discussing the uncertainty and risks surrounding their economic projections, many participants pointed to upside risks to real GDP growth from fiscal stimulus or stronger-than-expected effects of business optimism. Many participants also pointed to downside risks for the economy and inflation stemming from factors such as trade policy, stresses in emerging market economies, or stronger-than-anticipated appreciation of the dollar.
Participants' assessments of the appropriate future path of the federal funds rate were also subject to considerable uncertainty. Because the Committee adjusts the federal funds rate in response to actual and prospective developments over time in real GDP growth, the unemployment rate, and inflation, uncertainty surrounding the projected path for the federal funds rate importantly reflects the uncertainties about the paths for those key economic variables along with other factors. Figure 5 provides a graphical representation of this uncertainty, plotting the median SEP projection for the federal funds rate surrounded by confidence intervals derived from the results presented in table 2. As with the macroeconomic variables, the forecast uncertainty surrounding the appropriate path of the federal funds rate is substantial and increases for longer horizons.
Figure 5. Uncertainty in projections of the federal funds rate*
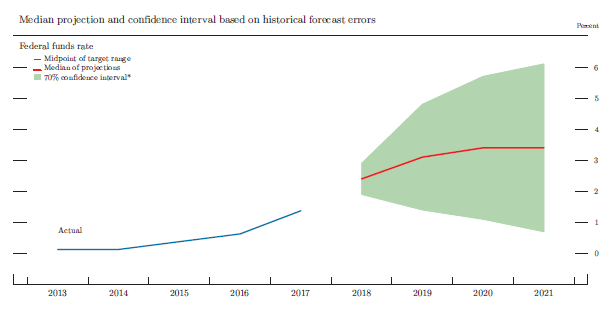
*Note: The blue and red lines are based on actual values and median projected values, respectively, of the Committee's target for the federal funds rate at the end of the year indicated. The actual values are the midpoint of the target range; the median projected values are based on either the midpoint of the target range or the target level. The confidence interval around the median projected values is based on root mean squared errors of various private and government forecasts made over the previous 20 years. The confidence interval is not strictly consistent with the projections for the federal funds rate, primarily because these projections are not forecasts of the likeliest outcomes for the federal funds rate, but rather projections of participants' individual assessments of appropriate monetary policy. Still, historical forecast errors provide a broad sense of the uncertainty around the future path of the federal funds rate generated by the uncertainty about the macroeconomic variables as well as additional adjustments to monetary policy that may be appropriate to offset the effects of shocks to the economy.
The confidence interval is assumed to be symmetric except when it is truncated at zero--the bottom of the lowest target range for the federal funds rate that has been adopted in the past by the Committee. This truncation would not be intended to indicate the likelihood of the use of negative interest rates to provide additional monetary policy accommodation if doing so was judged appropriate. In such situations, the Committee could also employ other tools, including forward guidance and large-scale asset purchases, to provide additional accommodation. Because current conditions may differ from those that prevailed, on average, over the previous 20 years, the width and shape of the confidence interval estimated on the basis of the historical forecast errors may not reflect FOMC participants’ current assessments of the uncertainty and risks around their projections.
* The confidence interval is derived from forecasts of the average level of short-term interest rates in the fourth quarter of the year indicated; more information about these data is available in table 2. The shaded area encompasses less than a 70 percent confidence interval if the confidence interval has been truncated at zero.
Accessible version of figure 5 | Return to figure 5
The economic projections provided by the members of the Board of Governors and the presidents of the Federal Reserve Banks inform discussions of monetary policy among policymakers and can aid public understanding of the basis for policy actions. Considerable uncertainty attends these projections, however. The economic and statistical models and relationships used to help produce economic forecasts are necessarily imperfect descriptions of the real world, and the future path of the economy can be affected by myriad unforeseen developments and events. Thus, in setting the stance of monetary policy, participants consider not only what appears to be the most likely economic outcome as embodied in their projections, but also the range of alternative possibilities, the likelihood of their occurring, and the potential costs to the economy should they occur.
Table 2 summarizes the average historical accuracy of a range of forecasts, including those reported in past Monetary Policy Reports and those prepared by the Federal Reserve Board's staff in advance of meetings of the Federal Open Market Committee (FOMC). The projection error ranges shown in the table illustrate the considerable uncertainty associated with economic forecasts. For example, suppose a participant projects that real gross domestic product (GDP) and total consumer prices will rise steadily at annual rates of, respectively, 3 percent and 2 percent. If the uncertainty attending those projections is similar to that experienced in the past and the risks around the projections are broadly balanced, the numbers reported in table 2 would imply a probability of about 70 percent that actual GDP would expand within a range of 1.8 to 4.2 percent in the current year, 1.2 to 4.8 percent in the second year, 1.1 to 4.9 percent in the third year, and 1.0 to 5.0 percent in the fourth year. The corresponding 70 percent confidence intervals for overall inflation would be 1.2 to 2.8 percent in the current year, 1.0 to 3.0 percent in the second year, and 0.9 to 3.1 percent in the third and fourth years. Figures 4.A through 4.C illustrate these confidence bounds in "fan charts" that are symmetric and centered on the medians of FOMC participants' projections for GDP growth, the unemployment rate, and inflation. However, in some instances, the risks around the projections may not be symmetric. In particular, the unemployment rate cannot be negative; furthermore, the risks around a particular projection might be tilted to either the upside or the downside, in which case the corresponding fan chart would be asymmetrically positioned around the median projection.
Because current conditions may differ from those that prevailed, on average, over history, participants provide judgments as to whether the uncertainty attached to their projections of each economic variable is greater than, smaller than, or broadly similar to typical levels of forecast uncertainty seen in the past 20 years, as presented in table 2 and reflected in the widths of the confidence intervals shown in the top panels of figures 4.A through 4.C. Participants' current assessments of the uncertainty surrounding their projections are summarized in the bottom-left panels of those figures. Participants also provide judgments as to whether the risks to their projections are weighted to the upside, are weighted to the downside, or are broadly balanced. That is, while the symmetric historical fan charts shown in the top panels of figures 4.A through 4.C imply that the risks to participants' projections are balanced, participants may judge that there is a greater risk that a given variable will be above rather than below their projections. These judgments are summarized in the lower-right panels of figures 4.A through 4.C.
As with real activity and inflation, the outlook for the future path of the federal funds rate is subject to considerable uncertainty. This uncertainty arises primarily because each participant's assessment of the appropriate stance of monetary policy depends importantly on the evolution of real activity and inflation over time. If economic conditions evolve in an unexpected manner, then assessments of the appropriate setting of the federal funds rate would change from that point forward. The final line in table 2 shows the error ranges for forecasts of short-term interest rates. They suggest that the historical confidence intervals associated with projections of the federal funds rate are quite wide. It should be noted, however, that these confidence intervals are not strictly consistent with the projections for the federal funds rate, as these projections are not forecasts of the most likely quarterly outcomes but rather are projections of participants' individual assessments of appropriate monetary policy and are on an end-of-year basis. However, the forecast errors should provide a sense of the uncertainty around the future path of the federal funds rate generated by the uncertainty about the macroeconomic variables as well as additional adjustments to monetary policy that would be appropriate to offset the effects of shocks to the economy.
If at some point in the future the confidence interval around the federal funds rate were to extend below zero, it would be truncated at zero for purposes of the fan chart shown in figure 5; zero is the bottom of the lowest target range for the federal funds rate that has been adopted by the Committee in the past. This approach to the construction of the federal funds rate fan chart would be merely a convention; it would not have any implications for possible future policy decisions regarding the use of negative interest rates to provide additional monetary policy accommodation if doing so were appropriate. In such situations, the Committee could also employ other tools, including forward guidance and asset purchases, to provide additional accommodation.
While figures 4.A through 4.C provide information on the uncertainty around the economic projections, figure 1 provides information on the range of views across FOMC participants. A comparison of figure 1 with figures 4.A through 4.C shows that the dispersion of the projections across participants is much smaller than the average forecast errors over the past 20 years.
1. Four members of the Board of Governors, one more than in June 2018, were in office at the time of the September 2018 meeting and submitted economic projections. The office of the president of the Federal Reserve Bank of San Francisco was vacant at the time of this FOMC meeting; First Vice President Mark A. Gould submitted economic projections. Return to text
2. One participant did not submit longer-run projections for real GDP growth, the unemployment rate, or the federal funds rate. Return to text
3. At the end of this summary, the box "Forecast Uncertainty" discusses the sources and interpretation of uncertainty surrounding the economic forecasts and explains the approach used to assess the uncertainty and risks attending the participants' projections. Return to text
* The HTML version of the September Summary of Economic Projections inadvertently included a paragraph from the June Summary of Economic Projections. That paragraph has been removed. Return to text