Economic projections are collected from each member of the Board of Governors and each Federal Reserve Bank president four times a year, in connection with the Federal Open Market Committee's (FOMC's) meetings in March, June, September, and December. The charts and tables associated with those projections are released shortly following the end of an FOMC meeting.
Below are descriptions of the figures and tables included in the SEP. Click on the figure or table images to expand them.
To view the most recent Summary of Economic Projections, please see the FOMC's meeting calendars and information page.
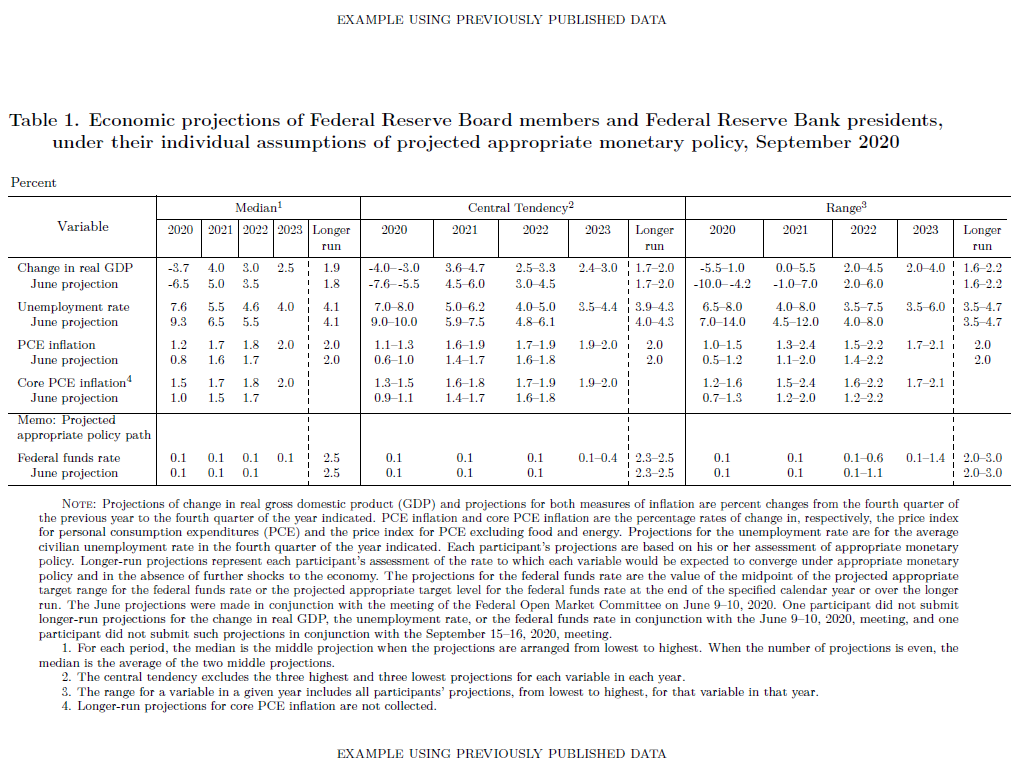
Projections of change in real gross domestic product (GDP) and projections for both measures of inflation are percent changes from the fourth quarter of the previous year to the fourth quarter of the year indicated. PCE inflation and core PCE inflation are the percentage rates of change in, respectively, the price index for personal consumption expenditures (PCE) and the price index for PCE excluding food and energy. Projections for the unemployment rate are for the average civilian unemployment rate in the fourth quarter of the year indicated. Each participant’s projections are based on his or her assessment of appropriate monetary policy. Longer-run projections represent each participant's assessment of the rate to which each variable would be expected to converge under appropriate monetary policy and in the absence of further shocks to the economy. The projections for the federal funds rate are the value of the midpoint of the projected appropriate target range for the federal funds rate or the projected appropriate target level for the federal funds rate at the end of the specified calendar year or over the longer-run.
 Click to enlarge
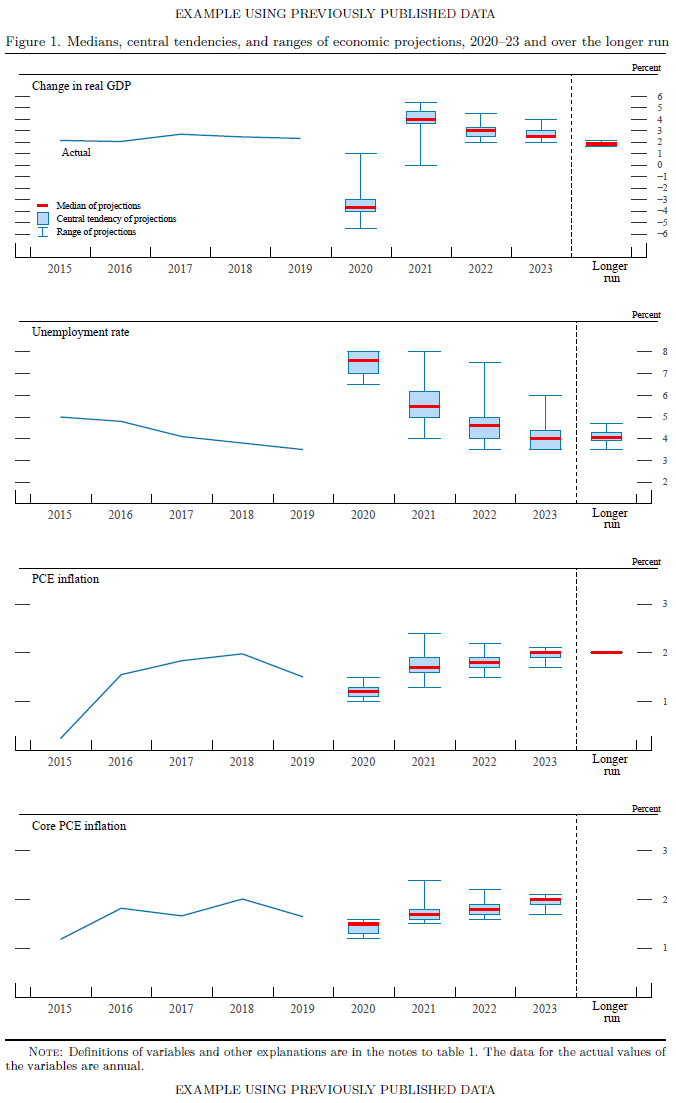
Figure 1 shows actual values and projections for four economic variables, based on FOMC participants' individual assessments of appropriate monetary policy:
- Change in Real Gross Domestic Product (GDP)—as measured from the fourth quarter of the previous year to the fourth quarter of the year indicated.
- Unemployment Rate—the average civilian unemployment rate in the fourth quarter of each year.
- PCE Inflation—as measured by the change in the personal consumption expenditures (PCE) price index from the fourth quarter of the previous year to the fourth quarter of the year indicated.
- Core PCE Inflation—as measured by the change in the PCE price index less food and energy from the fourth quarter of the previous year to the fourth quarter of the year indicated.
Actual data for these variables is shown for the previous five years. Projections are shown for the current year, subsequent three years, and the longer-run.
The solid blue line, labeled "Actual," shows the historical values for each variable.
The solid red lines depict the median projection in each period for each variable. The median value in each period is the middle value when the projections are arranged from lowest to highest. When the number of projections is even, the median is the average of the two middle projections.
The range and central tendency for each variable in each projection period are depicted in "box and whiskers" format. The blue connected horizontal and vertical lines ("whiskers") represent the range of the projections of policymakers. The bottom of the range for each variable is the lowest of all of the projections for that year or period. Likewise, the top of the range is the highest of all of the projections for that year or period. The light blue shaded boxes represent the central tendency, which is a narrower version of the range that excludes the three highest and three lowest projections for each variable in each year or period.
The longer-run projections, which are shown on the far right side of the charts, are the rates of GDP growth, unemployment, and inflation to which a policymaker expects the economy to converge over time—maybe in five or six years—in the absence of further shocks and under appropriate monetary policy. Because appropriate monetary policy, by definition, is aimed at achieving the Federal Reserve's dual mandate of maximum employment and price stability in the longer run, policymakers' longer-run projections for economic growth and unemployment may be interpreted, respectively, as estimates of the economy’s normal or trend rate of growth and its normal unemployment rate over the longer run. The longer-run projection shown for inflation is the rate of inflation judged to be most consistent with the Federal Reserve’s dual mandate.
 Click to enlarge
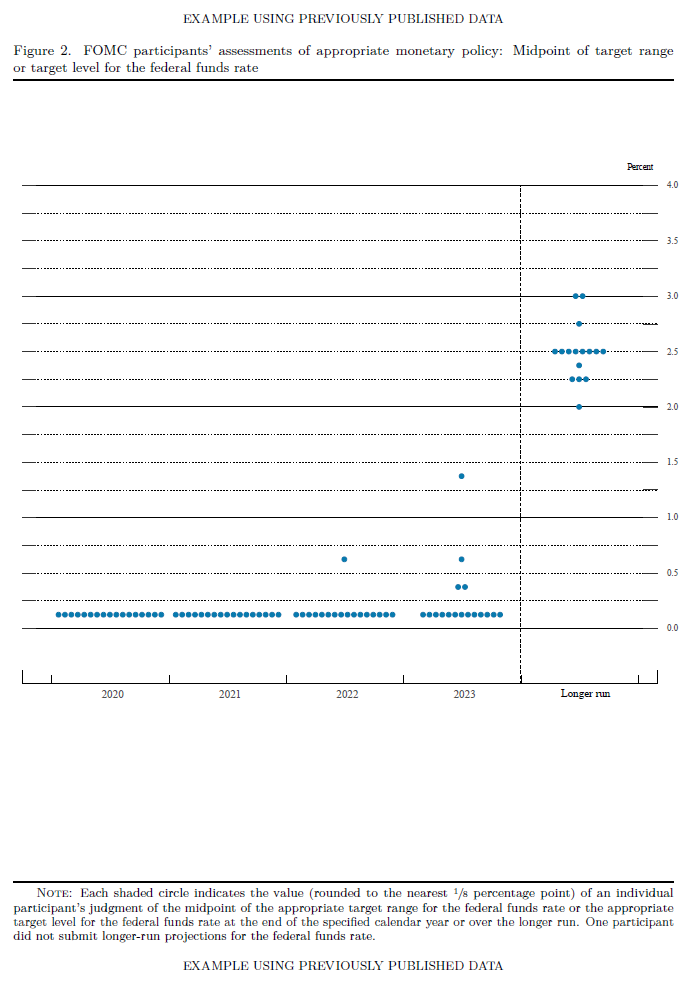
Figure 2 shows policymakers' assessments of appropriate monetary policy, which, by definition, is the future path of policy that each participant deems most likely to foster outcomes for economic activity and inflation that best satisfy his or her interpretation of the Federal Reserve’s dual objectives of maximum employment and stable prices.
Each shaded circle indicates the value (rounded to the nearest 1/8 percentage point) of an individual participant's judgment of the midpoint of the appropriate target range for the federal funds rate or the appropriate target level for the federal funds rate at the end of the specified calendar year or over the longer-run.
 Click to enlarge
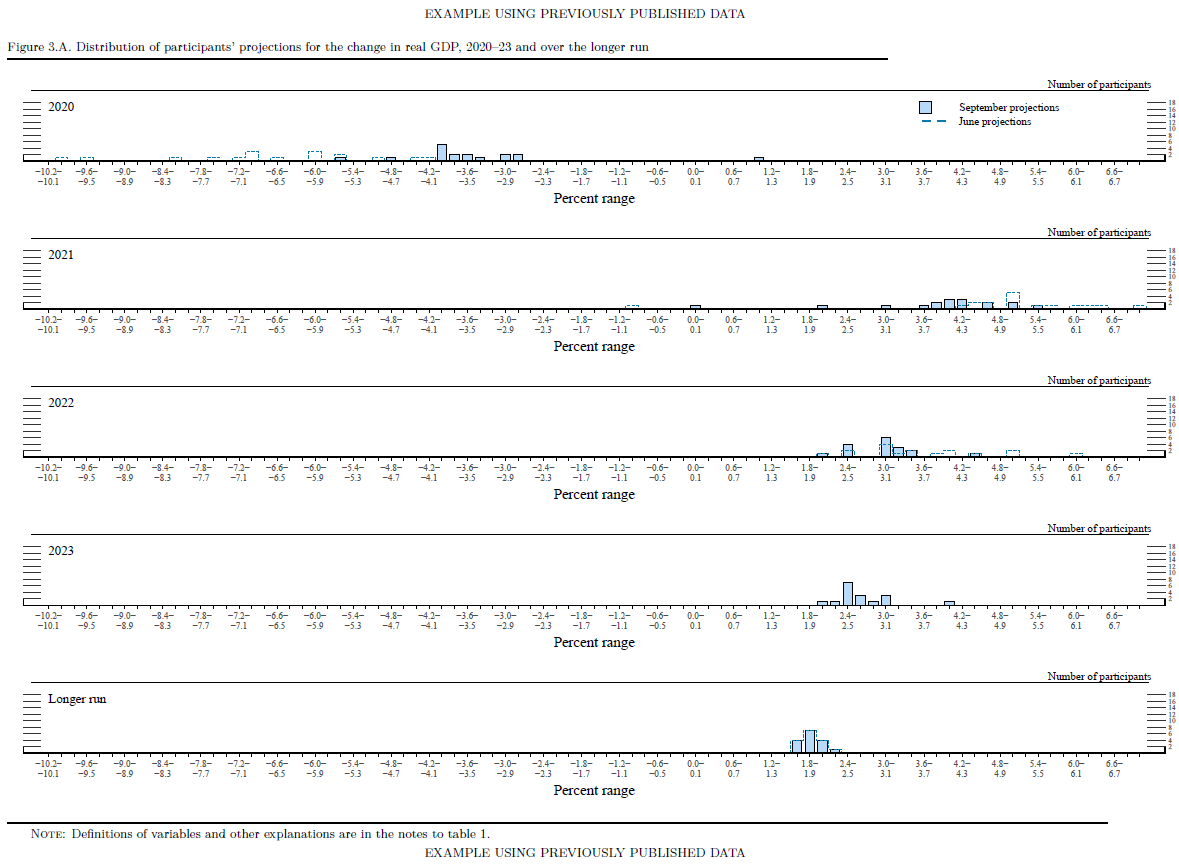
Figure 3.A shows the distributions of participants' projections for real GDP growth.
The shaded boxes show the number of participants with projections in a particular range. The dashed line shows the distribution of projections from the most recent meeting when projections were submitted. Each panel in the figure shows a different year, and the bottom panel shows projections over the "longer-run."
 Click to enlarge
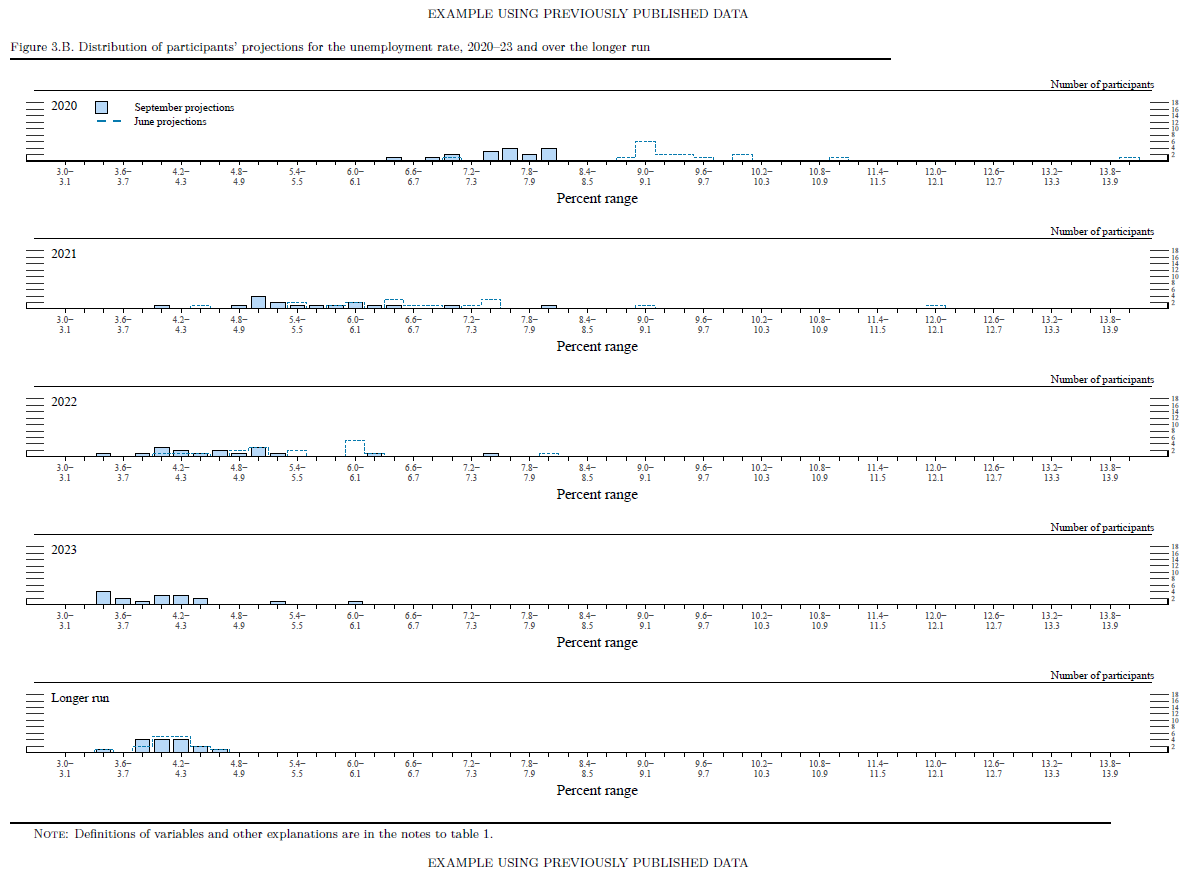
Figure 3.B shows the distributions of participants' projections for the unemployment rate.
The shaded boxes show the number of participants with projections in a particular range. The dashed line shows the distribution of projections from the most recent meeting when projections were submitted. Each panel in the figure shows a different year, and the bottom panel shows projections over the "longer-run."
 Click to enlarge
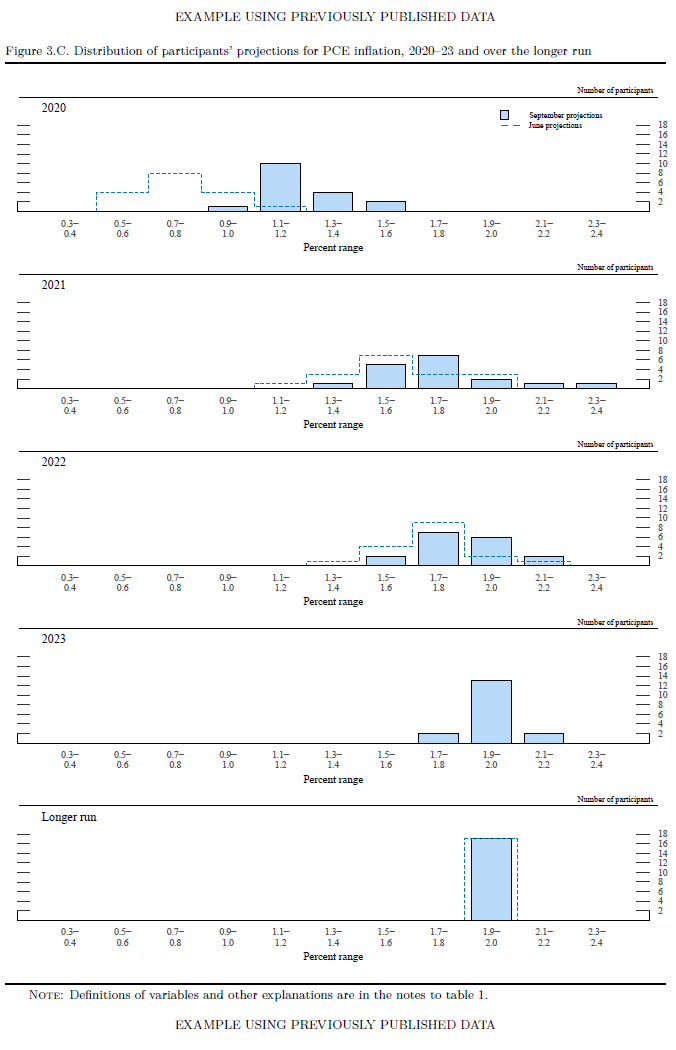
Figure 3.C shows the distribution of participants' projections for PCE inflation.
The shaded boxes show the number of participants with projections in a particular range. The dashed line shows the distribution of projections from the most recent meeting when projections were submitted. Each panel in the figure shows a different year, and the bottom panel shows projections over the "longer-run."
 Click to enlarge
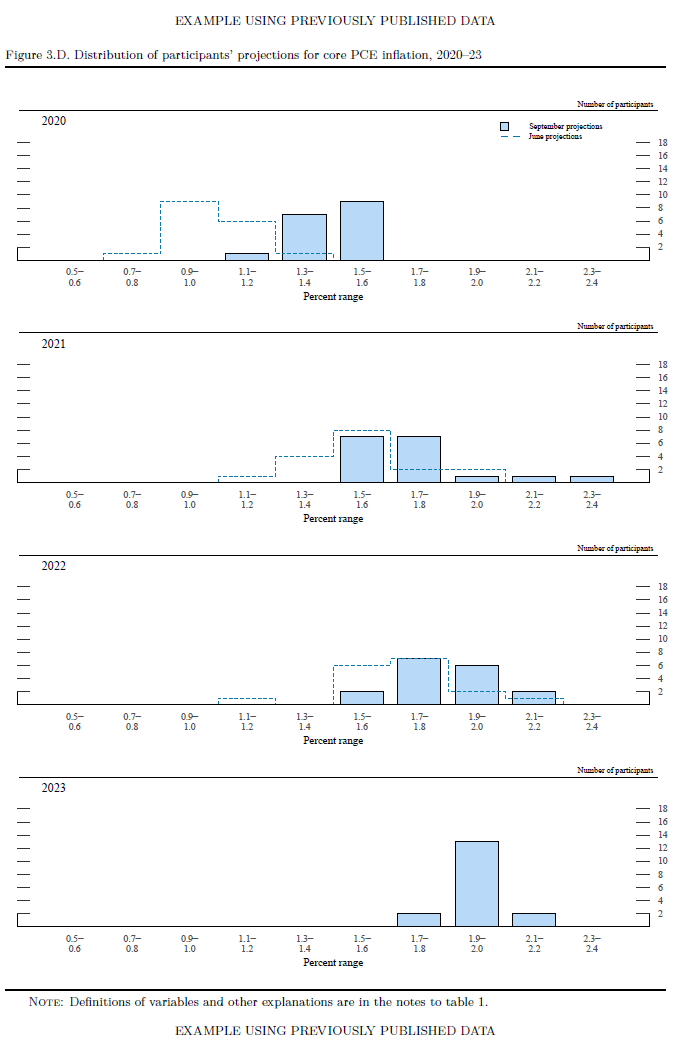
Figure 3.D shows the distribution of participants' projections for core PCE inflation.
The shaded boxes show the number of participants with projections in a particular range. The dashed line shows the distribution of projections from the most recent meeting when projections were submitted. Each panel in the figure shows a different year, and the bottom panel shows projections over the "longer-run."
 Click to enlarge
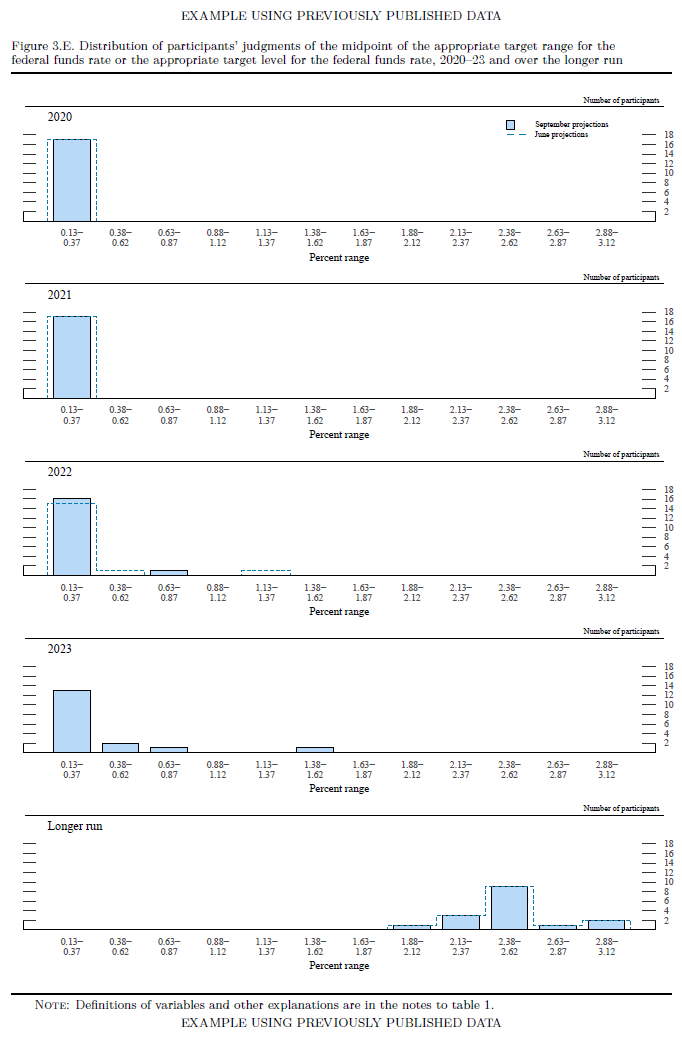
Figure 3.E shows the distributions of participants' judgments regarding the appropriate target—or midpoint of the target range—for the federal funds rate.
The shaded boxes show the number of participants with projections in a particular range. The dashed line shows the distribution of projections from the most recent meeting when projections were submitted. Each panel in the figure shows a different year, and the bottom panel shows projections over the "longer-run."
 Click to enlarge
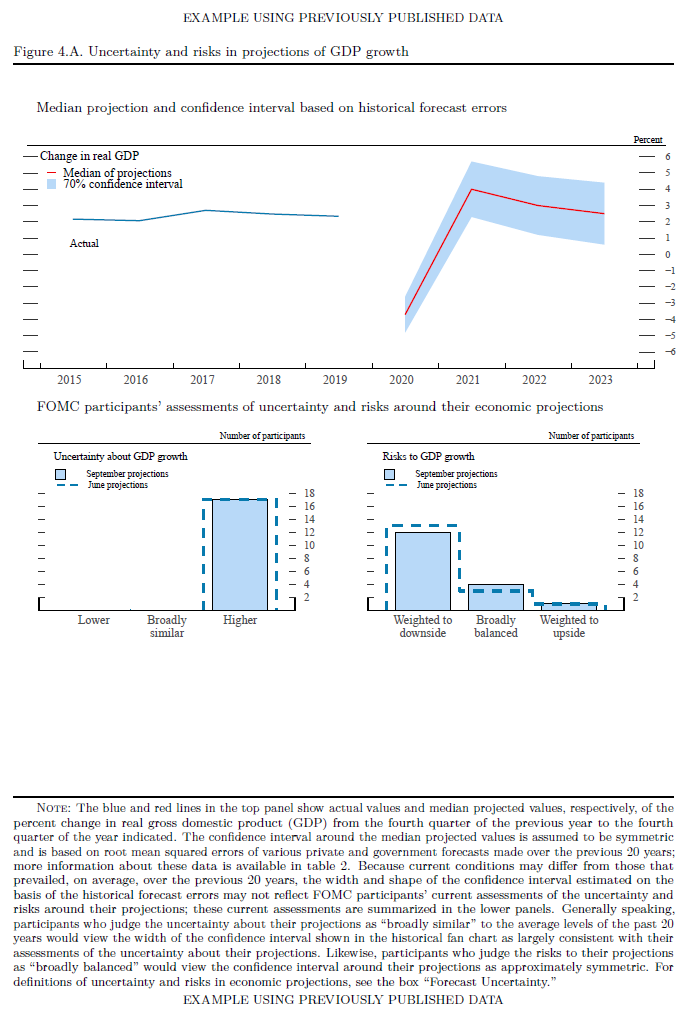
In assessing the appropriate path of the federal funds rate, FOMC participants take account of the range of possible economic outcomes, the likelihood of those outcomes, and the potential benefits and costs should they occur. Those measures are represented graphically in the "fan chart" shown in the top panel.
Participants' assessments of the level of uncertainty surrounding their individual economic projections are shown in the bottom-left panel.
Participants' assessments of the balance of risks to their current economic projections are shown in the bottom-right panel.
 Click to enlarge
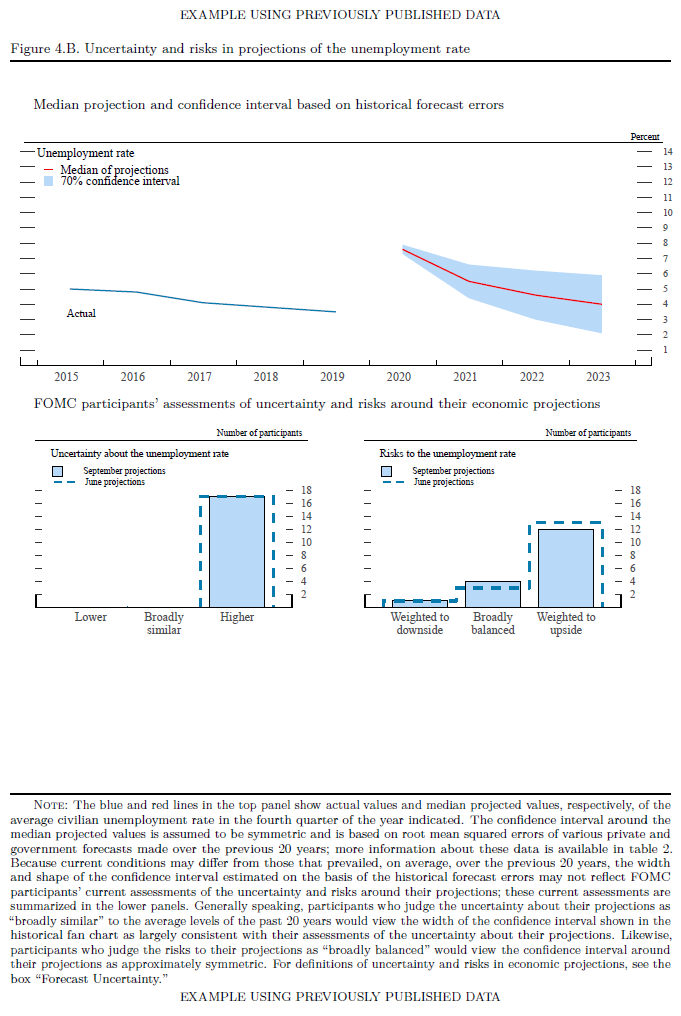
In assessing the appropriate path of the federal funds rate, FOMC participants take account of the range of possible economic outcomes, the likelihood of those outcomes, and the potential benefits and costs should they occur. Those measures are represented graphically in the "fan chart" shown in the top panel.
Participants' assessments of the level of uncertainty surrounding their individual economic projections are shown in the bottom-left panel.
Participants' assessments of the balance of risks to their current economic projections are shown in the bottom-right panel.
 Click to enlarge
 Click to enlarge
 Click to enlarge
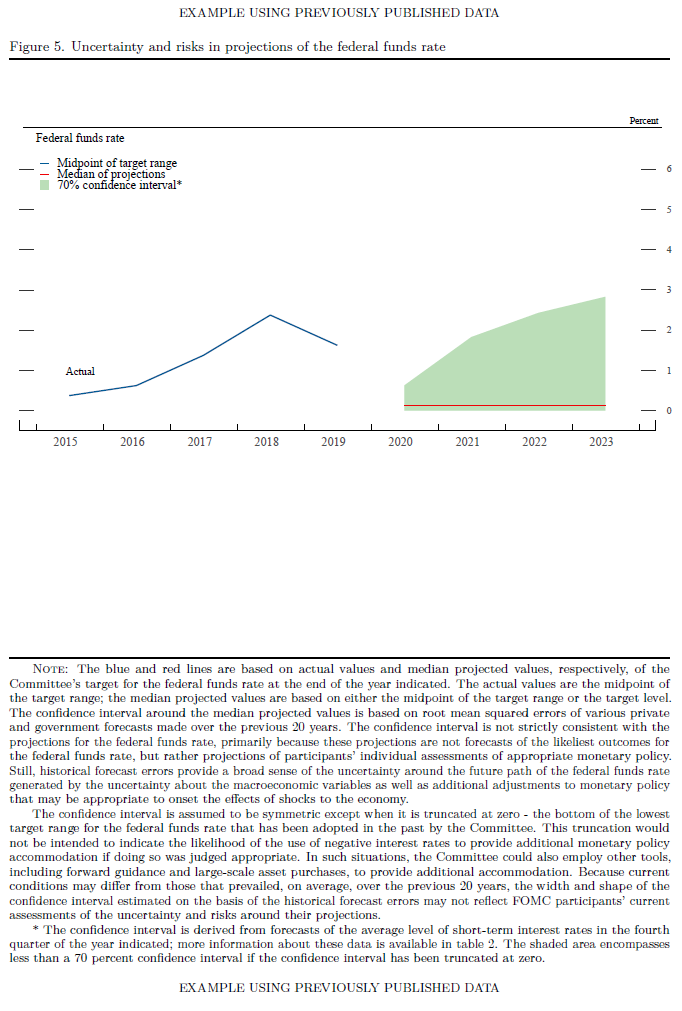
Participants' assessments of the appropriate future path of the federal funds rate are also subject to considerable uncertainty. Because the Committee adjusts the federal funds rate in response to actual and prospective developments over time in key economic variables—such as real GDP growth, the unemployment rate, and inflation—uncertainty surrounding the projected path for the federal funds rate importantly reflects the uncertainties about the paths for these economic variables, along with other factors.
Figure 5 provides a graphic representation of this uncertainty, plotting the SEP median for the federal funds rate surrounded by symmetric confidence intervals derived from the results presented in table 2. The confidence interval is assumed to be symmetric except when it is truncated at zero—the bottom of the lowest target range for the federal funds rate that has been adopted in the past by the Committee. This truncation would not be intended to indicate the likelihood of the use of negative interest rates to provide additional monetary policy accommodation if doing so was judged appropriate. In such situations, the Committee could also employ other tools, including forward guidance and large-scale asset purchases, to provide additional accommodation.
 Click to enlarge
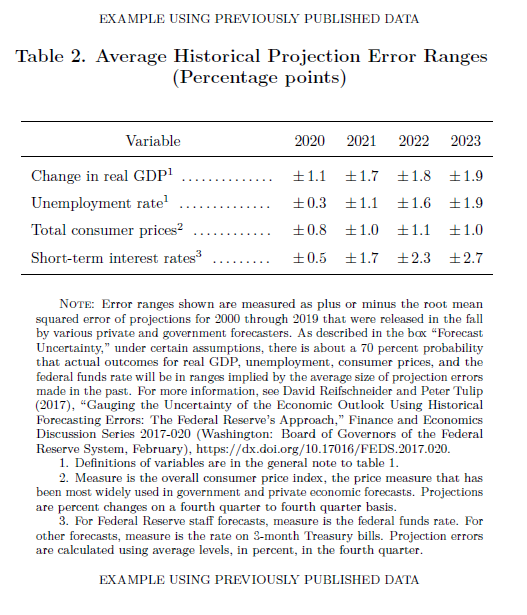
Error ranges shown are measured as plus or minus the root mean squared error of projections for the previous 20 years that were released at the same time of the year that the SEP forecast are collected by various private and government forecasters.
 Click to enlarge