January 06, 2023
Thoughts on Inflation in a Supply-Constrained Economy
At the 2023 Allied Social Science Associations (ASSA) Annual Meeting, New Orleans, Louisiana
I am particularly pleased to be here today for multiple reasons. I think most of us feel some nostalgic pull to these meetings, though I do not think I want to revisit the frantic interview cycle ever again. These meetings allow us to meet and reconnect with colleagues, hear about new and valuable research, and have in-depth discussions on the subtler, more nuanced aspects of economics. I hope to do that today with my co-panelists on a subject that has my and the Federal Open Market Committee's full attention: inflation. I want to use my time to outline the unique set of challenges facing policymakers and academics today as well as how we can better understand inflation dynamics in this new environment, including by looking at novel data sources.1
The effects of the pandemic and Russia's war against Ukraine have turned a spotlight on the supply side of the economy and its ability to adapt to rapid changes in demand and to navigate a seemingly never-ending sequence of adverse supply shocks. The unique nature of the supply and demand imbalances over the past couple of years has made it more difficult to forecast inflation, posing new challenges for monetary policy. One way to better manage these challenges is by continuing to monitor—and even expand—new sources of data. Additionally, we have some key issues to consider in approaching revised models of inflation behavior.
Before I turn to broader issues with modeling inflation, let me start with the recent inflation data. Inflation remains far too high, despite some encouraging signs lately, and is therefore of great concern. As a Fed policymaker, I am committed to bringing inflation back to our 2 percent goal.
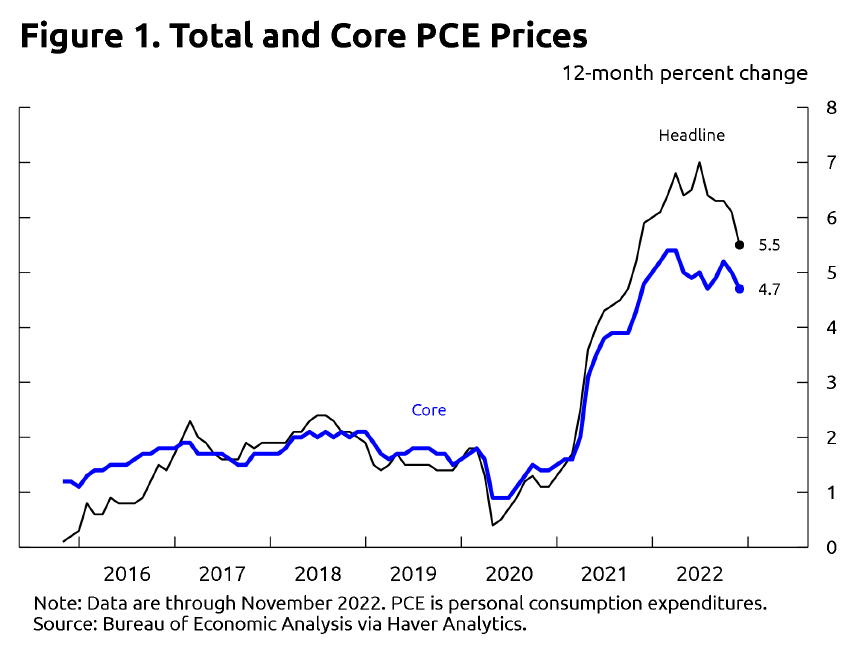
The 12-month change in total personal consumption expenditures (PCE) prices through November was 5.5 percent. Core PCE prices rose 4.7 percent over the same 12-month period (figure 1). This measure omits volatile food and energy prices and tends to give a more accurate signal of total inflation's trajectory. Both figures are down a bit from the peaks reached in the first half of last year. However, monthly data are quite volatile, so I would caution against putting too much weight on the past few favorable monthly data reports.
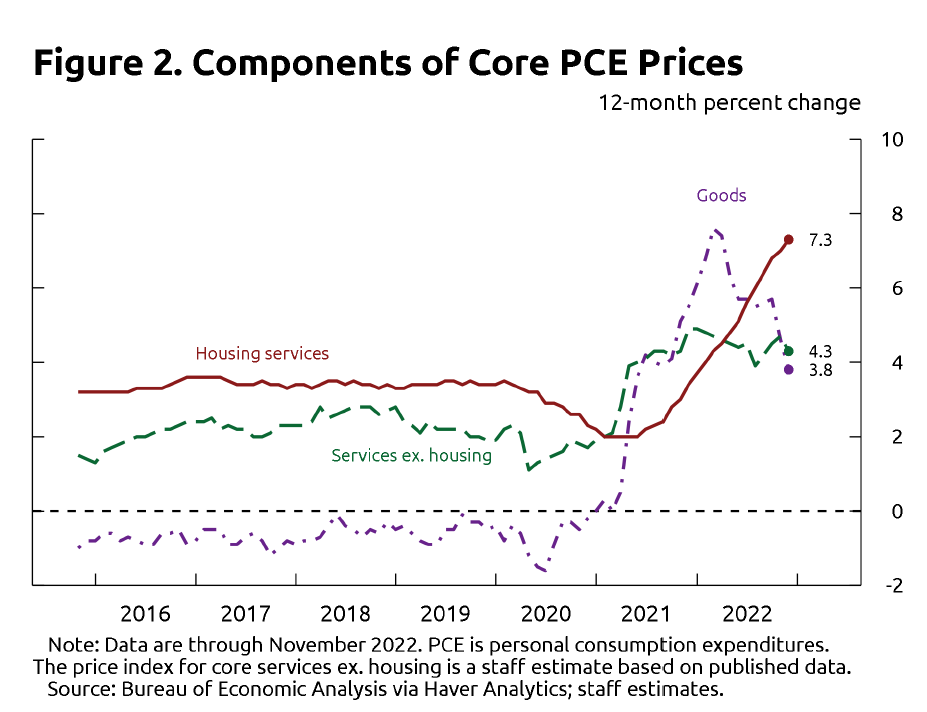
The high and volatile inflation seen over the past two years appears to reflect rapid shifts in demand, coupled with supply-chain disruptions. This has led to sizable demand–supply imbalances across different sectors. To analyze these influences, I find it useful to consider core inflation in three categories corresponding to distinct components of consumer spending: core goods inflation, housing services inflation, and inflation in core services other than housing (figure 2). In contrast to core goods inflation, which has declined over the past year, housing services inflation has continued to rise rapidly, and inflation in other core services has been little changed on balance. In the current environment, I find it helpful to examine a number of somewhat new indicators when assessing inflation pressures within each category.
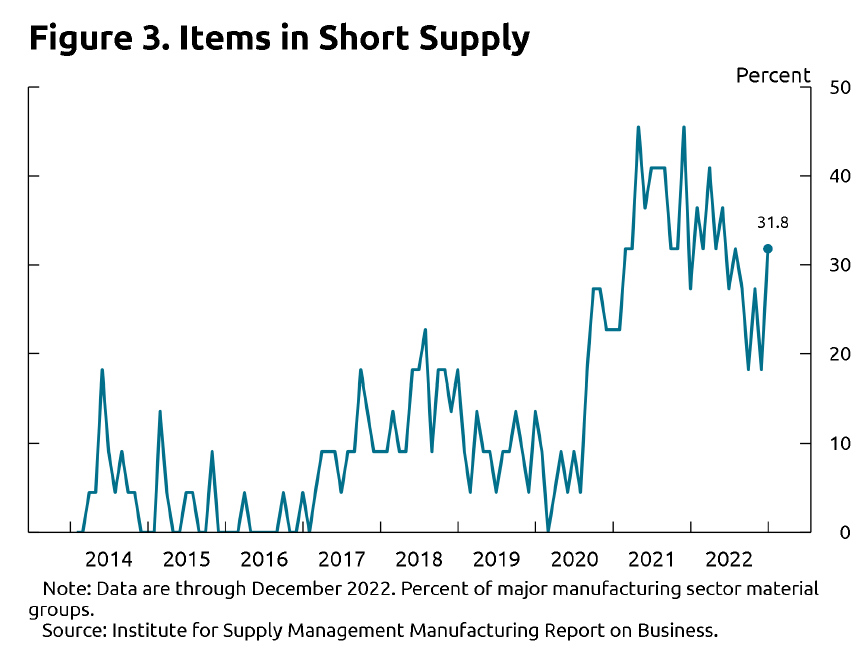
Starting with goods inflation, I have been closely observing indicators of capacity constraints along global and domestic supply chains. Shortages, bottlenecks, and other logistical issues have hampered production and boosted distribution costs for a significantly longer period than we had anticipated a couple of years ago. Fortunately, many indicators suggest that shortages of inputs have abated, and transportation costs have started to fall. For example, the list of industrial inputs that respondents to the Institute for Supply Management's (ISM) manufacturing survey indicate are in short supply is now shorter than it was at its peak at the end of 2021 (figure 3). Supply constraints are far from fully resolved, however, and respondents to the December ISM survey still reported difficulty procuring items such as electrical and hydraulic components, rubber and steel products, and—of course—semiconductors. The supply of semiconductors has been a particularly strong driver of inflation in the motor vehicle sector and has affected that sector's ability to produce vehicles—a matter I highlighted in a speech in Detroit in late November.2
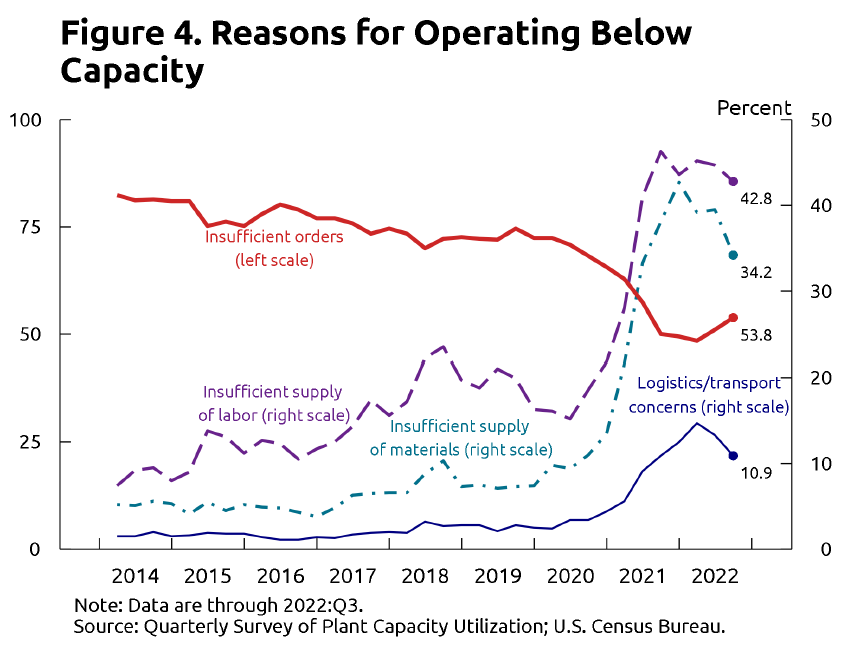
In assessing the degree to which shortages of materials and other inputs are constraining goods production, I have been following the Quarterly Survey of Plant Capacity Utilization, which asks firms whether production in their plants was below full capacity in a particular quarter and the reasons for any shortfalls (figure 4). These data show a decline over the past year in the number of plants that continue to operate below full capacity due to logistical challenges as well as parts or labor shortages.3 Yet those readings remained quite elevated in the third quarter of last year relative to rates observed before the pandemic.
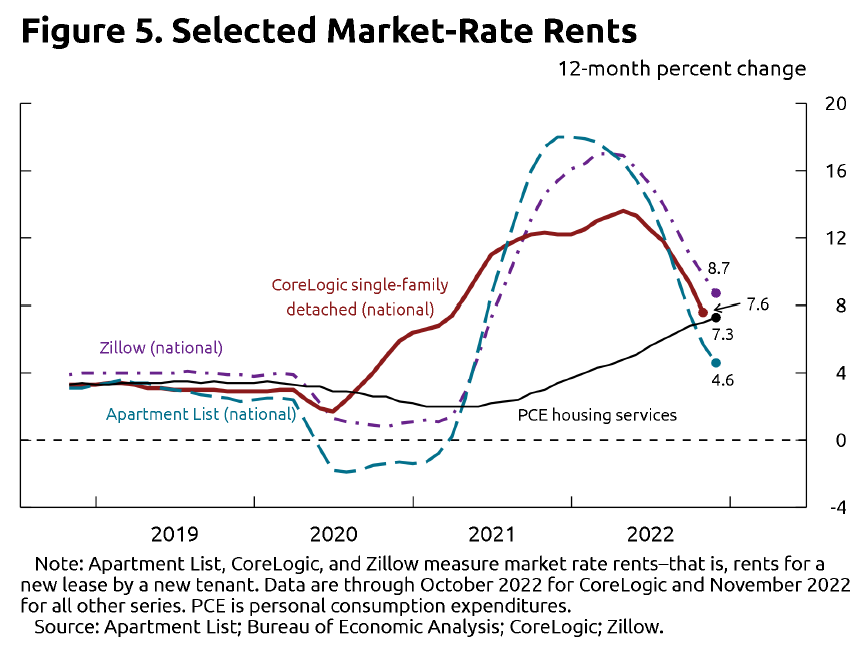
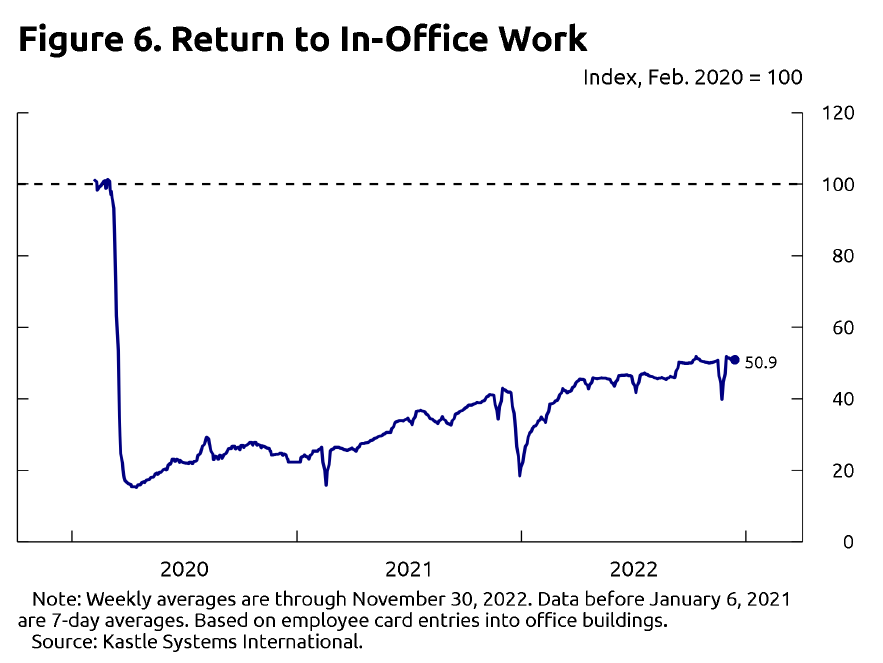
Turning to housing, a sector in which demand has been quite strong since the onset of the pandemic, the housing services component of core PCE has continued to register rapid increases. However, the housing services index tends to adjust quite slowly, as it measures the rise in rents for all tenants, including those with continuing leases, and the rise in the rental-equivalent cost of owner-occupied housing. Changes in the rental market are reflected in measures of average rents with a lag. Partly for this reason, I find it useful to consult market rents paid for new leases, which are a more timely indicator of how housing services prices are likely to change over the next 6 to 12 months (figure 5). Available measures of market rents suggest that the price increases for new tenant leases have slowed substantially over the past year. Some monthly measures have barely increased or even declined recently. This pattern may in part reflect the easing of some special factors that shifted demand during the peak of the pandemic, such as the surge in work from home and the associated increase in demand for bigger homes located in smaller metro areas or further from city centers. Because these shifts in demand happened much more rapidly than the response in housing supply, rents increased quite significantly, especially for single-family detached homes. Some of this shift in demand may have stabilized over the past year as the pandemic has waned, amenities and cultural activities in urban areas have re-opened, and more workers have returned to the office (figure 6). Although PCE housing services prices will likely increase further in the coming months as renters renew their leases, the deceleration in market rents suggests this process should slow appreciably over the course of this year.
Lastly, inflation in other core services—a large category that covers activities as varied as travel and recreation to medical and legal services—has remained stubbornly high. As my colleagues and I have noted in the past, an important source of inflation pressures in this category is the shortage of workers, which has pushed up labor costs at rates above those consistent with 2 percent inflation. The inflation outlook for this non-housing category of core services partly depends on whether growth in nominal labor costs comes back down, and recent data suggest that labor-compensation growth has indeed started to decelerate somewhat over the past year. In addition to keeping close tabs on measures of labor costs, I have found it valuable to use some high-frequency indicators of services spending, particularly in the leisure & hospitality and travel sectors (figure 7). Even as the effects of the pandemic overall appear to be subsiding, the ebbs and flows in the spread of the COVID-19 virus (in addition to other respiratory viruses) continue to add significant volatility to monthly inflation readings in these sectors.
Crucially, we must be vigilant to ensure that pandemic-era cost pressures and disruptions do not have lasting effects on inflation. If cost shocks and supply disruptions keep inflation elevated for a long enough period, households' and firms' inflation expectations could move higher—a development that could put additional upward pressure on inflation.
Accordingly, I look at a variety of measures of inflation expectations—near- and long-term, as well as survey- and market-based—that cover many different participants in the economy. Since the onset of the pandemic, medians of many surveys of longer-run measures suggest that inflation expectations are still within their pre-pandemic ranges, despite having come up a little. This is consistent with overall PCE price increases declining to a 2 percent pace. Market-based measures of inflation compensation beyond the near term, such as those derived from Treasury Inflation-Protected Securities, or TIPS, tell a similar story.
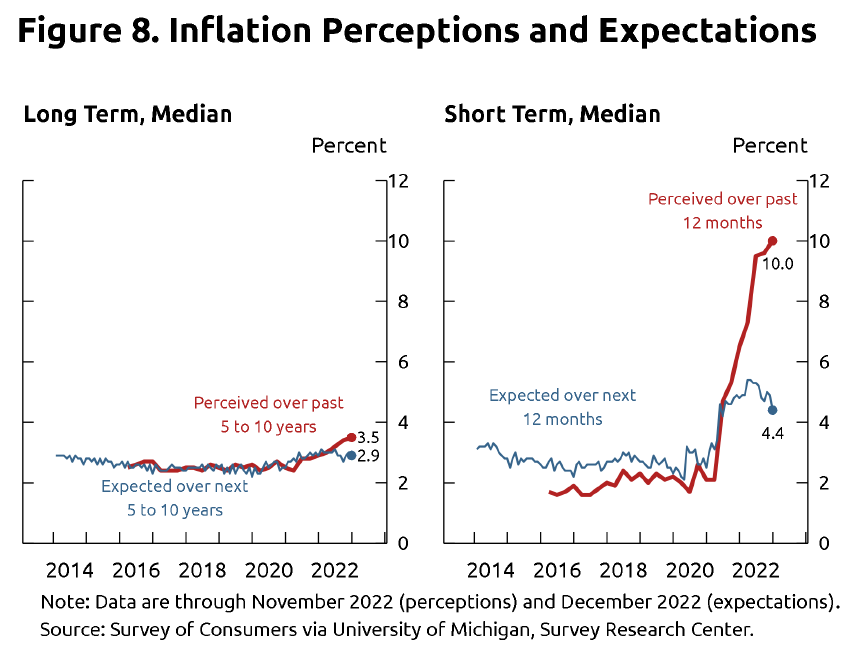
I have also looked beyond the headlines of the survey data to assess how inflation expectations are moving and responding to the current high-inflation environment. For example, in the Michigan Surveys of Consumers, we can compare households' perceptions of past inflation to their expectations of future inflation at the 1-year and 5-to-10-year horizons (figure 8). The comparisons show that while households have raised their inflation expectations over the past few years, especially for the short-term measure, the increases were far less than one-for-one with how much they perceived inflation had already risen. I will monitor these comparisons to ensure that inflation expectations remain well anchored. Any de-anchoring of expectations would be a major concern, as it could cause the high inflation that we have been experiencing to prove more persistent.
Looking ahead, the outlook for inflation will depend, in part, on how the factors restraining supply responses and boosting cost pressures in each of these three main PCE price categories play out. I think it is quite possible that the organization of production and supply chains will look different in the coming years from the way they did before the pandemic, as firms evaluate some newly exposed tradeoffs between keeping costs low and supplies available. We should keep a close eye on the incoming indicators of production disruptions and bottlenecks. We should also advance our understanding of how an environment of more frequent disruptions to the production and distribution systems will affect potential output, feed into inflation, and become an important element in forecasting inflation, assessing risks, and adjusting monetary policy.
We must also continue to advance our understanding of inflation and its underlying structural causal relationships as well as our ability to forecast risks. Progress in these areas would help us better assess developments in real time.
Some questions deserve further attention and study. As sectoral supply–demand imbalances have played a key role in understanding inflation in recent years, would adopting a model with multiple price components improve our understanding of and ability to forecast overall inflation? Relatedly, should we look to inflation models with nonlinear or threshold effects, which could capture, among other things, supply constraints? The pandemic has had a much more prolonged effect on labor supply than many expected, and rapid nominal wage growth has accompanied the recent rise in inflation in ways that traditional measures of labor market tightness—such as the unemployment rate gap—might not be capturing. Many analysts have used data on job vacancies to go beyond a simple unemployment rate gap indicator, and I see merit in such approaches. We should ask how we can better understand the relations among realizations of inflation, inflation expectations, and the rate of inflation to which the economy would gravitate after the effects of temporary shocks have ebbed. Finally, we should consider if there are ways to better anticipate structural breaks in the inflation process. For example, inflation could become a nonstationary time-series process if inflation expectations were to become de-anchored.
The responses to these questions lie in further research—research that will be made richer, more useful, and, hopefully, easier if we expand our data sources to include more real-time and other novel indicators. When the economy is disrupted by a once-in-a-century event, there is no such thing as too much data and too much analysis.
Thank you.
1. These views are my own and do not necessarily reflect those of the Federal Reserve Board or the Federal Open Market Committee. Return to text
2. See Lisa D. Cook (2022), "The Economic Outlook and U.S. Productivity," speech delivered at the Detroit Economic Club, Detroit, Michigan, November 30. Return to text
3. For information on the checkbox data from the Quarterly Survey of Plant Capacity Utilization, see Jessica Stahl and Norman Morin (2013), "Looking for Shortages of Skilled Labor in the Manufacturing Sector," FEDS Notes (Washington: Board of Governors of the Federal Reserve System, September 26); and Justin Pierce and Emily Wisniewski (2018), "Some Characteristics of the Decline in Manufacturing Capacity Utilization," FEDS Notes (Washington: Board of Governors of the Federal Reserve System, March 1). Return to text
*On January 9, 2023, a revised version of Figure 2 was posted. In the original version, the line intending to show the price index for core PCE services ex. housing was instead showing the price index for core PCE services.