February 29, 2008
On "Leveraged Losses: Lessons from the Mortgage Meltdown"
Governor Frederic S. Mishkin
At the U.S. Monetary Policy Forum, New York, New York
The paper being discussed today, "Leveraged Losses: Lessons from the Mortgage Meltdown," by David Greenlaw, Jan Hatzius, Anil Kashyap, and Hyun Song Shin, examines the following puzzle: How could the recent residential mortgage-market meltdown, which the authors estimate will lead to credit losses of around $400 billion--less than 2 percent of the outstanding $22 trillion in U.S. equities--possibly have such large negative effects on economic activity in the United States? After all, a 2 percent decline in stock market prices sometimes happens on a daily basis and yet leads to hardly a ripple in the U.S. economy.
The authors conclude that these losses have such a large potential impact because they are borne by highly leveraged financial institutions, primarily banks. Their theory is basically as follows: Because banks have so much leverage, they contract their lending by a multiple of their credit losses in order to restore their balance sheets. The resulting contraction in bank lending then leads to a substantial decline in aggregate spending, because bank loans cannot be replaced by credit from other sources. Banks are "special"--that is, they have intermediation capabilities not fully shared by other financial market participants, and those capabilities allow banks to overcome informational barriers between borrowers and lenders and thus make loans that otherwise could not be made.
I find the basic story the paper tells to be reasonably plausible and, therefore, find the paper to be valuable. I do, however, want to put the analysis of the paper in a broader perspective and provide some different views on their results.1
The Residential Mortgage Meltdown: A Financial Development Perspective
The first part of the paper provides a nice summary of how recent events in the credit markets led to the subprime meltdown. Let me offer my own view on how the recent disruptions to financial markets have many features in common with typical cycles in financial development.
Financial markets perform the essential economic function of channeling funds to those who have productive investment opportunities (which can include consumer purchases of goods and houses). As I have argued elsewhere,2 this function of financial markets is critical to a well-functioning economy; without it, countries, and their populations, cannot get rich. Enabling financial markets to effectively perform this essential function is by no means easy; financial markets must solve information problems to ensure that funds actually go to those with productive investments, so that they can pay back those who have lent to them. Financial development involves innovations or liberalization of financial markets that improve the flow of information. Unfortunately, however, financial liberalization and innovation, often have flaws and do not solve information problems as well as markets may have hoped they would. When these flaws become evident, financial markets sometimes seize up, often with very negative consequences for the economy.
I would argue that we have been experiencing exactly such a cycle in recent years. Advances in information and communications technology have allowed for faster and more disaggregated mortgage underwriting decisions. A mortgage broker with an Internet connection could quickly fill out an online form and price a loan for a customer with the help of credit-scoring technology. The same technological improvements would allow the resulting loan to be cheaply bundled with other mortgages to produce mortgage-backed securities, which could then be sold off to investors. Advances in financial engineering could take the securitization process even further by aggregating slices of mortgage-backed securities into more complicated structured products, such as collateralized debt obligations (CDOs), to tailor the credit risks of various types of assets to risk profiles desired by different kinds of investors.
As has been true of many financial innovations in the past, the benefits of this disaggregated originate-to-distribute model may have been obvious, but the problems less so. The originate-to-distribute model, unfortunately, created some severe incentive problems, which are referred to as principal-agent problems, or more simply as agency problems, in which the agent (the originator of the loans) did not have the incentives to act fully in the interest of the principal (the ultimate holder of the loan). Originators had every incentive to maintain origination volume, because that would allow them to earn substantial fees, but they had weak incentives to maintain loan quality. When loans went bad, originators lost money, mainly because of the warranties they provided on loans; however, those warranties often expired as quickly as ninety days after origination. Furthermore, unlike traditional players in mortgage markets, originators often saw little value in their charters, because they often had little capital tied up in their firm. When hit with a wave of early payment defaults and the associated warranty claims, they simply went out of business. While the lending boom lasted, however, originators earned large profits.
Many securitizers of mortgage-backed securities and resecuritizers, such as CDO managers, also, in retrospect, appear to have been motivated more by issuance and arrangement fees and less by concern for the longer-run performance of these securities.
These agency problems combined to lower underwriting standards, so that borrowers with weaker financial histories had access to larger loans. When the housing market cooled and house prices no longer rose at a rapid pace, these subprime borrowers found themselves unable to either repay their loans or refinance out of them. Investors apparently failed to realize the importance of these agency problems and, it seems, did not insist on practices to align the incentives of originators, securitizers, and resecuritizers with the underlying risks.
When these problems came to light with the end of the house-price boom, investors--including leveraged financial institutions--took large losses as mortgage-related assets were marked down in anticipation of high defaults. The market for newly issued subprime and alt-A mortgage-backed securities virtually closed. In addition, investors realized that they were sadly mistaken regarding their assumption that structured credit products with high credit ratings embodied very little risk. The unprecedented losses on, and downgrades of, those products suggested that they were far more opaque than investors had suspected, and that investors had had too much confidence in the ability of the credit rating agencies to assess the true risk of these securities. The result was that the originate-to-distribute business model, as well as structured credit products more broadly, have come into question. In turn, this situation has had a chilling effect on securities markets and has put pressure on the balance sheets of leveraged financial institutions.
Although the perspective I have outlined here is consistent with the story told in the paper, it does emphasize that there are two parts of the recent disruption in the credit market: credit losses at banks and the near-collapse of broad classes of securities markets. This perspective raises the issue, which I will return to later, of whether the negative consequences of the decline in intermediation required both of these elements to be present.
Estimating Mortgage-Credit Losses
The paper performs a very useful function by providing estimates of the credit losses likely to be realized on the current stock of outstanding loans. Not only is this calculation crucial for their analysis, it is a useful survey of three different methodologies for arriving at loss estimates. The authors first use a standard vintage curve analysis on outstanding mortgage-backed securities. Although this method makes the strong assumption that future loss curves will follow the same shape as previous loss curves, albeit at much higher levels, it provides a reasonable rough guess of the magnitudes of the losses.
The second method the authors use is ABX pricing of subprime mortgages plus standard loss estimates on prime and near-prime mortgages to come up with loss estimates. ABX prices, in principle, ought to reflect the up-to-the-minute credit losses expected by market participants as well as changes in the price of liquidity and market risk. Indeed, I was worried that ABX pricing might overestimate credit losses because it carries premiums for these other risks, and trading may be light. For example, the AAA-rated tranches of recent vintages are trading for around sixty-six cents on the dollar, which seems to build in either extreme credit-loss estimates or compensation for other risks. However, the authors weight the various vintages and tranches of the ABX by outstanding dollar amounts and get reasonable estimates, which suggests that this approach to estimating mortgage-credit losses may have some value.
The authors' third method is quite clever and uses state-level foreclosure models to estimate how declines in house prices would increase foreclosure starts and thus lead to losses. Figure 1 displays a reasonably tight relationship between the rate of foreclosures started in the third quarter of 2007 and the previous four-quarter change in house prices in the fifty states and the District of Columbia. This figure provides some backing for their approach, which, in effect, uses the historical relationship between house price declines and foreclosure starts in states that have had significant house price declines to estimate the likely effect of current projected house price declines on foreclosure starts. However, their method requires the assumption that future foreclosures will respond to house prices as they have in the past. In addition, past experience was with prime mortgages, because there was little subprime lending. Will foreclosures in the subprime market in the current episode have a similar pattern of behavior to that which has occurred for prime mortgages?
Although each method of calculating mortgage credit losses has problems, the beauty of the authors' approach is that they go at the problem in very different ways. It is striking that three very different methodologies produce similar estimates of around $400 billion in total credit losses over the next couple of years. The authors then estimate that roughly half of mortgage loans are held by U.S. leveraged financial institutions, which include commercial banks, thrifts, hedge funds, the government-sponsored enterprises, and others, and come up with losses to this sector of around $200 billion. This estimate might not be unreasonable, but it is very rough, because it assumes that institutions do not differ significantly in the kinds of risk they take on and that mortgage-related securities are evenly distributed across these financial institutions.
Effect of Credit Losses on Domestic Lending
The authors go on to show that what might appear to be a small amount of losses to financial institutions can lead to an amplified decline in domestic lending. This amplification can then explain how modest losses can lead to a substantial effect on the overall economy. Their calculation is fairly straightforward. They assume that leveraged financial institutions have a target 10-to-1 leverage ratio, so that each dollar of a loss of capital will lead to a contraction of their balance sheet, and hence lending, by $10. Assuming that institutions can make up half of their $200 billion mortgage credit losses by raising new capital, leaving them with a decline of capital of around $100 billion, they come up with a contraction of domestic lending near $1 trillion. Actually, the authors' calculation is a bit more complicated than my simple characterization. They assume that the target leverage of banks and others decreases, as it has in previous lending cycles, but they also net out reduced lending from one leveraged entity to another. On balance, under their baseline scenario, they predict that lending to the unleveraged sector will decline by about $910 billion.
These mechanical calculations are useful, but they miss some important subtleties. First, small losses can hit key institutions, such as bond and mortgage insurers, and have large, unpredictable effects. Second, if leveraged financial institutions such as banks were the only ones that had credit losses and, as a result, cut back lending, other institutions or securities issuance could replace some of the lost lending. Put another way, although banks are special because they have advantages in processing information and making loans, a big contraction in their assets would not necessarily choke off all lending. Banks are special, but not that special. As I discussed earlier, a key characteristic of this episode of financial disruption is that it has spread far beyond leveraged financial institutions. It has led to a sharp decline in securities issuance; this decline has to be an important part of the story of why the current financial market turmoil is affecting economic activity. In other words, mortgage credit losses are a problem because they are hitting bank balance sheets at the same time that the securitization market is experiencing difficulties.
Effect of Decreased Leveraged Institution Lending on Aggregate Spending
The paper then examines the well-known correlation between growth in debt and gross domestic product (GDP) to estimate the effect of the $910 billion decline in leveraged institution lending on economic growth. The authors first estimate an ordinary-least-squares (OLS) regression of quarterly GDP growth on four lags of GDP growth and the past four-quarter growth rate of domestic nonfinancial debt growth. They find that if debt growth falls by 1 percentage point and stays below baseline for a year, quarterly GDP growth is predicted to fall by 0.14 percentage point initially and by 0.22 percentage point over time. The authors rightfully recognize, however, that the coefficient on debt growth may be biased upward because of reverse causality--that is, causality might run from higher economic growth to higher debt growth, because when desired purchases increase, households and business finance them by borrowing more. Another way of stating the problem is that the debt-growth coefficient may not only reflect the affects of changes in credit supply but also changes in the demand for credit.
To deal with the possible bias in the OLS regression and estimate the effect of credit supply on economic growth, the authors appropriately turn to instrumental variable (IV) estimation by instrumenting debt growth in their regression with two instruments, the Treasury-Eurodollar (TED) spread and the Senior Loan Officer Opinion Survey on the willingness of banks to make installment loans. The IV estimate of the coefficient on debt growth more than doubles, so that a 1 percentage point decline in debt growth predicts a decline of 0.34 percentage point in GDP initially and 0.44 percentage points in the long run. Because a standard reverse causality story from GDP growth to debt growth suggests that the OLS estimate of the debt-growth coefficient is upwardly biased, the finding that the IV estimate is larger than the OLS estimate is indeed quite surprising.
This surprising finding raises several questions. It can call into question the validity of the instruments, which, to be valid, need to be correlated with debt growth and yet be unaffected by economic growth. This assumption, however, is unlikely to be correct because poor prospects for economic growth surely raise credit risk, thereby leading to a higher TED spread and less willingness to lend on the part of banks. Thus, a higher TED spread and less willingness to lend may reflect the likelihood of tougher economic times ahead and not an exogenous shift in credit supply.
The final calculation in the paper is to combine the authors' IV estimates with their estimate of the decline in lending from leveraged institutions of $910 billion to estimate the impact on GDP growth. The $910 billion drop in debt against a $30.3 trillion amount of nonfinancial debt outstanding is a 3 percentage point drop in nonfinancial debt growth, which when multiplied by the 0.44 long-run coefficient on debt growth, lead to a slowing of GDP growth of 1.3 percentage points over the following year.
Although this number is not implausible, there are reasons to be suspicious of it. On the one hand, even if you accept the IV coefficient estimate, despite the reasons to doubt its accuracy, it might overstate the impact of the decline in leveraged institution lending on the economy; as mentioned earlier, other sources of lending might come online if leveraged institutions stop lending. On the other hand, the estimated impact on the economy could be too low. As I have discussed, the disruption to the financial system is far broader than just to leveraged institutions. To the extent that the meltdown in the mortgage market has revealed even deeper problems in the financial system, the negative impact on economic activity could be even larger.
Conclusion
I very much enjoyed reading this paper. Many of the calculations in the paper are especially useful and help us get a better handle on how the recent turmoil in credit markets can affect the economy. I agree with the basic story that the authors tell, which is that relatively small losses in one sector of the credit market can have an outsized impact on aggregate economic activity if they cause a disruption to the financial system that leads to an amplified impact on lending. However, as my comments suggest, the authors may not have the full story. It is not just the impact on leveraged financial institutions that matter, but on the overall ability of the financial system to channel funds to those institutions with productive investment opportunities.
Footnotes
1. I thank Andreas Lehnert for his excellent assistance and helpful comments. My remarks reflect only my own views and are not intended to reflect those of the Federal Open Market Committee or of anyone else associated with the Federal Reserve System. Return to text
2. Frederic S. Mishkin (2006), The Next Great Globalization: How Disadvantaged Nations Can Harness Their Financial Systems to Get Rich, Princeton: Princeton University Press. Return to text
Figure 1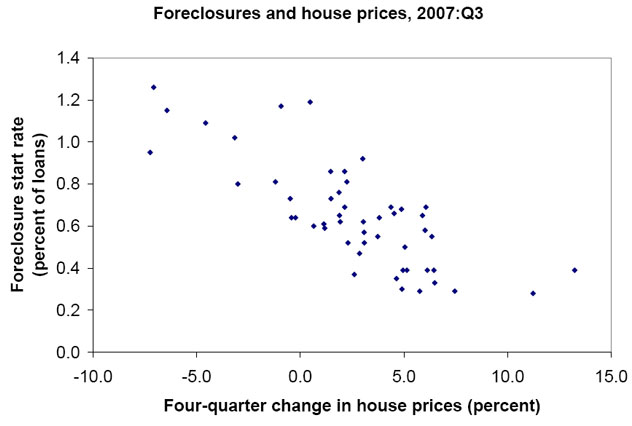
Return to text