April 06, 2018
The Outlook for the U.S. Economy
Chairman Jerome H. Powell
At The Economic Club of Chicago, Chicago, Illinois
For more than 90 years, the Economic Club of Chicago has provided a valued forum for current and future leaders to discuss issues of vital interest to this city and our nation. I am honored to have the opportunity to speak to you here today.
At the Federal Reserve, we seek to foster a strong economy for the benefit of individuals, families, and businesses throughout our country. In pursuit of that overarching objective, the Congress has assigned us the goals of achieving maximum employment and stable prices, known as the dual mandate. Today I will review recent economic developments, focusing on the labor market and inflation, and then touch briefly on longer-term growth prospects. I will finish with a discussion of monetary policy.
Recent Developments and the State of the Economy
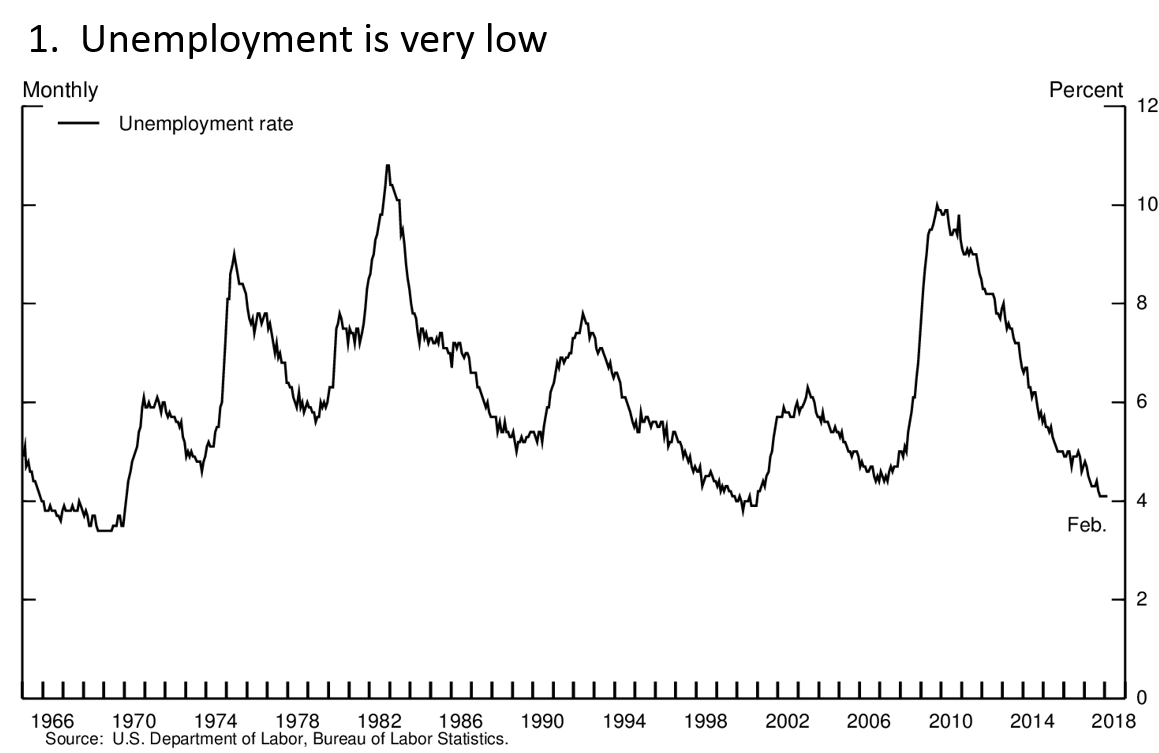
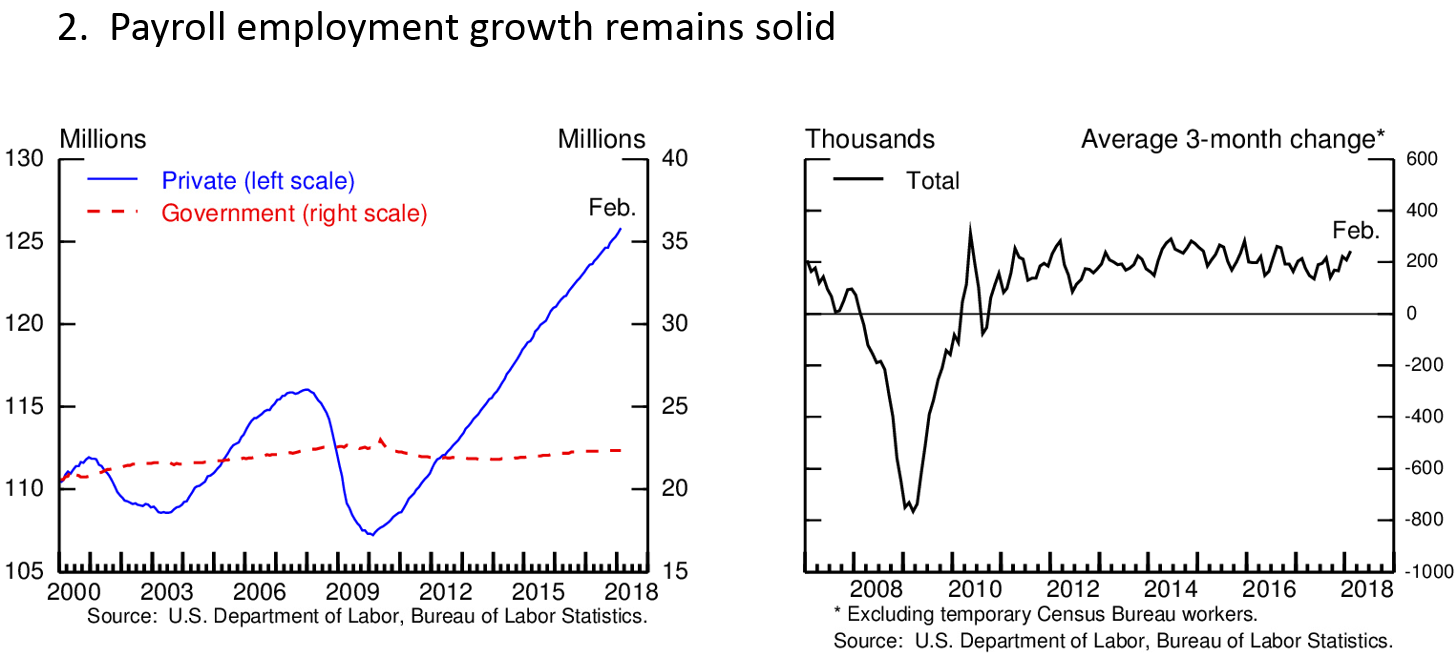
After what at times has been a slow recovery from the financial crisis and the Great Recession, growth has picked up. Unemployment has fallen from 10 percent at its peak in October 2009 to 4.1 percent, the lowest level in nearly two decades (figure 1). Seventeen million jobs have been created in this expansion, and the monthly pace of job growth remains more than sufficient to employ new entrants to the labor force (figure 2). The labor market has been strong, and my colleagues and I on the Federal Open Market Committee (FOMC) expect it to remain strong. Inflation has continued to run below the FOMC's 2 percent objective but we expect it to move up in coming months and to stabilize around 2 percent over the medium term.
Beyond the labor market, there are other signs of economic strength. Steady income gains, rising household wealth, and elevated consumer confidence continue to support consumer spending, which accounts for about two thirds of economic output. Business investment improved markedly last year following two subpar years, and both business surveys and profit expectations point to further gains ahead. Fiscal stimulus and continued accommodative financial conditions are supporting both household spending and business investment, while strong global growth has boosted U.S. exports.
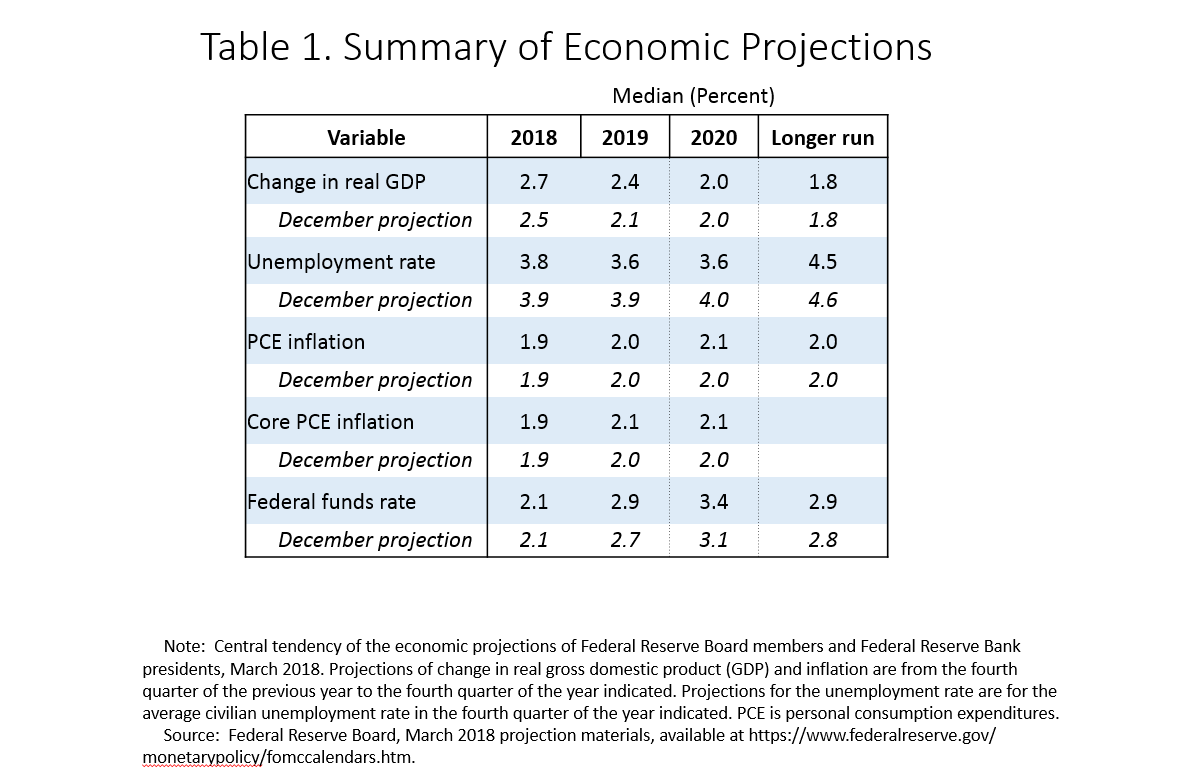
As many of you know, each quarter FOMC participants--the members of the Board of Governors and the presidents of the Reserve Banks--submit their individual projections for growth, unemployment, and inflation, as well as their forecasts of the appropriate path of the federal funds rate, which the Committee uses as the primary tool of monetary policy. These individual projections are compiled and published in the Summary of Economic Projections, or SEP. FOMC participants submitted their most recent forecasts three weeks ago, and those forecasts show a strengthening in the medium-term economic outlook (table 1). As you can see, participants generally raised their forecasts for growth in inflation-adjusted gross domestic product (GDP) and lowered their forecasts for unemployment. In addition, many participants expressed increased confidence that inflation would move up toward our 2 percent target. The FOMC sees the risks to the economic outlook as roughly balanced.
The State of the Labor Market
As I mentioned, the headline unemployment rate has declined to levels not seen since 2000. The median projection in the March SEP calls for unemployment to fall well below 4 percent for a sustained period, something that has not happened since the late 1960s. This strong labor market forecast has important implications for the fulfillment of both sides of the dual mandate, and thus for the path of monetary policy. So I will spend a few minutes exploring the state of the job market in some detail.
A good place to begin is with the term "maximum employment," which the Committee takes to mean the highest utilization of labor resources that is sustainable over time. In the long run, the level of maximum employment is not determined by monetary policy, but rather by factors affecting the structure and dynamics of the labor market.1 Also, the level of maximum employment is not directly measureable, and it changes over time. Real-time estimates of maximum employment are highly uncertain.2 Recognizing this uncertainty, the FOMC does not set a fixed goal for maximum employment. Instead, we look at a wide range of indicators to assess how close the economy is to maximum employment.
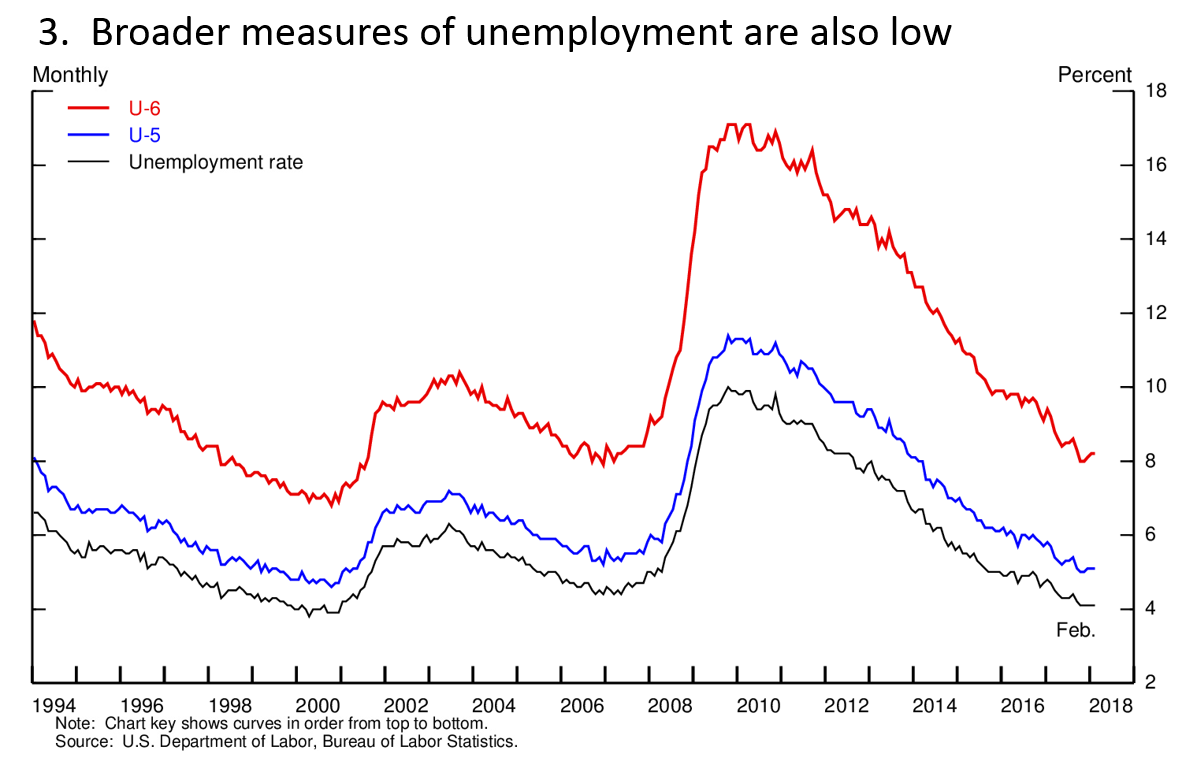
The headline unemployment rate is arguably the best single indicator of labor market conditions. In addition, it is widely known and updated each month. As I noted, the unemployment rate is currently at 4.1 percent, which is a bit below the FOMC's median estimate of the longer-run normal rate of unemployment. However, the unemployment rate does not paint a complete picture. For example, to be counted in the official measure as unemployed, a person must have actively looked for a job in the past four weeks.3 People who have not looked for work as recently are counted not as unemployed, but as out of the labor force, even though some of them actually want a job and are available to work. Others working part time may want a full-time job. And still others who say that they do not want a job right now might be pulled into the job market if the right opportunity came along. So, in judging tightness in the labor market, we also look at a range of other statistics, including alternative measures of unemployment, as well as measures of vacancies and job flows, surveys of households' and businesses' perceptions of the job market, and, of course, data on wages and prices.
Figure 3 shows the headline unemployment rate and two broader measures of unemployment, known as U-5 and U-6.4 U-5 includes the unemployed plus people who say they want a job and have looked for one in the past year (though not in the past four weeks). U-6 includes all those counted in U-5 plus people who are working part time but would like full-time work. Like the headline unemployment rate, both U-5 and U-6 have declined significantly in recent years. They are now at levels seen before the financial crisis, though not quite as low as they were in 1999 to 2000, a period of very tight job market conditions.
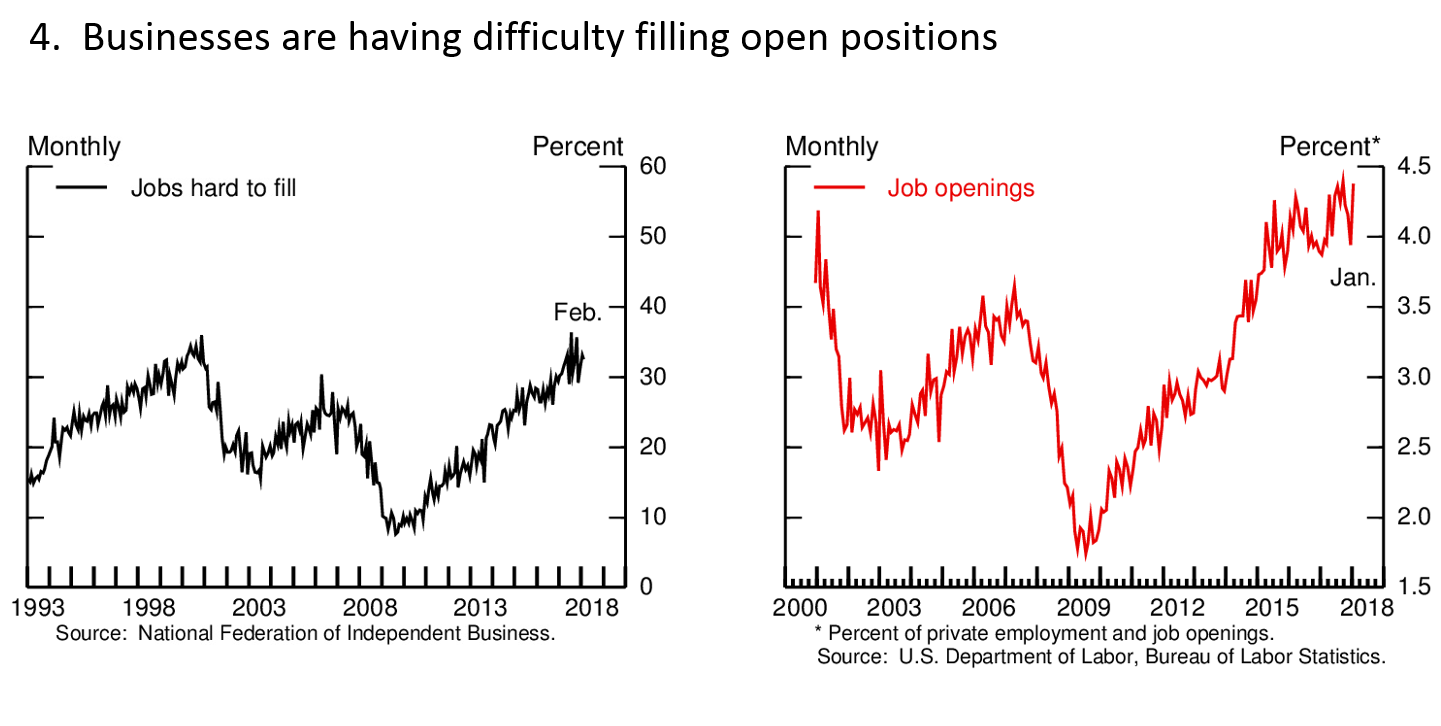
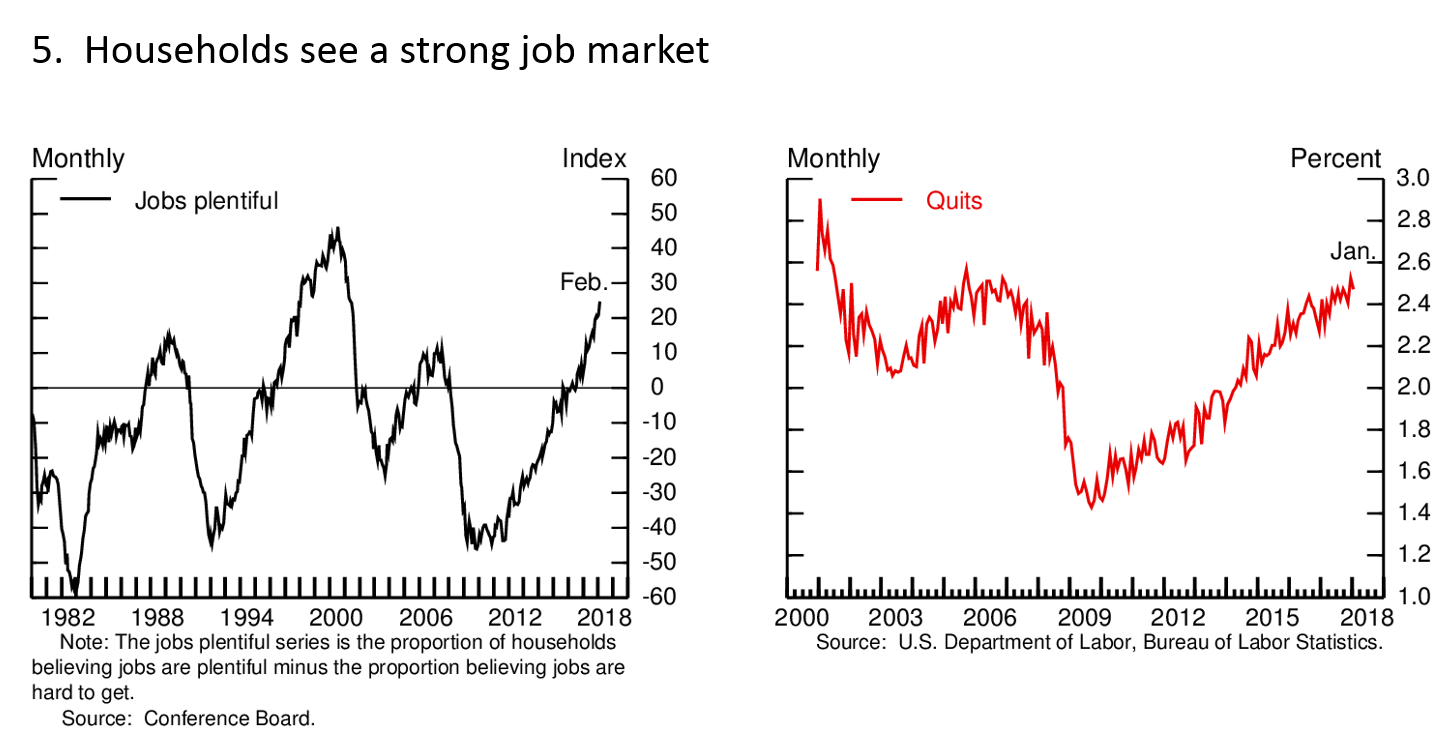
The left panel of the next chart shows that employers are having about as much difficulty now attracting qualified workers as they did 20 years ago (figure 4). Likewise, the job vacancy rate, shown on the right, is close to its all-time high, as is the average number of weeks it takes to fill a job opening.5 Households also are increasingly reporting that jobs are plentiful (figure 5), which is consistent with the high level of job postings reported by firms. In addition, the proportion of workers quitting their jobs is high, suggesting that workers are being hired away from their current employers and that others are confident enough about their prospects to leave jobs voluntarily--even before they have landed their next job.
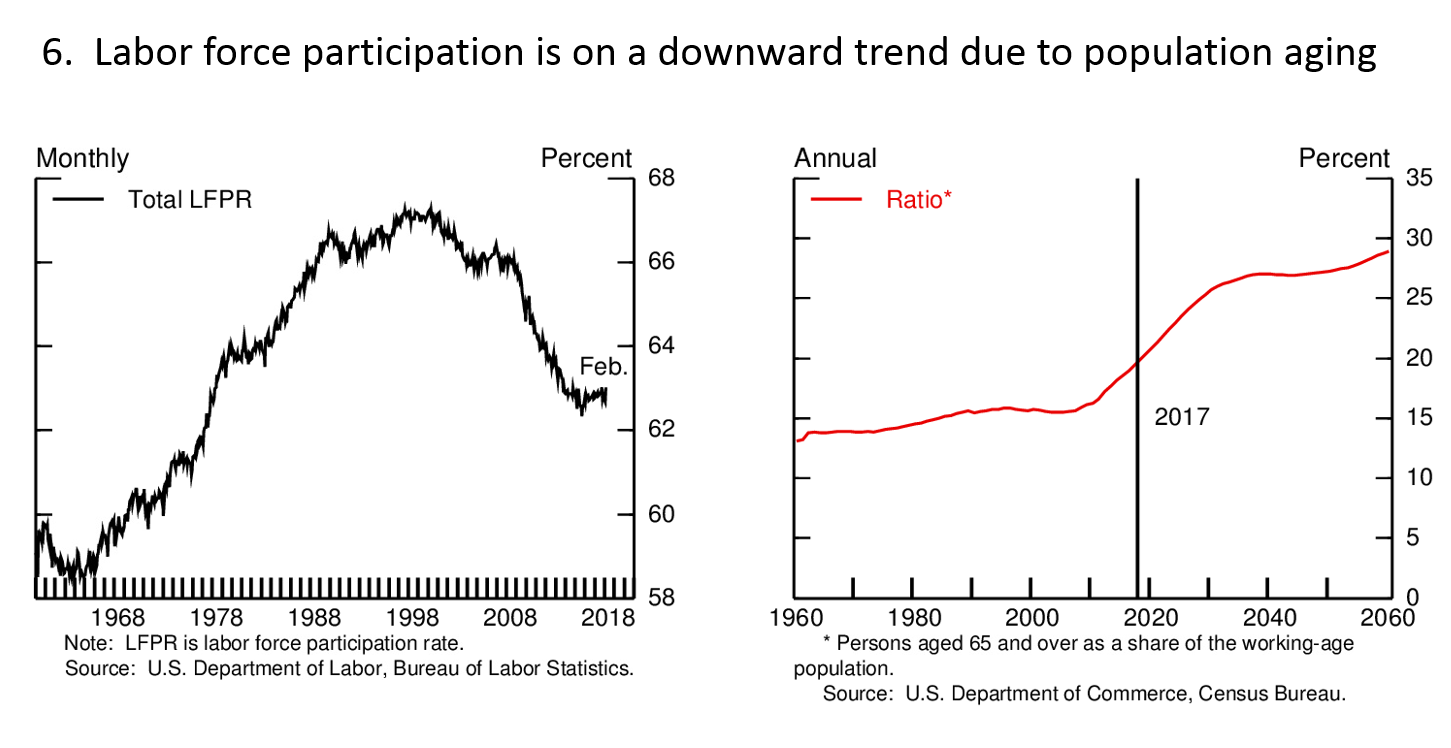
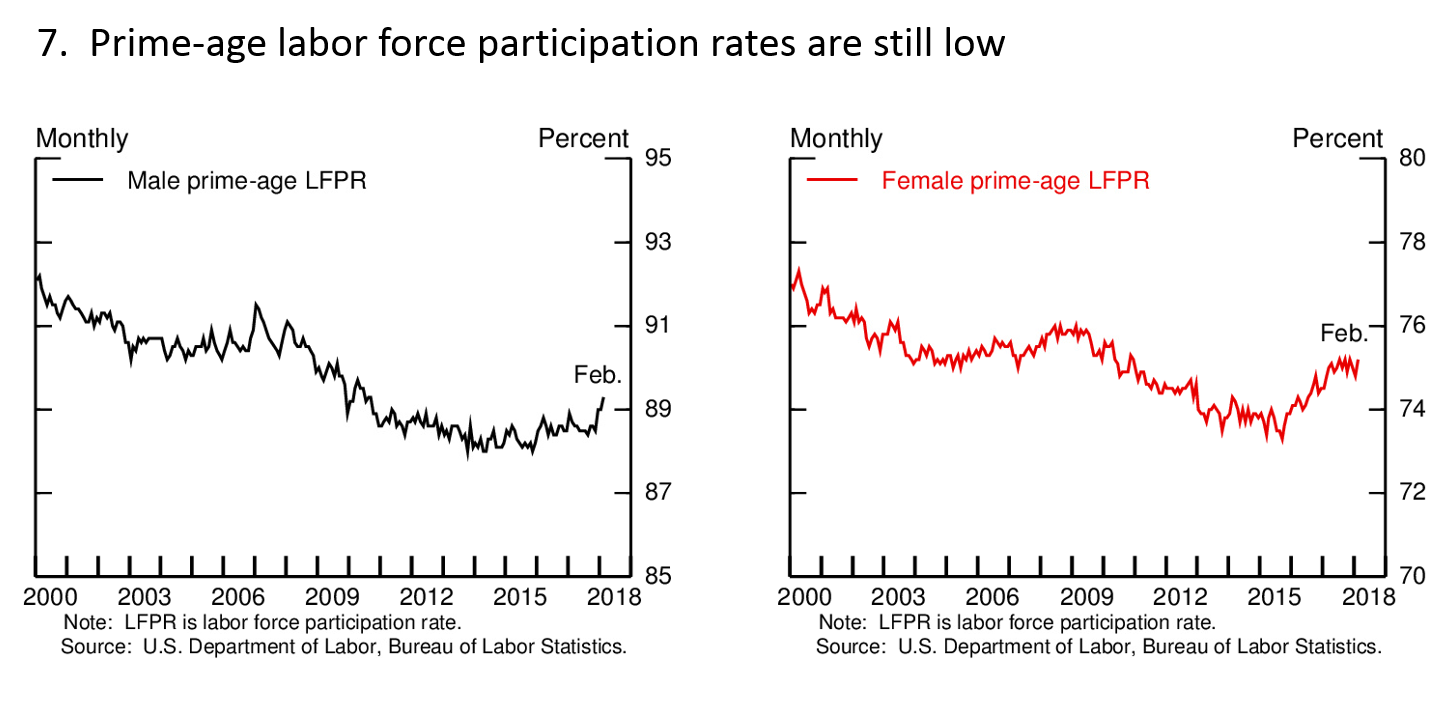
While the data I have discussed thus far do point to a tight labor market, other data are less definitive. The labor force participation rate, which measures the percentage of working age individuals who are either working or actively looking for a job, has remained steady for about four years (figure 6). This flat performance is actually a sign of improvement, since increased retirements as our population ages have been putting downward pressure on participation and will continue to do so. However, the participation rate of prime-age workers (those between the ages of 25 and 54) has not recovered fully to its pre-recession level, suggesting that there might still be room to pull more people into the labor force (figure 7). Indeed, the strong job market does appear to be drawing back some people who have been out of the labor force for a significant time. For example, the percentage of adults returning to the labor force after previously reporting that they were not working because of a disability has increased over the past couple of years, and anecdotal reports indicate that employers are increasingly willing to take on and train workers they would not have considered in the past.6
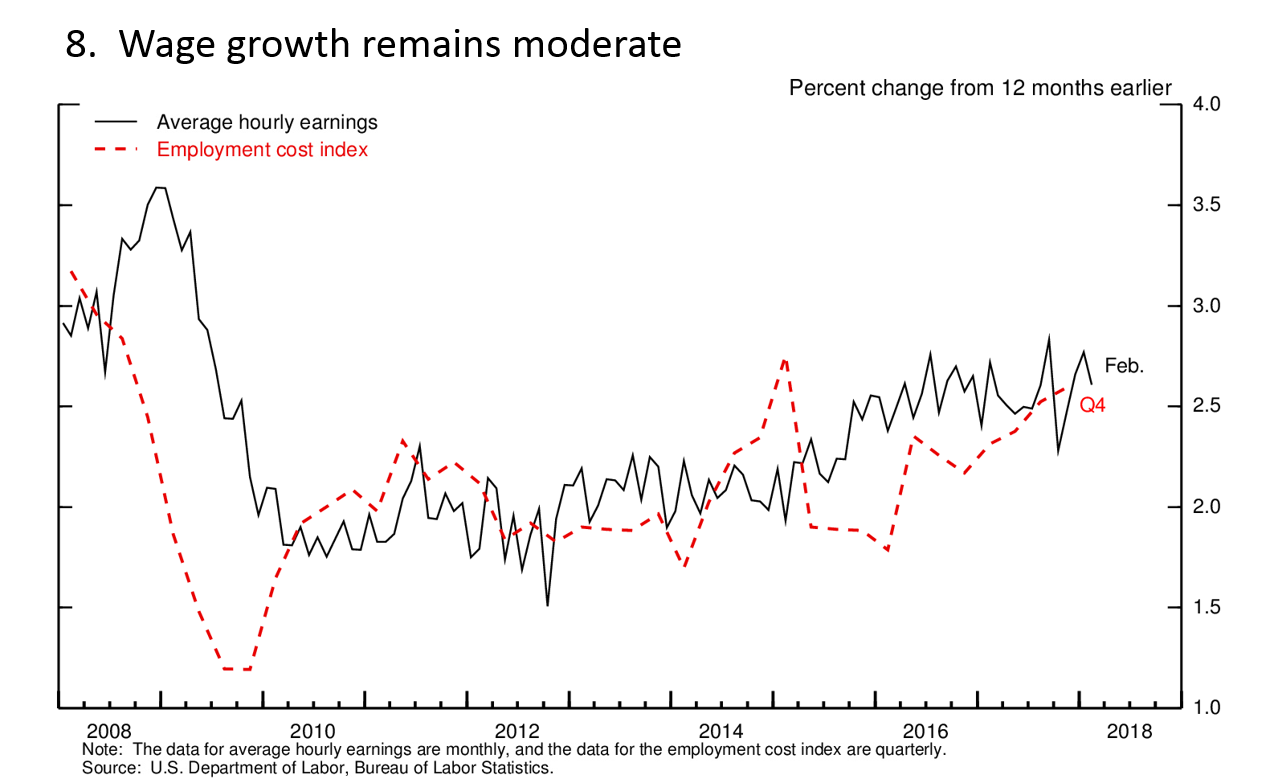
Wage growth has also remained moderate, though it has picked up compared with its pace in the early part of this recovery (figure 8). Weak productivity growth is an important reason why we have not seen larger wage gains in recent years. At the same time, the absence of a sharper acceleration in wages suggests that the labor market is not excessively tight. I will be looking for an additional pickup in wage growth as the labor market strengthens further.
Taking all of these measures of labor utilization on board, what can we say about the state of the labor market relative to our statutory goal of maximum employment? While uncertainty around the long run level of these indicators is substantial, many of them suggest a labor market that is in the neighborhood of maximum employment. A few other measures continue to suggest some remaining slack. Assessments of the maximum level of employment are uncertain, however, and subject to revision. As we seek the highest sustainable utilization of labor resources, the Committee will be guided by incoming data across all of these measures.
Inflation
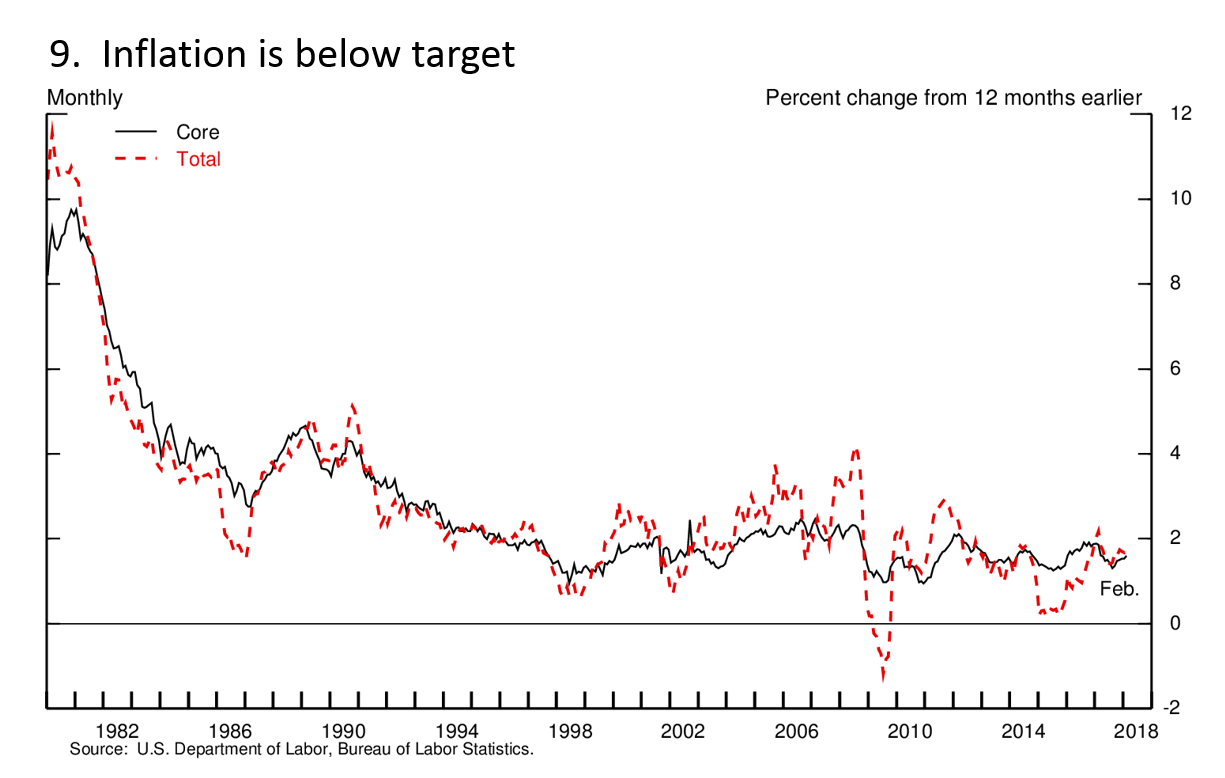
That brings me to inflation--the other leg of our dual mandate. The substantial improvement in the labor market has been accompanied by low inflation. Indeed, inflation has continued to run below our 2 percent longer-run objective (figure 9). Consumer prices, as measured by the price index for personal consumption expenditures, increased 1.8 percent over the 12 months ending in February. The core price index, which excludes the prices of energy and food and is typically a better indicator of future inflation, rose 1.6 percent over the same period. In fact, both of these indexes have been below 2 percent consistently for the past half-dozen years. This persistent shortfall in inflation from our target has led some to question the traditional relationship between inflation and the unemployment rate, also known as the Phillips curve. Given how low the unemployment rate is, why aren't we seeing higher inflation now?
As those of you who carefully read the minutes of each FOMC meeting are aware--and I know there are some of you out there--we had a thorough discussion of inflation dynamics at our January meeting. Almost all of the participants in that discussion thought that the Phillips curve remained a useful basis for understanding inflation. They also acknowledged, however, that the link between labor market tightness and changes in inflation has become weaker and more difficult to estimate, reflecting in part the extended period of low and stable inflation in the United States and in other advanced economies. Participants also noted that other factors, including inflation expectations and transitory changes in energy and import prices, can affect inflation.
My view is that the data continue to show a relationship between the overall state of the labor market and the change in inflation over time. That connection has weakened over the past couple of decades, but it still persists, and I believe it continues to be meaningful for monetary policy. Much of the shortfall in inflation in recent years is well explained by high unemployment during the early years of the recovery and by falling energy prices and the rise in the dollar in 2015 and 2016. But the decline in inflation last year, as labor market conditions improved significantly, was a bit of a surprise. The 2017 shortfall from our 2 percent goal appears to reflect, at least partly, some unusual price declines, such as for mobile phone plans, that occurred nearly a year ago. In fact, monthly inflation readings have been firmer over the past several months, and the 12-month change should move up notably this spring as last spring's soft readings drop out of the 12-month calculation. Consistent with this view, the median of FOMC participants' projections in our March survey shows inflation moving up to 1.9 percent this year and to 2 percent in 2019.
Longer-Run Challenges
Although job creation is strong and unemployment is low, the U.S. economy continues to face some important longer-run challenges. GDP growth has averaged just over 2 percent per year in the current economic expansion, much slower than in previous expansions. Even the higher growth seen in recent quarters remains below the trend before the crisis. Nonetheless, the unemployment rate has come down 6 percentage points during the current expansion, suggesting that the trend growth necessary to keep the unemployment rate unchanged has shifted down materially. The median of FOMC participants' projections of this longer-run trend growth rate is 1.8 percent. The latest estimate from the Blue-Chip consensus of private forecasters is about 2 percent.7
To unpack this discussion a little further, we can think of output growth as composed of increases in hours worked and in output per hour, also known as productivity growth. Here, a comparison with the 2001-to-2007 expansion is informative. Output growth in that earlier expansion averaged nearly 3 percent per year, well above the pace in the current expansion. Despite the faster output growth, however, average job growth in the early 2000s was 1/2 percentage point per year weaker than in the current expansion. The difference, of course, is productivity, which grew at more than twice the pace in the early 2000s than it has in recent years.
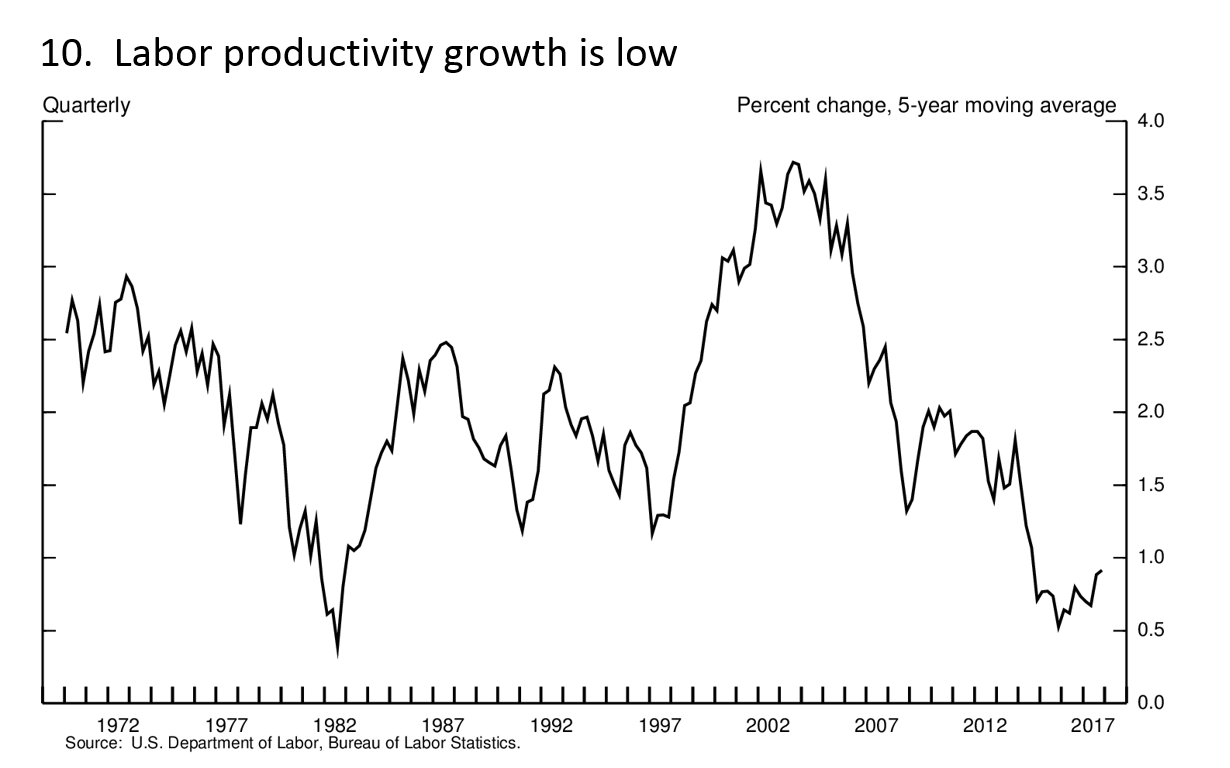
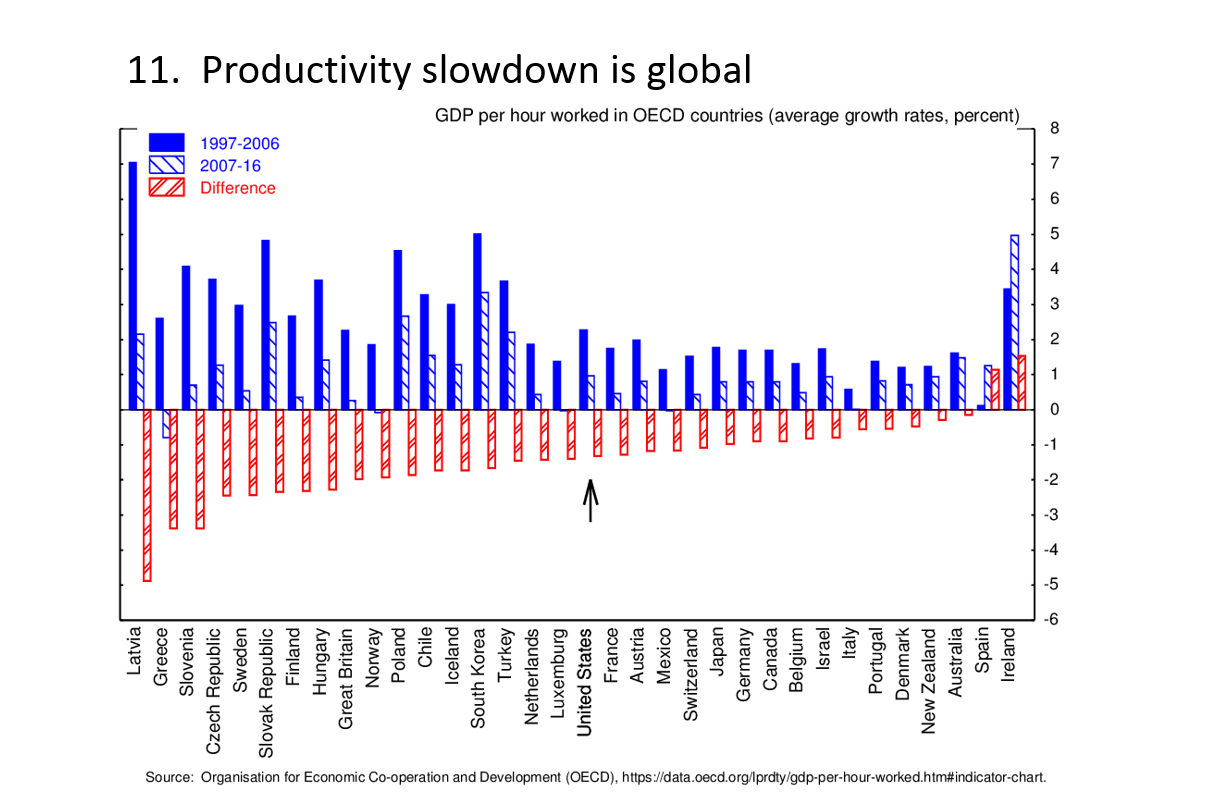
Taking a longer view, the average pace of labor productivity growth since 2010 is the slowest since World War II and about one-fourth of the average postwar rate (figure 10). Moreover, the productivity growth slowdown seems to be global and is evident even in countries that were little affected by the financial crisis (figure 11). This observation suggests that factors specific to the United States are probably not the main drivers.
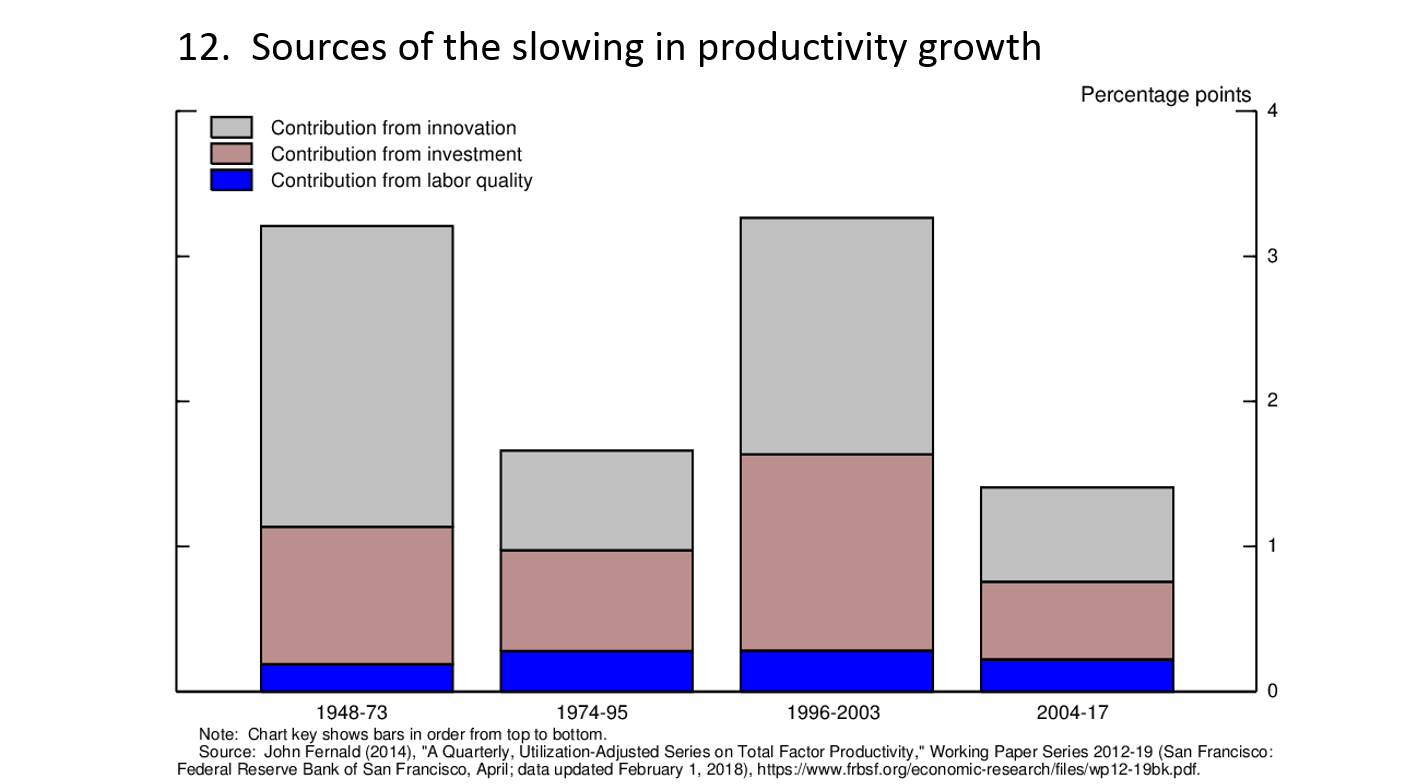
As shown in figure 12, labor productivity growth can be broken down into the contributions from business investment (or capital deepening), changes in the skills and work experience of the workforce, and a residual component that is attributed to other factors such as technological change and efficiency gains (usually lumped together under the term total factor or multifactor productivity).
In the United States and in many other countries, some of the slowdown in labor productivity growth can be traced to weak investment after the crisis. Investment has picked up recently in the United States, however, which suggests that capital deepening may pick up as well. The other big contributor to the slowdown has been in total factor productivity growth. The outlook for this dimension of productivity is considerably more uncertain. Total factor productivity growth is notoriously difficult to predict, and there are sharply different views on where it might be heading. Some argue that the productivity gains from the information technology revolution are largely behind us, and that more-recent technological innovations have less potential to boost productivity.8 Others argue that a well-documented decline in measures of business dynamism--such as the number of start-ups, the closure of less-productive businesses, and the rates at which workers quit their jobs and move around the country to take a new job--has held back productivity growth, in part by slowing the movement of capital and labor toward their most productive uses.9
New technological breakthroughs in many areas--robotics, biotech, and artificial intelligence to name just a few--have led others to take a more optimistic view.10 They point to substantial productivity gains from innovation in areas such as energy production and e-commerce. In addition, the optimists point out that advances in technology often take decades to work their way into the economy before their ultimate effects on productivity are felt. That delay has been observed even for game-changing innovations like the steam engine and electrification, which ultimately produced broad increases in productivity and living standards. In this view, we just need to be patient for new technologies to diffuse through the economy. Only time will tell who has the better view‑‑the record provides little basis to believe that we can accurately forecast the rate of increase in productivity.
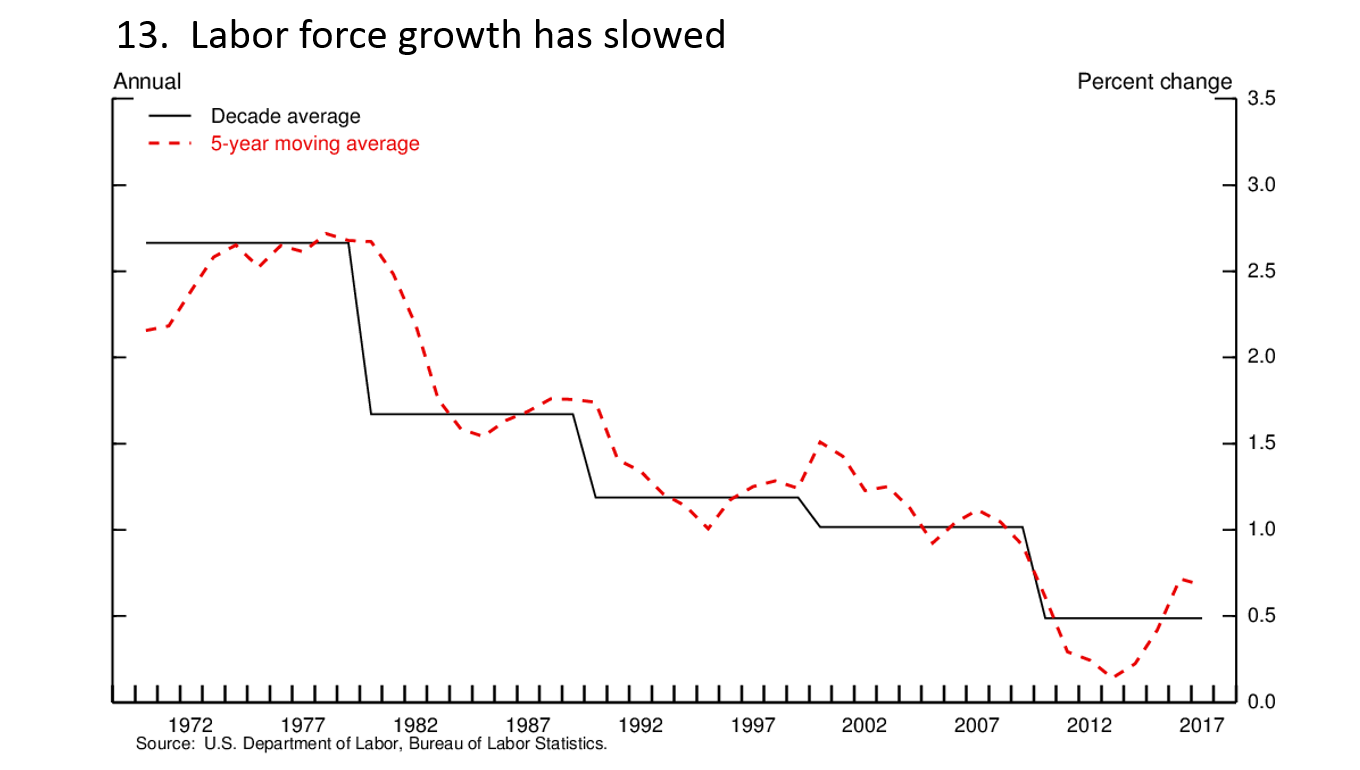
The other principal contributor to output growth is hours worked. Hours growth, in turn, is largely determined by growth in the labor force, which has averaged just 1/2 percent per year since 2010, well below the average in previous decades (figure 13). One reason for slower growth of the labor force is that baby boomers are aging and retiring, and that trend will continue. But another reason is that labor force participation of people between the ages of 25 and 54--prime-age individuals--declined from 2010 to 2015 and remains low. Indeed, the participation rate for prime-age men has been falling for more than 50 years, while women's participation in this age group rose through the 1990s but then turned downward, and it has fallen for the past 20 years.
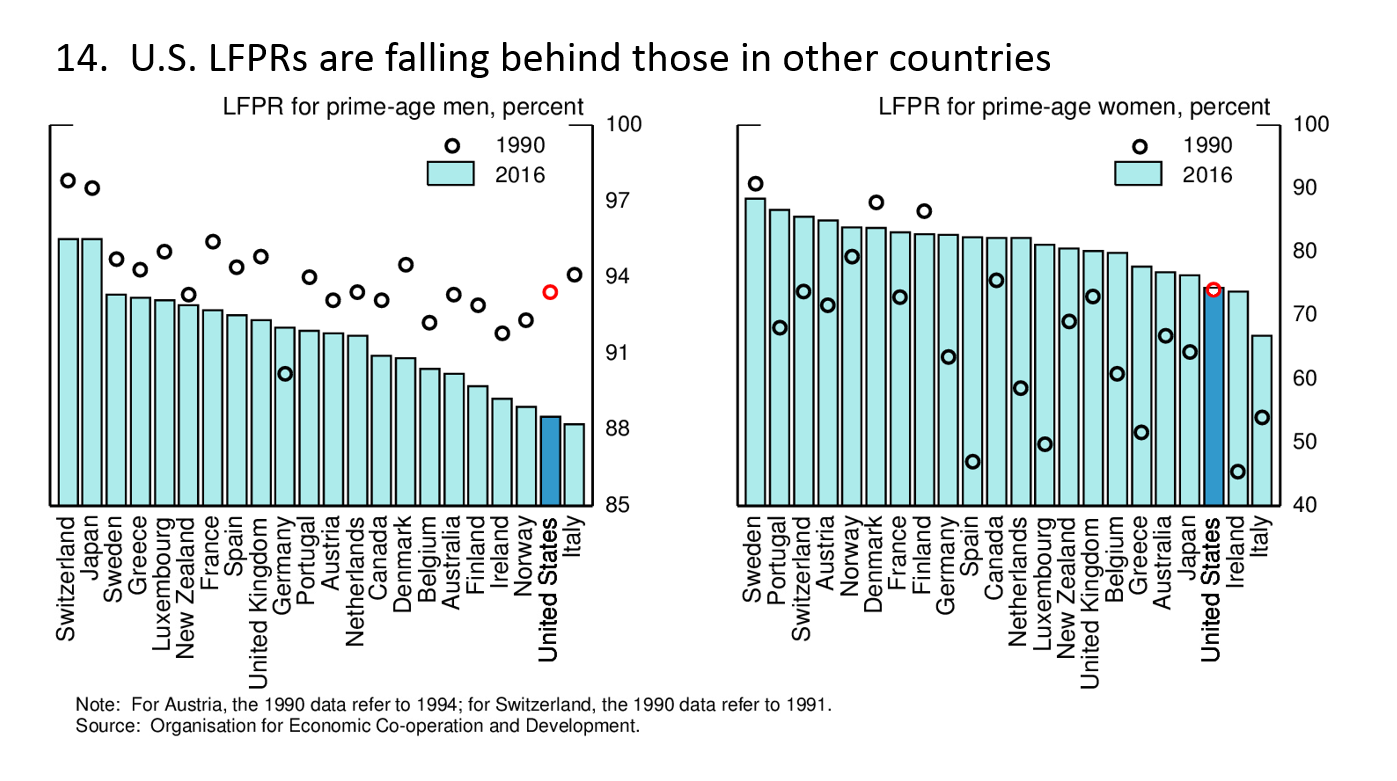
These trends in participation have been more pronounced in the United States than in other advanced economies. In 1990, the United States had relatively high participation rates for prime-age women relative to other countries and was in the midrange of advanced economies for prime-age men. However, we now stand at the low end of participation for both men and women in this age group--just above Italy, but well below Germany, France, and Spain (figure 14).
There is no consensus about the reasons for the long-term decline in prime-age participation rates, and a variety of factors could have played a role.11 For example, while automation and globalization have contributed positively to overall domestic production and growth, adjustment to these developments has resulted in dislocations of many workers without college degrees and those employed in manufacturing. In addition, factors such as the increase in disability rolls in recent decades and the opioid crisis may have reduced the supply of prime-age workers. Given that the declines have been larger here than in other countries, it seems likely that factors specific to the United States have played an important role. As I noted earlier, the strong economy may continue to pull some prime-age individuals back into the labor force and encourage others not to drop out. Research suggests that structurally-oriented measures--for example, improving education or fighting the opioid crisis--also will help raise labor force participation in this age group.12
To summarize this discussion, some of the factors weighing on longer-term growth are likely to be persistent, particularly the slowing in growth of the workforce. Others are hard to predict, such as productivity. But as a nation, we are not bystanders. We can put policies in place that will support labor force participation and give us the best chance to achieve broad and sustained increases in productivity, and thus in living standards. These policies are mostly outside the toolkit of the Federal Reserve, such as those that support investment in education and workers' skills, business investment and research and development, and investment in infrastructure.
Monetary Policy
Let me turn now to monetary policy. In the aftermath of the financial crisis, the FOMC went to extraordinary lengths to promote the recovery, support job growth, and prevent inflation from falling too low. As the recovery advanced, it became appropriate to begin reducing monetary policy support. Since monetary policy affects the economy with a lag, waiting until inflation and employment hit our goals before reducing policy support could have led to a rise in inflation to unwelcome levels. In such circumstances, monetary policy might need to tighten abruptly, which could disrupt the economy or even trigger a recession.
As a result, to sustain the expansion, the FOMC adopted a gradual approach to reducing monetary policy support. We began in December 2015 by raising our target for the federal funds rate for the first time in nearly a decade. Since then, with the economy improving but inflation still below target and some slack remaining, the Committee has continued to gradually raise interest rates. This patient approach also reduced the risk that an unforeseen blow to the economy might push the federal funds rate back near zero‑‑its effective lower bound--thus limiting our ability to provide appropriate monetary accommodation.
In addition, after careful planning and public communication, last October the FOMC began to gradually and predictably reduce the size of the Fed's balance sheet. Reducing our securities holdings is another way to move the stance of monetary policy toward neutral. The balance sheet reduction process is going smoothly and is expected to contribute over time to a gradual tightening of financial conditions. Over the next few years, the size of our balance sheet is expected to shrink significantly.
At our meeting last month, the FOMC raised the target range for the federal funds rate by 1/4 percentage point, bringing it to 1-1/2 to 1-3/4 percent. This decision marked another step in the ongoing process of gradually scaling back monetary policy accommodation. The FOMC's patient approach has paid dividends and contributed to the strong economy we have today.
Over the next few years, we will continue to aim for 2 percent inflation and for a sustained economic expansion with a strong labor market. As I mentioned, my FOMC colleagues and I believe that, as long as the economy continues broadly on its current path, further gradual increases in the federal funds rate will best promote these goals. It remains the case that raising rates too slowly would make it necessary for monetary policy to tighten abruptly down the road, which could jeopardize the economic expansion. But raising rates too quickly would increase the risk that inflation would remain persistently below our 2 percent objective. Our path of gradual rate increases is intended to balance these two risks.
Of course, our views about appropriate monetary policy in the months and years ahead will be informed by incoming economic data and the evolving outlook. If the outlook changes, so too will monetary policy. Our overarching objective will remain the same: fostering a strong economy for all Americans--one that provides plentiful jobs and low and stable inflation.
1. See the FOMC's Statement on Longer-Run Goals and Monetary Policy Strategy, amended effective January 30, 2018, available on the Board's website at https://www.federalreserve.gov/monetarypolicy/files/FOMC_LongerRunGoals.pdf. Return to text
2. This fundamental uncertainty has been extensively studied, particularly with respect to the most commonly used measure of full employment--the so-called natural rate of unemployment. The authors of one well-regarded study concluded that even when using sophisticated statistical techniques, the natural rate of unemployment could be as much as 1-1/2 percentage points above or below their point estimate. See Douglas Staiger, James H. Stock, and Mark W. Watson (1997), "How Precise Are Estimates of the Natural Rate of Unemployment? (PDF)" chapter 5 in Christina D. Romer and David H. Romer, eds., Reducing Inflation: Motivation and Strategy (Chicago: University of Chicago Press), pp. 195-246. Return to text
3. Individuals expecting to be recalled from a temporary layoff are also counted as unemployed whether or not they are actively looking for work. Return to text
4. The official unemployment rate is known as U-3. Return to text
5. These data are from the Bureau of Labor Statistics' Job Openings and Labor Turnover Survey, or JOLTS, and start in 2000. Return to text
6. For disability transition rates, see Ernie Tedeschi (2018), "Will Employment Keep Growing? Disabled Workers Offer a Clue," The Upshot, New York Times, March 15. Return to text
7. Wolters Kluwer (2018), Blue Chip Economic Indicators, vol. 43, no. 3 (March 10). Return to text
8. See, for example, Robert J. Gordon (2016), The Rise and Fall of American Growth: The U.S. Standard of Living since the Civil War (Princeton, N.J.: Princeton University Press). Return to text
9. See, for example, Ryan A. Decker, John Haltiwanger, Ron S. Jarmin, and Javier Miranda (2016), "Declining Business Dynamism: What We Know and the Way Forward," American Economic Review, vol. 106 (May), pp. 203‑07. Return to text
10. See, for example, Erik Brynjolfsson, Daniel Rock, and Chad Syverson (2017), "Artificial Intelligence and the Modern Productivity Paradox: A Clash of Expectations and Statistics," NBER Working Paper Series 24001 (Cambridge, Mass.: National Bureau of Economic Research, November). Return to text
11. See, for example, Katharine G. Abraham and Melissa S. Kearney (2018), "Explaining the Decline in the U.S. Employment-to-Population Ratio: A Review of the Evidence," NBER Working Paper Series 24333 (Cambridge, Mass.: National Bureau of Economic Research, February). Return to text
12. See Alan B. Krueger (2017), "Where Have All the Workers Gone? An Inquiry into the Decline of the U.S. Labor Force Participation Rate," Brookings Papers on Economic Activity, Fall, pp. 1-87. Return to text