September 24, 2015
Inflation Dynamics and Monetary Policy
Chair Janet L. Yellen
At the Philip Gamble Memorial Lecture, University of Massachusetts, Amherst, Amherst, Massachusetts
I would like to thank Michael Ash for his kind introduction and the University of Massachusetts for the honor of being invited to deliver this year's Philip Gamble Memorial Lecture.
In my remarks today, I will discuss inflation and its role in the Federal Reserve's conduct of monetary policy. I will begin by reviewing the history of inflation in the United States since the 1960s, highlighting two key points: that inflation is now much more stable than it used to be, and that it is currently running at a very low level. I will then consider the costs associated with inflation, and why these costs suggest that the Federal Reserve should try to keep inflation close to 2 percent. After briefly reviewing our policy actions since the financial crisis, I will discuss the dynamics of inflation and their implications for the outlook and monetary policy.
Historical Review of Inflation
A crucial responsibility of any central bank is to control inflation, the average rate of increase in the prices of a broad group of goods and services. Keeping inflation stable at a moderately low level is important because, for reasons I will discuss, inflation that is high, excessively low, or unstable imposes significant costs on households and businesses. As a result, inflation control is one half of the dual mandate that Congress has laid down for the Federal Reserve, which is to pursue maximum employment and stable prices.
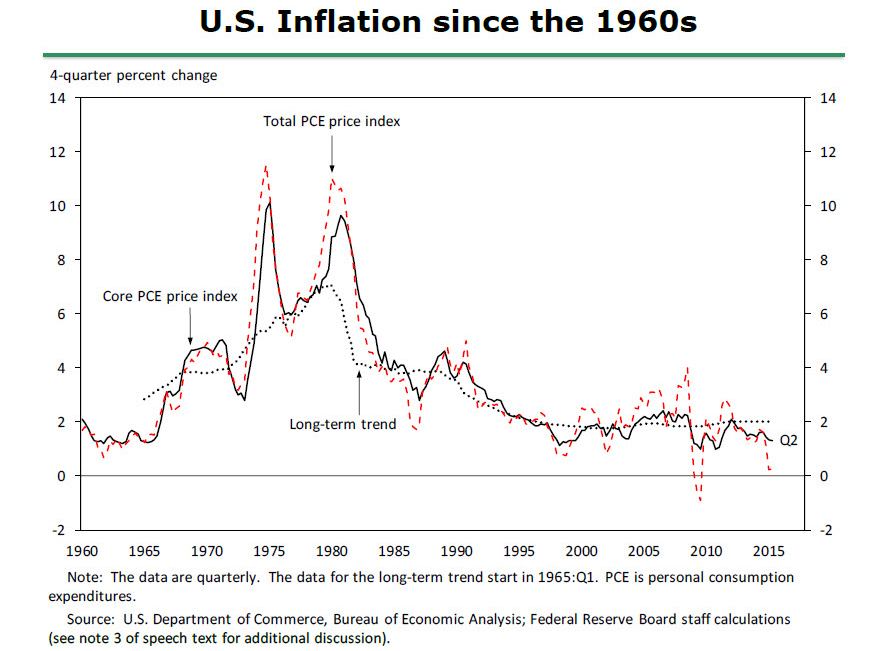
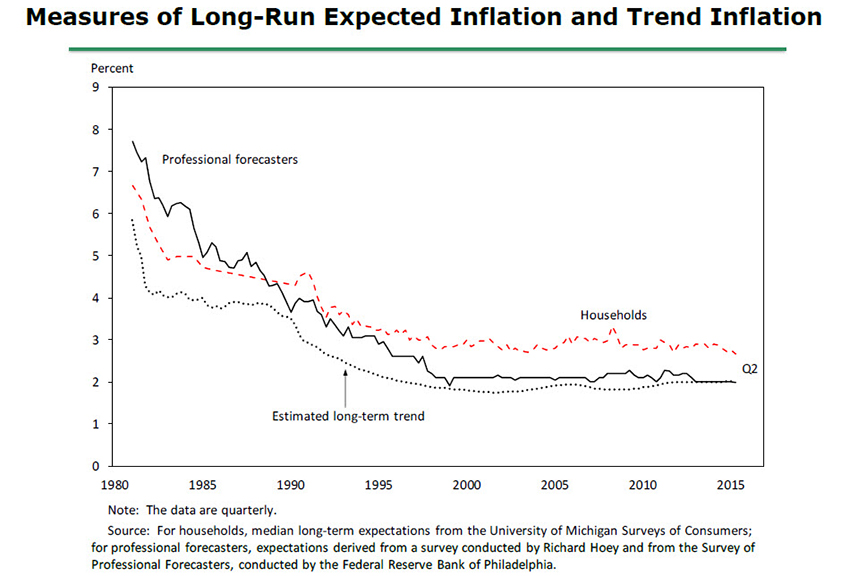
The Federal Reserve has not always been successful in fulfilling the price stability element of its mandate. The dashed red line in figure 1 plots the four-quarter percent change in the price index for personal consumption expenditures (PCE)--the measure of inflation that the Fed's policymaking body, the Federal Open Market Committee, or FOMC, uses to define its longer-run inflation goal.1 Starting in the mid-1960s, inflation began to move higher. Large jumps in food and energy prices played a role in this upward move, but they were not the whole story, for, as illustrated here, inflation was already moving up before the food and energy shocks hit in the 1970s and the early 1980s.2 And if we look at core inflation, the solid black line, which excludes food and energy prices, we see that it too starts to move higher in the mid-1960s and rises to very elevated levels during the 1970s, which strongly suggests that something more than the energy and food price shocks must have been at work.
A second important feature of inflation over this period can be seen if we examine an estimate of its long-term trend, which is plotted as the dotted black line in figure 1. At each point in time, this trend is defined as the prediction from a statistical model of the level to which inflation is projected to return in the long run once the effects of any shocks to the economy have fully played out.3 As can be seen from the figure, this estimated trend drifts higher over the 1960s and 1970s, implying that during this period there was no stable "anchor" to which inflation could be expected to eventually return--a conclusion generally supported by other procedures for estimating trend inflation.
Today many economists believe that these features of inflation in the late 1960s and 1970s--its high level and lack of a stable anchor--reflected a combination of factors, including chronically overheated labor and product markets, the effects of the energy and food price shocks, and the emergence of an "inflationary psychology" whereby a rise in actual inflation led people to revise up their expectations for future inflation. Together, these various factors caused inflation--actual and expected--to ratchet higher over time. Ultimately, however, monetary policy bears responsibility for the broad contour of what happened to actual and expected inflation during this period because the Federal Reserve was insufficiently focused on returning inflation to a predictable, low level following the shocks to food and energy prices and other disturbances.
In late 1979, the Federal Reserve began significantly tightening monetary policy to reduce inflation. In response to this tightening, which precipitated a severe economic downturn in the early 1980s, overall inflation moved persistently lower, averaging less than 4 percent from 1983 to 1990. Inflation came down further following the 1990-91 recession and subsequent slow recovery and then averaged about 2 percent for many years. Since the recession ended in 2009, however, the United States has experienced inflation running appreciably below the FOMC's 2 percent objective, in part reflecting the gradual pace of the subsequent economic recovery.
Examining the behavior of inflation's estimated long-term trend reveals another important change in inflation dynamics. With the caveat that these results are based on a specific implementation of a particular statistical model, they imply that since the mid-1990s there have been no persistent movements in this predicted long-run inflation rate, which has remained very close to 2 percent. Remarkably, this stability is estimated to have continued during and after the recent severe recession, which saw the unemployment rate rise to levels comparable to those seen during the 1981-82 downturn, when the trend did shift down markedly.4 As I will discuss, the stability of this trend appears linked to a change in the behavior of long-run inflation expectations--measures of which appear to be much better anchored today than in the past, likely reflecting an improvement in the conduct of monetary policy. In any event, this empirical analysis implies that, over the past 20 years, inflation has been much more predictable over the longer term than it was back in the 1970s because the trend rate to which inflation was predicted to return no longer moved around appreciably. That said, inflation still varied considerably from year to year in response to various shocks.
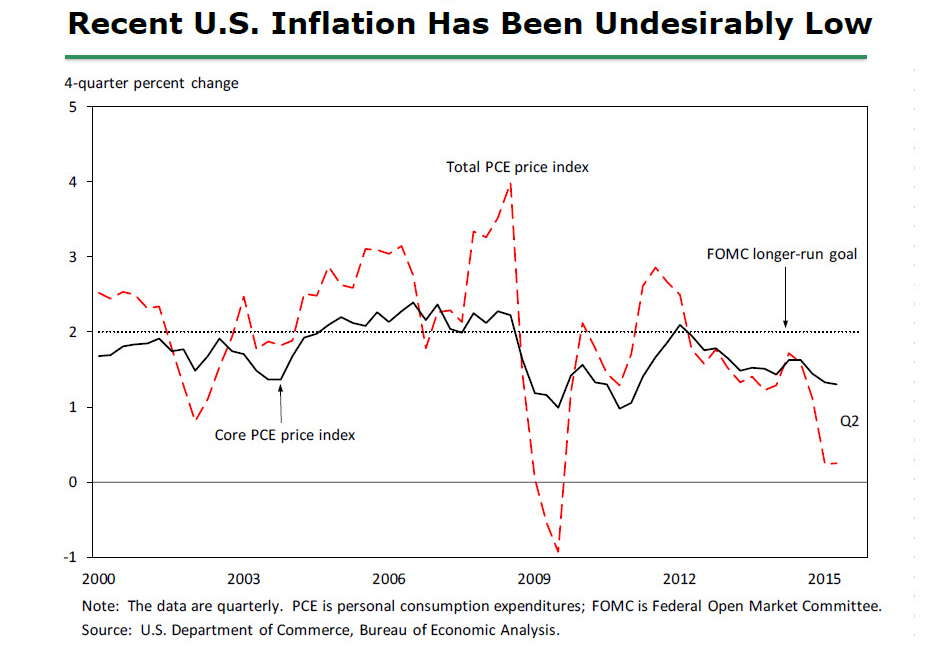
As figure 2 highlights, the United States has experienced very low inflation on average since the financial crisis, in part reflecting persistent economic weakness that has proven difficult to fully counter with monetary policy. Overall inflation (shown as the dashed red line) has averaged only about 1-1/2 percent per year since 2008 and is currently close to zero. This result is not merely a product of falling energy prices, as core inflation (the solid black line) has also been low on average over this period.
Inflation Costs
In 2012 the FOMC adopted, for the first time, an explicit longer-run inflation objective of 2 percent as measured by the PCE price index.5 (Other central banks, including the European Central Bank and the Bank of England, also have a 2 percent inflation target.) This decision reflected the FOMC's judgment that inflation that persistently deviates--up or down--from a fixed low level can be costly in a number of ways. Persistent high inflation induces households and firms to spend time and effort trying to minimize their cash holdings and forces businesses to adjust prices more frequently than would otherwise be necessary. More importantly, high inflation also tends to raise the after-tax cost of capital, thereby discouraging business investment. These adverse effects occur because capital depreciation allowances and other aspects of our tax system are only partially indexed for inflation.6
Persistently high inflation, if unanticipated, can be especially costly for households that rely on pensions, annuities, and long-term bonds to provide a significant portion of their retirement income. Because the income provided by these assets is typically fixed in nominal terms, its real purchasing power may decline surprisingly quickly if inflation turns out to be consistently higher than originally anticipated, with potentially serious consequences for retirees' standard of living as they age.7
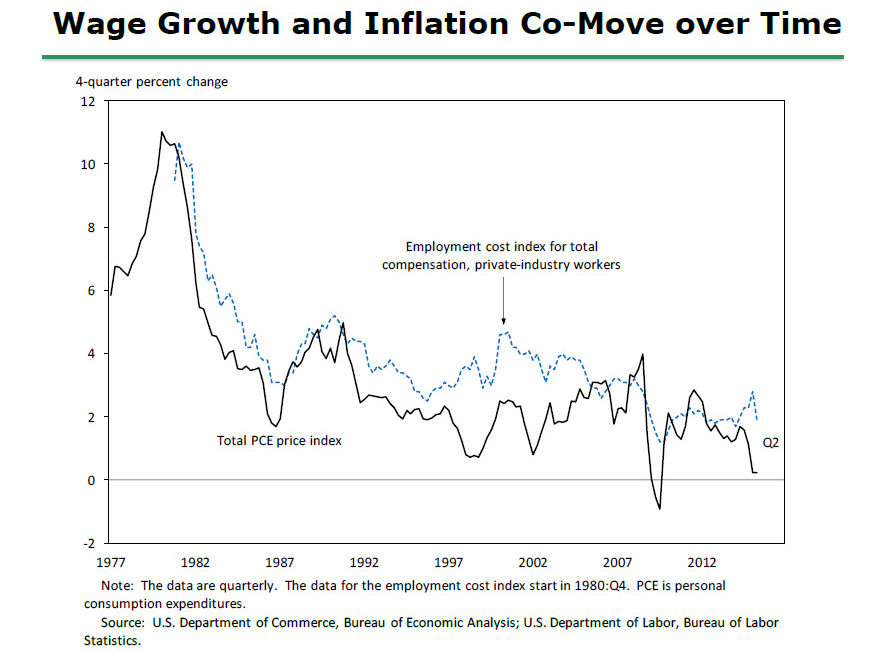
An unexpected rise in inflation also tends to reduce the real purchasing power of labor income for a time because nominal wages and salaries are generally slow to adjust to movements in the overall level of prices. Survey data suggest that this effect is probably the number one reason why people dislike inflation so much.8 In the longer run, however, real wages--that is, wages adjusted for inflation--appear to be largely independent of the average rate of inflation and instead are primarily determined by productivity, global competition, and other nonmonetary factors. In support of this view, figure 3 shows that nominal wage growth tends to broadly track price inflation over long periods of time.
Inflation that is persistently very low can also be costly, and it is such costs that have been particularly relevant to monetary policymakers in recent years. The most important cost is that very low inflation constrains a central bank's ability to combat recessions. Normally, the FOMC fights economic downturns by reducing the nominal federal funds rate, the rate charged by banks to lend to each other overnight. These reductions, current and expected, stimulate spending and hiring by lowering longer-term real interest rates--that is, nominal rates adjusted for inflation--and improving financial conditions more broadly. But the federal funds rate and other nominal interest rates cannot go much below zero, since holding cash is always an alternative to investing in securities.9 Thus, the lowest the FOMC can feasibly push the real federal funds rate is essentially the negative value of the inflation rate. As a result, the Federal Reserve has less room to ease monetary policy when inflation is very low. This limitation is a potentially serious problem because severe downturns such as the Great Recession may require pushing real interest rates far below zero for an extended period to restore full employment at a satisfactory pace.10 For this reason, pursuing too low an inflation objective or otherwise tolerating persistently very low inflation would be inconsistent with the other leg of the FOMC's mandate, to promote maximum employment.11
An unexpected decline in inflation that is sizable and persistent can also be costly because it increases the debt burdens of borrowers. Consider homeowners who take out a conventional fixed-rate mortgage, with the expectation that inflation will remain close to 2 percent and their nominal incomes will rise about 4 percent per year. If the economy were instead to experience chronic mild deflation accompanied by flat or declining nominal incomes, then after a few years the homeowners might find it noticeably more difficult to cover their monthly mortgage payments than they had originally anticipated. Moreover, if house prices fall in line with consumer prices rather than rising as expected, then the equity in their home will be lower than they had anticipated. This situation, which is sometimes referred to as "debt deflation," would also confront all households with outstanding student loans, auto loans, or credit card debt, as well as businesses that had taken out bank loans or issued bonds.12 Of course, in this situation, lenders would be receiving more real income. But the net effect on the economy is likely to be negative, in large part because borrowers typically have only a limited ability to absorb losses. And if the increased debt-service burdens and declines in collateral values are severe enough to force borrowers into bankruptcy, then the resultant hardship imposed on families, small business owners, and laid-off workers may be very severe.13
Monetary Policy Actions since the Financial Crisis
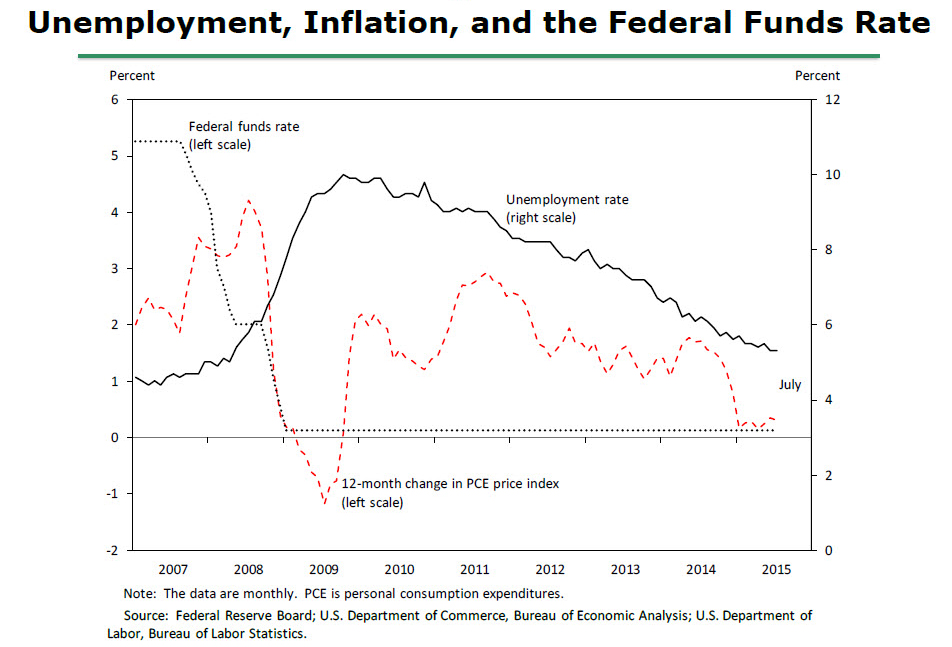
As I noted earlier, after weighing the costs associated with various rates of inflation, the FOMC decided that 2 percent inflation is an appropriate operational definition of its longer-run price objective.14 In the wake of the 2008 financial crisis, however, achieving both this objective and full employment (the other leg of the Federal Reserve's dual mandate) has been difficult, as shown in figure 4. Initially, the unemployment rate (the solid black line) soared and inflation (the dashed red line) fell sharply. Moreover, after the recession officially ended in 2009, the subsequent recovery was significantly slowed by a variety of persistent headwinds, including households with underwater mortgages and high debt burdens, reduced access to credit for many potential borrowers, constrained spending by state and local governments, and weakened foreign growth prospects. In an effort to return employment and inflation to levels consistent with the Federal Reserve's dual mandate, the FOMC took a variety of unprecedented actions to help lower longer-term interest rates, including reducing the federal funds rate (the dotted black line) to near zero, communicating to the public that short-term interest rates would likely stay exceptionally low for some time, and buying large quantities of longer-term Treasury debt and agency-issued mortgage-backed securities.15
These actions contributed to highly accommodative financial conditions, thereby helping to bring about a considerable improvement in labor market conditions over time. The unemployment rate, which peaked at 10 percent in 2009, is now 5.1 percent, slightly above the median of FOMC participants' current estimates of its longer-run normal level. Although other indicators suggest that the unemployment rate currently understates how much slack remains in the labor market, on balance the economy is no longer far away from full employment. In contrast, inflation has continued to run below the Committee's objective over the past several years, and over the past 12 months it has been essentially zero. Nevertheless, the Committee expects that inflation will gradually return to 2 percent over the next two or three years. I will now turn to the determinants of inflation and the factors that underlie this expectation.
Inflation Dynamics
Models used to describe and predict inflation commonly distinguish between changes in food and energy prices--which enter into total inflation--and movements in the prices of other goods and services--that is, core inflation. This decomposition is useful because food and energy prices can be extremely volatile, with fluctuations that often depend on factors that are beyond the influence of monetary policy, such as technological or political developments (in the case of energy prices) or weather or disease (in the case of food prices). As a result, core inflation usually provides a better indicator than total inflation of where total inflation is headed in the medium term.16 Of course, food and energy account for a significant portion of household budgets, so the Federal Reserve's inflation objective is defined in terms of the overall change in consumer prices.
What, then, determines core inflation? Recalling figure 1, core inflation tends to fluctuate around a longer-term trend that now is essentially stable. Let me first focus on these fluctuations before turning to the trend. Economic theory suggests, and empirical analysis confirms, that such deviations of inflation from trend depend partly on the intensity of resource utilization in the economy--as approximated, for example, by the gap between the actual unemployment rate and its so-called natural rate, or by the shortfall of actual gross domestic product (GDP) from potential output. This relationship--which likely reflects, among other things, a tendency for firms' costs to rise as utilization rates increase--represents an important channel through which monetary policy influences inflation over the medium term, although in practice the influence is modest and gradual. Movements in certain types of input costs, particularly changes in the price of imported goods, also can cause core inflation to deviate noticeably from its trend, sometimes by a marked amount from year to year.17 Finally, a nontrivial fraction of the quarter-to-quarter, and even the year-to-year, variability of inflation is attributable to idiosyncratic and often unpredictable shocks.18
What about the determinants of inflation's longer-term trend? Here, it is instructive to compare the purely statistical estimate of the trend rate of future inflation shown earlier in figure 1 with survey measures of people's actual expectations of long-run inflation, as is done in figure 5. Theory suggests that inflation expectations--which presumably are linked to the central bank's inflation goal--should play an important role in actual price setting.19 Indeed, the contours of these series are strikingly similar, which suggests that the estimated trend in inflation is in fact related to households' and firms' long-run inflation expectations.20
To summarize, this analysis suggests that economic slack, changes in imported goods prices, and idiosyncratic shocks all cause core inflation to deviate from a longer-term trend that is ultimately determined by long-run inflation expectations. As some will recognize, this model of core inflation is a variant of a theoretical model that is commonly referred to as an expectations-augmented Phillips curve.21 Total inflation in turn reflects movements in core inflation, combined with changes in the prices of food and energy.
An important feature of this model of inflation dynamics is that the overall effect that variations in resource utilization, import prices, and other factors will have on inflation depends crucially on whether these influences also affect long-run inflation expectations. Figure 6 illustrates this point with a stylized example of the inflation consequences of a gradual increase in the level of import prices--perhaps occurring in response to stronger real activity abroad or a fall in the exchange value of the dollar--that causes the rate of change of import prices to be elevated for a time.22 First, consider the situation shown in panel A, in which households' and firms' expectations of inflation are not solidly anchored, but instead adjust in response to the rates of inflation that are actually observed.23 Such conditions--which arguably prevailed in the United States from the 1970s to the mid-1990s--could plausibly arise if the central bank has, in the past, allowed significant and persistent movements in inflation to occur. In this case, the temporary rise in the rate of change of import prices results in a permanent increase in inflation. This shift occurs because the initial increase in inflation generated by a period of rising import prices leads households and firms to revise up their expectations of future inflation. A permanent rise in inflation would also result from a sustained rise in the level of oil prices or a temporary increase in resource utilization.
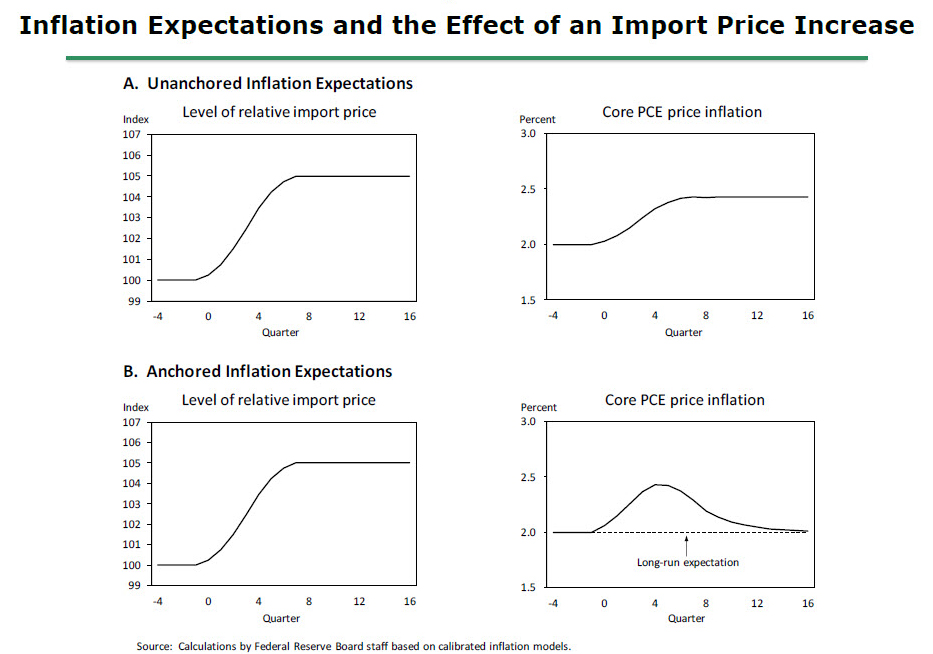
By contrast, suppose that inflation expectations are instead well anchored, perhaps because the central bank has been successful over time in keeping inflation near some specified target and has made it clear to the public that it intends to continue to do so. Then the response of inflation to a temporary increase in the rate of change of import prices or any other transitory shock will resemble the pattern shown in panel B. In this case, inflation will deviate from its longer-term level only as long as import prices are rising. But once they level out, inflation will fall back to its previous trend in the absence of other disturbances.24
A key implication of these two examples is that the presence of well-anchored inflation expectations greatly enhances a central bank's ability to pursue both of its objectives--namely, price stability and full employment. Because temporary shifts in the rate of change of import prices or other transitory shocks have no permanent influence on expectations, they have only a transitory effect on inflation. As a result, the central bank can "look through" such short-run inflationary disturbances in setting monetary policy, allowing it to focus on returning the economy to full employment without placing price stability at risk. Indeed, the Federal Reserve has done just that in setting monetary policy over the past decade or more. Moreover, as I will discuss shortly, these inflation dynamics are a key reason why the FOMC expects inflation to return to 2 percent over the next few years.
On balance, the evidence suggests that inflation expectations are in fact well anchored at present. Figure 7 plots the two survey measures of longer-term expected inflation I presented earlier, along with a measure of longer-term inflation compensation derived as the difference between yields on nominal Treasury securities and inflation-indexed ones, called TIPS. Since the late 1990s, survey measures of longer-term inflation expectations have been quite stable; this stability has persisted in recent years despite a deep recession and concerns expressed by some observers regarding the potential inflationary effects of unconventional monetary policy. The fact that these survey measures appear to have remained anchored at about the same levels that prevailed prior to the recession suggests that, once the economy has returned to full employment (and absent any other shocks), core inflation should return to its pre-recession average level of about 2 percent.
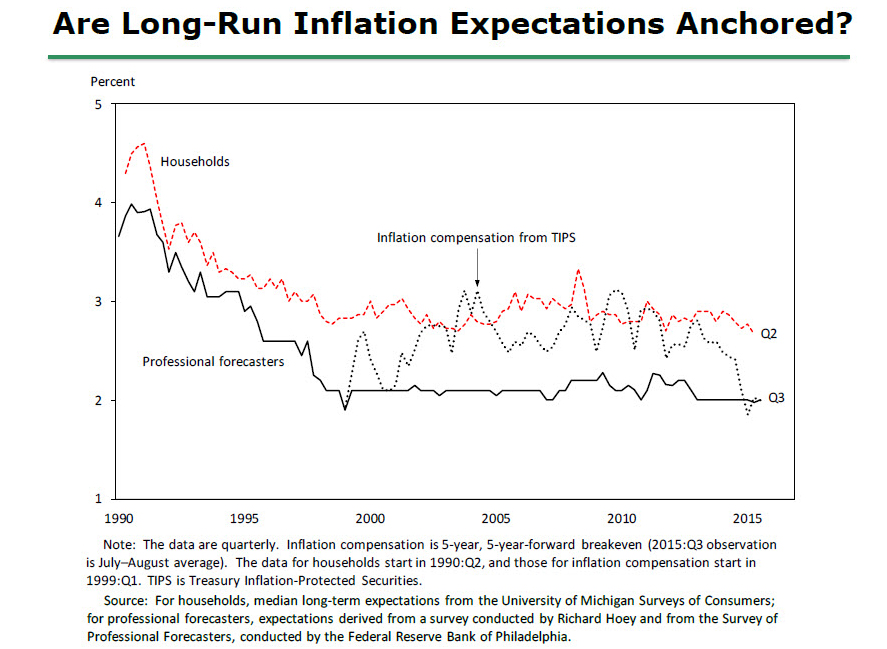
This conclusion is tempered somewhat by recent movements in longer-run inflation compensation, which in principle could reflect changes in investors' expectations for long-run inflation. This measure is now noticeably lower than in the years just prior to the financial crisis.25 However, movements in inflation compensation are difficult to interpret because they can be driven by factors that are unique to financial markets--such as movements in liquidity or risk premiums--as well as by changes in expected inflation.26 Indeed, empirical work that attempts to control for these factors suggests that the long-run inflation expectations embedded in asset prices have in fact moved down relatively little over the past decade.27 Nevertheless, the decline in inflation compensation over the past year may indicate that financial market participants now see an increased risk of very low inflation persisting.
Although the evidence, on balance, suggests that inflation expectations are well anchored at present, policymakers would be unwise to take this situation for granted. Anchored inflation expectations were not won easily or quickly: Experience suggests that it takes many years of carefully conducted monetary policy to alter what households and firms perceive to be inflation's "normal" behavior, and, furthermore, that a persistent failure to keep inflation under control--by letting it drift either too high or too low for too long--could cause expectations to once again become unmoored.28 Given that inflation has been running below the FOMC's objective for several years now, such concerns reinforce the appropriateness of the Federal Reserve's current monetary policy, which remains highly accommodative by historical standards and is directed toward helping return inflation to 2 percent over the medium term.29
Before turning to the implications of this inflation model for the current outlook and monetary policy, a cautionary note is in order. The Phillips-curve approach to forecasting inflation has a long history in economics, and it has usefully informed monetary policy decisionmaking around the globe. But the theoretical underpinnings of the model are still a subject of controversy among economists. Moreover, inflation sometimes moves in ways that empirical versions of the model, which necessarily are a simplified version of a complicated reality, cannot adequately explain. For this reason, significant uncertainty attaches to Phillips curve predictions, and the validity of forecasts from this model must be continuously evaluated in response to incoming data.
Policy Implications
Assuming that my reading of the data is correct and long-run inflation expectations are in fact anchored near their pre-recession levels, what implications does the preceding description of inflation dynamics have for the inflation outlook and for monetary policy?
This framework suggests, first, that much of the recent shortfall of inflation from our 2 percent objective is attributable to special factors whose effects are likely to prove transitory. As the solid black line in figure 8 indicates, PCE inflation has run noticeably below our 2 percent objective on average since 2008, with the shortfall approaching about 1 percentage point in both 2013 and 2014 and more than 1-1/2 percentage points this year. The stacked bars in the figure give the contributions of various factors to these deviations from 2 percent, computed using an estimated version of the simple inflation model I just discussed.30 As the solid blue portion of the bars shows, falling consumer energy prices explain about half of this year's shortfall and a sizable portion of the 2013 and 2014 shortfalls as well. Another important source of downward pressure this year has been a decline in import prices, the portion with orange checkerboard pattern, which is largely attributable to the 15 percent appreciation in the dollar's exchange value over the past year. In contrast, the restraint imposed by economic slack, the green dotted portion, has diminished steadily over time as the economy has recovered and is now estimated to be relatively modest.31 Finally, a similarly small portion of the current shortfall of inflation from 2 percent is explained by other factors (which include changes in food prices); importantly, the effects of these other factors are transitory and often switch sign from year to year.
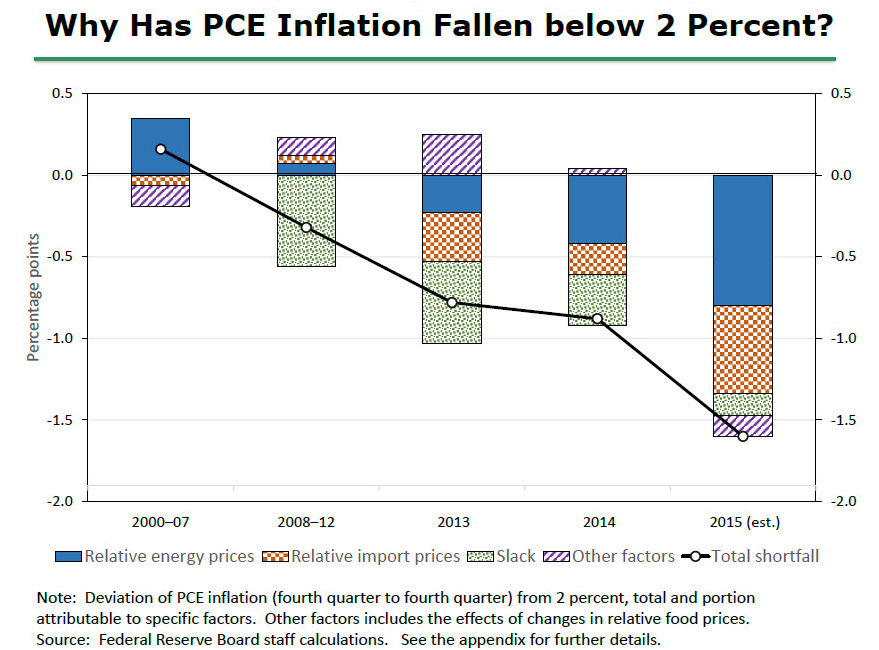
Although an accounting exercise like this one is always imprecise and will depend on the specific model that is used, I think its basic message--that the current near-zero rate of inflation can mostly be attributed to the temporary effects of falling prices for energy and non-energy imports--is quite plausible. If so, the 12-month change in total PCE prices is likely to rebound to 1-1/2 percent or higher in 2016, barring a further substantial drop in crude oil prices and provided that the dollar does not appreciate noticeably further.
To be reasonably confident that inflation will return to 2 percent over the next few years, we need, in turn, to be reasonably confident that we will see continued solid economic growth and further gains in resource utilization, with longer-term inflation expectations remaining near their pre-recession level. Fortunately, prospects for the U.S. economy generally appear solid. Monthly payroll gains have averaged close to 210,000 since the start of the year and the overall economy has been expanding modestly faster than its productive potential. My colleagues and I, based on our most recent forecasts, anticipate that this pattern will continue and that labor market conditions will improve further as we head into 2016.
The labor market has achieved considerable progress over the past several years. Even so, further improvement in labor market conditions would be welcome because we are probably not yet all the way back to full employment. Although the unemployment rate may now be close to its longer-run normal level--which most FOMC participants now estimate is around 4.9 percent--this traditional metric of resource utilization almost certainly understates the actual amount of slack that currently exists: On a cyclically adjusted basis, the labor force participation rate remains low relative to its underlying trend, and an unusually large number of people are working part time but would prefer full-time employment.32 Consistent with this assessment is the slow pace at which hourly wages and compensation have been rising, which suggests that most firms still find it relatively easy to hire and retain employees.
Reducing slack along these other dimensions may involve a temporary decline in the unemployment rate somewhat below the level that is estimated to be consistent, in the longer run, with inflation stabilizing at 2 percent. For example, attracting discouraged workers back into the labor force may require a period of especially plentiful employment opportunities and strong hiring. Similarly, firms may be unwilling to restructure their operations to use more full-time workers until they encounter greater difficulty filling part-time positions. Beyond these considerations, a modest decline in the unemployment rate below its long-run level for a time would, by increasing resource utilization, also have the benefit of speeding the return to 2 percent inflation. Finally, albeit more speculatively, such an environment might help reverse some of the significant supply-side damage that appears to have occurred in recent years, thereby improving Americans' standard of living. 33
Consistent with the inflation framework I have outlined, the medians of the projections provided by FOMC participants at our recent meeting show inflation gradually moving back to 2 percent, accompanied by a temporary decline in unemployment slightly below the median estimate of the rate expected to prevail in the longer run. These projections embody two key judgments regarding the projected relationship between real activity and interest rates. First, the real federal funds rate is currently somewhat below the level that would be consistent with real GDP expanding in line with potential, which implies that the unemployment rate is likely to continue to fall in the absence of some tightening. Second, participants implicitly expect that the various headwinds to economic growth that I mentioned earlier will continue to fade, thereby boosting the economy's underlying strength. Combined, these two judgments imply that the real interest rate consistent with achieving and then maintaining full employment in the medium run should rise gradually over time. This expectation, coupled with inherent lags in the response of real activity and inflation to changes in monetary policy, are the key reasons that most of my colleagues and I anticipate that it will likely be appropriate to raise the target range for the federal funds rate sometime later this year and to continue boosting short-term rates at a gradual pace thereafter as the labor market improves further and inflation moves back to our 2 percent objective.
By itself, the precise timing of the first increase in our target for the federal funds rate should have only minor implications for financial conditions and the general economy. What matters for overall financial conditions is the entire trajectory of short-term interest rates that is anticipated by markets and the public. As I noted, most of my colleagues and I anticipate that economic conditions are likely to warrant raising short-term interest rates at a quite gradual pace over the next few years. It's important to emphasize, however, that both the timing of the first rate increase and any subsequent adjustments to our federal funds rate target will depend on how developments in the economy influence the Committee's outlook for progress toward maximum employment and 2 percent inflation.
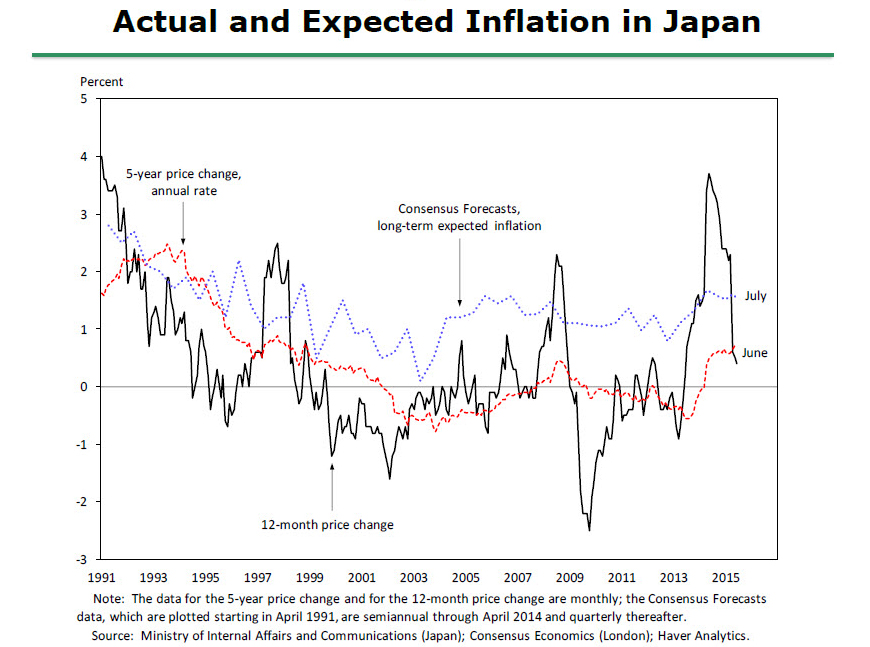
The economic outlook, of course, is highly uncertain and it is conceivable, for example, that inflation could remain appreciably below our 2 percent target despite the apparent anchoring of inflation expectations. Here, Japan's recent history may be instructive: As shown in figure 9, survey measures of longer-term expected inflation in that country remained positive and stable even as that country experienced many years of persistent, mild deflation.34 The explanation for the persistent divergence between actual and expected inflation in Japan is not clear, but I believe that it illustrates a problem faced by all central banks: Economists' understanding of the dynamics of inflation is far from perfect. Reflecting that limited understanding, the predictions of our models often err, sometimes significantly so. Accordingly, inflation may rise more slowly or rapidly than the Committee currently anticipates; should such a development occur, we would need to adjust the stance of policy in response.
Considerable uncertainties also surround the outlook for economic activity. For example, we cannot be certain about the pace at which the headwinds still restraining the domestic economy will continue to fade. Moreover, net exports have served as a significant drag on growth over the past year and recent global economic and financial developments highlight the risk that a slowdown in foreign growth might restrain U.S. economic activity somewhat further. The Committee is monitoring developments abroad, but we do not currently anticipate that the effects of these recent developments on the U.S. economy will prove to be large enough to have a significant effect on the path for policy. That said, in response to surprises affecting the outlook for economic activity, as with those affecting inflation, the FOMC would need to adjust the stance of policy so that our actions remain consistent with inflation returning to our 2 percent objective over the medium term in the context of maximum employment.
Given the highly uncertain nature of the outlook, one might ask: Why not hold off raising the federal funds rate until the economy has reached full employment and inflation is actually back at 2 percent? The difficulty with this strategy is that monetary policy affects real activity and inflation with a substantial lag. If the FOMC were to delay the start of the policy normalization process for too long, we would likely end up having to tighten policy relatively abruptly to keep the economy from significantly overshooting both of our goals. Such an abrupt tightening would risk disrupting financial markets and perhaps even inadvertently push the economy into recession. In addition, continuing to hold short-term interest rates near zero well after real activity has returned to normal and headwinds have faded could encourage excessive leverage and other forms of inappropriate risk-taking that might undermine financial stability. For these reasons, the more prudent strategy is to begin tightening in a timely fashion and at a gradual pace, adjusting policy as needed in light of incoming data.
Conclusion
To conclude, let me emphasize that, following the dual mandate established by the Congress, the Federal Reserve is committed to the achievement of maximum employment and price stability. To this end, we have maintained a highly accommodative monetary policy since the financial crisis; that policy has fostered a marked improvement in labor market conditions and helped check undesirable disinflationary pressures. However, we have not yet fully attained our objectives under the dual mandate: Some slack remains in labor markets, and the effects of this slack and the influence of lower energy prices and past dollar appreciation have been significant factors keeping inflation below our goal. But I expect that inflation will return to 2 percent over the next few years as the temporary factors that are currently weighing on inflation wane, provided that economic growth continues to be strong enough to complete the return to maximum employment and long-run inflation expectations remain well anchored. Most FOMC participants, including myself, currently anticipate that achieving these conditions will likely entail an initial increase in the federal funds rate later this year, followed by a gradual pace of tightening thereafter. But if the economy surprises us, our judgments about appropriate monetary policy will change.
References
Ascari, Guido, and Argia M. Sbordone (2014). "The Macroeconomics of Trend Inflation," Journal of Economic Literature, vol. 52 (September), pp. 679-739.
Ball, Laurence (2013). "The Case for Four Percent Inflation," Central Bank of the Republic of Turkey, Central Bank Review, vol. 13 (2), pp. 17-31.
Bernanke, Ben S. (2012). "Monetary Policy since the Onset of the Crisis," speech delivered at a symposium sponsored by the Federal Reserve Bank of Kansas City, Jackson Hole, Wyo., August 31.
Bernanke, Ben S., Thomas Laubach, Frederic S. Mishkin, and Adam S. Posen (1999). Inflation Targeting: Lessons from the International Experience. Princeton, N.J.: Princeton University Press.
Bewley, Truman F. (1999). Why Wages Don't Fall during a Recession. Cambridge, Mass.: Harvard University Press.
Blanchard, Olivier, Giovanni Dell'Ariccia, and Paolo Mauro (2010). "Rethinking Macroeconomic Policy (PDF)," IMF Staff Position Note SPN/10/03. Washington: International Monetary Fund, February 12.
Blinder, Alan S., and Jeremy B. Rudd (2013). "The Supply-Shock Explanation of the Great Stagflation Revisited," in Michael D. Bordo and Athanasios Orphanides, eds., The Great Inflation: The Rebirth of Modern Central Banking. Chicago: University of Chicago Press, pp. 119-75.
Briault, Clive (1995). "The Costs of Inflation," Bank of England Quarterly Bulletin, vol. 35 (February), pp. 33-45.
Chung, Hess, Jean-Philippe Laforte, David Reifschneider, and John C. Williams (2012). "Have We Underestimated the Likelihood and Severity of Zero Lower Bound Events?" Journal of Money, Credit and Banking, vol. 44 (February), pp. 47-82.
Clark, Todd, and William Bednar (2015). "Recent Inflation Trends," Federal Reserve Bank of Cleveland, Economic Trends, July 16.
Clark, Todd E., and Troy Davig (2008). "An Empirical Assessment of the Relationships among Inflation and Short- and Long-Term Expectations (PDF)," Research Working Paper RWP 08-05. Kansas City: Federal Reserve Bank of Kansas City, November.
Clark, Todd E., and Stephen J. Terry (2010). "Time Variation in the Inflation Passthrough of Energy Prices," Journal of Money, Credit and Banking, vol. 42 (October), pp. 1419-33.
Cogley, Timothy, Giorgio E. Primiceri, and Thomas J. Sargent (2010). "Inflation-Gap Persistence in the US," American Economic Journal: Macroeconomics, vol. 2 (January), pp. 43-69.
Cogley, Timothy, and Thomas J. Sargent (2005). "Drifts and Volatilities: Monetary Policies and Outcomes in the Post WWII US," Review of Economic Dynamics, vol. 8 (April), pp. 262-302.
Cohen, Darrel, Kevin A. Hassett, and R. Glenn Hubbard (1999). "Inflation and the User Cost of Capital: Does Inflation Still Matter?" in Martin Feldstein, ed., The Costs and Benefits of Price Stability. Chicago: University of Chicago Press, pp. 199-230.
Coibion, Olivier, and Yuriy Gorodnichenko (2015). "Is the Phillips Curve Alive and Well after All? Inflation Expectations and the Missing Disinflation," American Economic Journal: Macroeconomics, vol. 7 (January), pp. 197-232.
Curdia, Vasco, Andrea Ferrero, Ging Cee Ng, and Andrea Tambalotti (2014). "Has U.S. Monetary Policy Tracked the Efficient Interest Rate? (PDF)" Working Paper Series 2014-12. San Francisco: Federal Reserve Bank of San Francisco, May.
D'Amico, Stefania, Don Kim, and Min Wei (2014). "Tips from TIPS: The Informational Content of Treasury Inflation-Protected Security Prices (PDF)," Finance and Economics Discussion Series 2014-24. Washington: Board of Governors of the Federal Reserve System, January.
Detmeister, Alan K. (2011). "The Usefulness of Core PCE Inflation Measures (PDF)," Finance and Economics Discussion Series 2011-56. Washington: Board of Governors of the Federal Reserve System, November.
--------- (2012). "What Should Core Inflation Exclude? (PDF)" Finance and Economics Discussion Series 2012-43. Washington: Board of Governors of the Federal Reserve System, June.
Eggertsson, Gauti B., and Michael Woodford (2003). "The Zero Bound on Interest Rates and Optimal Monetary Policy," Brookings Papers on Economic Activity, vol. 34 (1), pp. 139-233.
Engen, Eric M., Thomas T. Laubach, and David Reifschneider (2015). "The Macroeconomic Effects of the Federal Reserve's Unconventional Monetary Policies (PDF)," Finance and Economics Discussion Series 2015-005. Washington: Board of Governors of the Federal Reserve System, January.
English, William B. (1999). "Inflation and Financial Sector Size," Journal of Monetary Economics, vol. 44 (December), pp. 379-400.
English, William B., J. David Lopez-Salido, and Robert J. Tetlow (2015). "The Federal Reserve's Framework for Monetary Policy: Recent Changes and New Questions," IMF Economic Review, vol. 63 (April), pp. 22-70.
Faust, Jon, and Jonathan H. Wright (2013). "Forecasting Inflation," in Graham Elliott and Allan Timmermann, eds., Handbook of Economic Forecasting, vol. 2A. Amsterdam: Elsevier-North Holland, pp. 3-56.
Feldstein, Martin (1997). "The Costs and Benefits of Going from Low Inflation to Price Stability," in Christina D. Romer and David H. Romer, eds., Reducing Inflation: Motivation and Strategy. Chicago: University of Chicago Press, pp. 123-66.
--------- (1999). "Capital Income Taxes and the Benefit of Price Stability," in Martin Feldstein, ed., The Costs and Benefits of Price Stability. Chicago: University of Chicago Press, pp. 9-40.
Fisher, Irving (1933). "The Debt-Deflation Theory of Great Depressions," Econometrica, vol. 1 (October), pp. 337-57.
Friedman, Milton (1968). "The Role of Monetary Policy," American Economic Review, vol. 58 (March), pp. 1-17.
Hooker, Mark A. (2002). "Are Oil Shocks Inflationary? Asymmetric and Nonlinear Specifications versus Changes in Regime," Journal of Money, Credit and Banking, vol. 34 (May), pp. 540-61.
Krugman, Paul R. (1998). "It's Baaack: Japan's Slump and the Return of the Liquidity Trap," Brookings Papers on Economic Activity, vol. 29 (2), pp. 137-206.
Mishkin, Frederic S. (2007). "The Federal Reserve's Enhanced Communication Strategy and the Science of Monetary Policy," speech delivered to the Undergraduate Economics Association, Massachusetts Institute of Technology, Cambridge, Mass., November 29.
Peneva, Ekaterina V., and Jeremy B. Rudd (2015). "The Passthrough of Labor Costs to Price Inflation (PDF)," Finance and Economics Discussion Series 2015-042. Washington: Board of Governors of the Federal Reserve System, May.
Reifschneider, Dave, William Wascher, and David Wilcox (2015). "Aggregate Supply in the United States: Recent Developments and Implications for the Conduct of Monetary Policy," IMF Economic Review, vol. 63 (1), pp. 71-109.
Reifschneider, David, and John C. Williams (2000). "Three Lessons for Monetary Policy in a Low-Inflation Era," Journal of Money, Credit and Banking, vol. 32 (November), pp. 936-66.
Shiller, Robert J. (1997). "Why Do People Dislike Inflation?" in Christina D. Romer and David H. Romer, eds., Reducing Inflation: Motivation and Strategy. Chicago: University of Chicago Press, pp. 13-65.
Tobin, James (1972). "Inflation and Unemployment," American Economic Review, vol. 62 (March), pp. 1-18.
Van Zandweghe, Willem (forthcoming). "Monetary Policy Shocks and Aggregate Supply (PDF)," Federal Reserve Bank of Kansas City, Economic Review.
Woodford, Michael (2003). Interest and Prices: Foundations of a Theory of Monetary Policy. Princeton, N.J.: Princeton University Press.
Yellen, Janet L. (2013). "Challenges Confronting Monetary Policy," speech delivered at the 2013 National Association for Business Economics Policy Conference, Washington, March 4.
Appendix: The Estimated Inflation Model and Inflation Decomposition Procedure
The inflation model used in the decomposition procedure includes two equations--an identity for the change in the price index for total personal consumption expenditures (PCE) and a simple reduced-form forecasting equation for core PCE inflation.35 The identity is
where  and
and  denote growth rates (expressed as annualized log differences) of total and core PCE prices, respectively;
  and
and  are annualized growth rates for prices of consumer energy goods and services and prices of food and beverages, both expressed relative to core PCE prices; and
  and
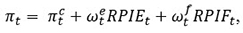
and  are the weights of energy and food in total consumption. The core inflation forecasting equation is

where  is expected long-run inflation;
  denotes the level of resource utilization;
  controls for the effect of changes in the relative price of core imported goods;
  is a white-noise error term; and the coefficients are ordinary least squares estimates obtained using data from 1990:Q1 to 2014:Q4.
For estimation purposes, is approximated using the unemployment rate less the Congressional Budget Office's (CBO) historical series for the long-run natural rate, while is proxied using the median forecasts of long-run PCE or CPI inflation reported in the Survey of Professional Forecasters, with a constant adjustment of 40 basis points prior to 2007 to put the CPI forecasts on a PCE basis. (Prior to 1991:Q4, this series is based on the long-run inflation expectations reported in the Hoey survey.) The relative import price term, , is defined as the annualized growth rate of the price index for core imported goods (defined to exclude petroleum, natural gas, computers, and semiconductors), less the lagged four-quarter change in core PCE inflation, all multiplied by the share of nominal core imported goods in nominal GDP.36
To decompose recent movements in inflation into its various components, the series used in the inflation model--for which data are available only through 2015:Q2 in most cases--are first extended through the end of 2015. In the case of inflation, the extensions are consistent with the medians of FOMC participants' projections for total and core PCE inflation in 2015 that were reported at the press conference following the September FOMC meeting.37 Similarly, over the second half of 2015 is defined to be consistent with the median of FOMC projections for the 2015:Q4 unemployment rate, less the CBO's estimates of the historical path of the long-run natural rate; the CBO's 2015 estimate is almost identical to the median of FOMC participants' most recent projections of the normal longer-run level of the unemployment rate. For changes in the prices of consumer energy and core imports, the 2015:H2 extrapolations are based on regressions of these two series on current and lagged changes in, respectively, crude oil prices and exchange rates. This approach predicts that energy prices should decline at annual rates of about 6 percent in 2015:Q3 and 18 percent in 2015:Q4, while core import prices should fall about 2-1/2 percent at an annual rate in both quarters.38 Food prices are assumed to remain flat at their 2015:Q2 level; this assumption ensures that the combined contribution of food and energy prices to inflation in 2015 is consistent with the median difference between FOMC participants' projections for total and core inflation. Finally, nominal spending shares for food, energy, and core imports are assumed to remain unchanged at their 2015:Q2 levels, and long-run inflation expectations are assumed to remain constant at 2 percent.
After computing historical tracking errors for the two equations of the model, the final step in the decomposition procedure is to run a sequence of counter-factual simulations of the model from 1990:Q1 through 2015:Q4. One by one, each explanatory variable of the model is set to zero and the model is simulated; the resulting difference between actual inflation and its simulated value equals the historical contribution of that particular factor. Importantly, the simulations are all dynamic in that the lagged inflation term in the core inflation equation is set equal to its simulated value in the preceding period, rather than its actual value. As a result, the decompositions incorporate the effects of changes in lagged inflation that are attributable to previous movements in the explanatory variables.
1. See the Federal Open Market Committee's Statement on Longer-Run Goals and Monetary Policy Strategy (PDF), available on the Board's website. Return to text
2. The first jump in energy prices in the 1970s reflected a rise in crude oil prices whose proximate cause was the so-called Arab oil embargo that followed the 1973 Arab-Israeli War; the first jump in food prices was caused by disease and poor harvests combined with low levels of inventories (particularly for grains) in many countries. The second energy price shock resulted from a jump in crude oil prices following the 1978-79 revolution in Iran and subsequent Iraqi invasion; the second food price shock was largely attributable to bad weather and disease. (See Blinder and Rudd, 2013, for an assessment of the effect that these and other special factors--including the imposition and removal of price controls over the 1971-74 period--had on consumer price inflation in the 1970s and 1980s.) Return to text
3. The predicted long-run trend shown here updates an estimate made by Peneva and Rudd (2015), which uses a vector autoregression (VAR) with time-varying parameters and stochastic volatility to compute a stochastic trend for inflation (see that paper for additional details regarding model specification and data definitions). The estimation procedure for the VAR is similar to that used by Clark and Terry (2010), which in turn follows Cogley and Sargent (2005); see also Cogley and others (2010) and Ascari and Sbordone (2014) for related applications. Return to text
4. Trend inflation estimates from univariate statistical models manifest somewhat less stability in recent years; see Clark and Bednar (2015). Return to text
5. In contrast, the FOMC has determined that a number of considerations preclude it from setting a fixed numerical target for the other leg of its dual mandate, maximum employment. As discussed in its Statement on Longer-Run Goals and Monetary Policy Strategy (see note 1), the maximum level of employment is something that is largely determined by nonmonetary factors that affect the structure and dynamics of the labor market. Moreover, the maximum level of employment, the longer-run "natural" rate of unemployment, and other related aspects of the labor market are not directly observable, can change over time, and can only be estimated imprecisely. As a result, views vary about what labor market conditions would be consistent with a normal level of resource utilization. Return to text
6. For a general survey of the costs of high inflation, see Briault (1995). English (1999) discusses costs associated with an increased need for cash management. For a discussion of costs that arise through interactions of inflation with the tax system, see Feldstein (1997, 1999) and Cohen and others (1999). Finally, high inflation may adversely affect the economy's allocation of resources by increasing the magnitude of misalignments in relative prices that result because firms do not continually adjust all of their prices; for a discussion of such costs in the context of the new-Keynesian model of inflation, see Ascari and Sbordone (2014). Return to text
7. More broadly, if inflation evolves in an unpredictable manner over many years, then even financially sophisticated households and firms may not be able to avoid significant forecasting errors with their attendant costs. Such costs can arise in a wide variety of situations; for instance, any firm, union, or other entity that engages in a multiyear nominal contract may be adversely affected by unexpected increases or decreases in inflation, although those on the other side of the contract might benefit. Return to text
8. For more on this survey, see Shiller (1997). Return to text
9. Because of the inconvenience of storing and protecting very large quantities of currency, some firms are willing to pay a premium to hold short-term government securities or bank deposits instead. As a result, several foreign central banks have found it possible to push nominal short-term interest rates somewhat below zero. Return to text
10. For example, Curdia and others (2014) estimate that stabilizing the economy during the last recession would have required lowering the real federal funds rate to negative 10 percent for a time; by comparison, the average value of the real federal funds has been only negative 1-1/4 percent since early 2009. Of course, the FOMC was able to use other policy tools, such as large-scale asset purchases, to put additional downward pressure on long-term interest rates after the nominal funds rate was cut to near zero; however, those policies had potential costs and risks that made them an imperfect substitute for traditional interest rate policy. See Krugman (1998), Reifschneider and Williams (2000), and Eggertsson and Woodford (2003) for discussions of the effects that low inflation and the zero lower bound on nominal interest rates have on a central bank's ability to stimulate the economy during economic downturns. In addition, see English, Lopez-Salido, and Tetlow (2015) and Engen, Laubach, and Reifschneider (2015) for model-based analyses of the effectiveness of the Federal Reserve's large-scale asset purchases and forward guidance in mitigating the effects of the zero lower bound. Finally, for a discussion of the costs and benefits of employing large scale asset purchases, see Bernanke (2012) and Yellen (2013). Return to text
11. For a further discussion of this point, see Mishkin (2007). Return to text
12. See Fisher (1933) for an early discussion of debt deflation and its effects on the economy. Return to text
13. Very low inflation also can result in chronically higher unemployment by closing off an important way in which the labor market can respond to adverse shocks. In sectors where productivity is lagging or demand is slowing, declines in real wages might be necessary to avoid even worse outcomes, such as layoffs. For various reasons, however, employers often try to avoid nominal wage cuts. (Bewley (1999) suggests a number of reasons that firms find cutting nominal wages difficult, including the effect that such cuts have on employee morale. Inflation is therefore often said to "grease the wheels of the labor market" because it permits these required adjustments in real wages to occur through a combination of unchanged nominal wages and rising prices.) But when inflation falls to a very low level, this passive approach to wage reductions may no longer be viable for many firms, causing relatively more of the burden of adjustment to fall on employment. Return to text
14. Blanchard, Dell'Ariccia and Mauro (2010), among others, have recently suggested that central banks should consider raising their inflation targets, on the grounds that conditions since the financial crisis have demonstrated that monetary policy is more constrained by the effective lower bound (ELB) on nominal interest rates than was originally estimated. Ball (2013), for example, has proposed 4 percent as a more appropriate target for the FOMC. While it is certainly true that earlier analyses of ELB costs significantly underestimated the likelihood of severe recessions and slow recoveries of the sort recently experienced in the United States and elsewhere (see Chung and others, 2012), it is also the case that these analyses did not take into account central banks' ability to use large-scale asset purchases and other unconventional tools to mitigate the costs arising from the ELB constraint. In addition, it is not obvious that a modestly higher target rate of inflation would have greatly increased the Federal Reserve's ability to support real activity in the special conditions that prevailed in the wake of the financial crisis, when some of the channels through which lower interest rates stimulate aggregate spending, such as housing construction, were probably attenuated. Beyond these tactical considerations, however, changing the FOMC's long-run inflation objective would risk calling into question the FOMC's commitment to stabilizing inflation at any level because it might lead people to suspect that the target could be changed opportunistically in the future. If so, then the key benefits of stable inflation expectations discussed below--an increased ability of monetary policy to fight economic downturns without sacrificing price stability--might be lost. Moreover, if the purpose of a higher inflation target is to increase the ability of central banks to deal with the severe recessions that follow financial crises, then a better strategic approach might be to rely on more vigorous supervisory and macroprudential policies to reduce the likelihood of such events. Finally, targeting inflation in the vicinity of 4 percent or higher would stretch the meaning of "stable prices" in the Federal Reserve Act. Return to text
15. For a more complete listing of the Federal Reserve's policy actions in recent years, see "The Federal Reserve's Response to the Financial Crisis and Action to Foster Maximum Employment and Price Stability," a webpage available on the Board's website. Also see Engen, Laubach, and Reifschneider (2015) for an analysis of the combined macroeconomic effects of the FOMC's asset purchases and guidance concerning the future path of the federal funds rate. Return to text
16. Several other approaches are commonly used to abstract from the short-term volatility of overall inflation and thereby better discern its medium-term direction. For example, one procedure removes the components of the total PCE price index with the largest or smallest price changes before computing the average price change, yielding the "trimmed mean" PCE index; another uses the median price change in a given period, rather than the mean change, to represent the overall inflation rate. In practice, simply using core inflation does about as well in predicting overall inflation over the coming year and beyond as these alternative procedures (see Detmeister, 2011, 2012). Return to text
17. Another input cost that can affect core inflation is the price of energy; in recent decades, however, the pass-through of energy price changes to core inflation appears much smaller than in previous periods (see Hooker, 2002; Clark and Terry, 2010). Return to text
18. Some of these idiosyncratic shocks are related to identifiable factors, such as changes in Medicare reimbursement rates or movements in the (imputed) price of holding a checking account. (Both of these factors are included in the services component of the PCE price index, but not the consumer price index (CPI).) However, not all idiosyncratic shocks can be reliably traced to specific factors, as a significant fraction represents unpredictable "noise." Return to text
19. Most theoretical versions of the Phillips curve suggest that inflation should depend on short-run inflation expectations, but, as an empirical matter, measures of long-run expectations appear to explain the data better. Return to text
20. See Clark and Davig (2008); see also Faust and Wright (2013), who make a related point in the context of inflation forecasting. Note that the question about expected inflation in the University of Michigan Surveys of Consumers is not phrased in terms of a specific measure of prices, so its level--as opposed to its contour--cannot be directly compared with a particular measure of inflation such as the change in the PCE price index. Return to text
21. See Tobin (1972) and Friedman (1968) for early discussions of the theory underpinning the expectations-augmented Phillips curve. Theoretical descriptions of the inflation process remain an active area of research in economics. In recent years, many economic theorists have used a so-called new-Keynesian framework--in which optimizing agents are assumed to face constraints on price or wage setting in the form of adjustment costs or explicit nominal contracts--to model inflation dynamics (see Woodford, 2003, chapter 3, for a textbook treatment). Although these new-Keynesian inflation models can differ importantly in their specifics, they all tend to assign a central role to inflation expectations and resource utilization as drivers of inflation dynamics. Return to text
22. In this exercise, we ignore any inflation effects that might arise because of shifts in resource utilization induced by the change in import prices, which are expressed relative to core prices. Return to text
23. An expectations-augmented Phillips curve in which expectations of inflation are assumed to eventually respond one-for-one to actual past inflation is typically referred to as an accelerationist Phillips curve. Return to text
24. Qualitatively similar results obtain in fully specified structural models with rational expectations--including the FRB/US, EDO, and SIGMA models maintained at the Federal Reserve Board--in which the long-term behavior of inflation and inflation expectations is governed by the central bank's (fixed) inflation objective. Return to text
25. In evaluating the potential implications of this decline for expected PCE inflation, one also needs to keep in mind that TIPS are indexed to the CPI. CPI inflation generally runs a few tenths of a percentage point higher than PCE inflation, though that differential can vary materially over time. Return to text
26. Another complication is that we do not know whose expectations "matter" for determining inflation. Inflation expectations of professional forecasters (such as those collected in the Blue Chip Economic Indicators, the Survey of Professional Forecasters, or the Survey of Primary Dealers) or inflation expectations derived from asset prices probably capture the views of participants in financial markets but need not reflect the views of households and firms more broadly. As an empirical matter, the little information available on the longer-term inflation expectations of firms from the Atlanta Federal Reserve Business Inflation Expectations survey suggests that firms' expectations more closely resemble expectations from the University of Michigan Surveys of Consumers than the expectations of professional forecasters. Similarly, preliminary data from a New Zealand study suggests that inflation forecasts of firms are much more similar to those of households than those of professional forecasters (see Coibion and Gorodnichenko, 2015). Return to text
27. D'Amico, Kim, and Wei (2014) examine a number of models that use TIPS yields to back out expected inflation estimates. The best-fitting models show only a small decline in longer-term inflation expectations since 2005. Return to text
28. My interpretation of the historical evidence is that long-run inflation expectations become anchored at a particular level only after a central bank succeeds in keeping actual inflation near some target level for many years. For that reason, I am somewhat skeptical about the actual effectiveness of any monetary policy that relies primarily on the central bank's theoretical ability to influence the public's inflation expectations directly by simply announcing that it will pursue a different inflation goal in the future. Although such announcements might potentially persuade some financial market participants and professional forecasters to shift their expectations, other members of the public are probably much less likely to do so. Hence, actual inflation would probably be affected only after the central bank has had sufficient time to concretely demonstrate its sustained commitment and ability to generate a new norm for the average level of inflation and the behavior of monetary policy--a process that might take years, based on U.S. experience. Consistent with my assessment that announcements alone are not enough, Bernanke and others (1999) found no evidence across a number of countries that the initial disinflation which follows the adoption of inflation targeting is any less costly than disinflations carried out under alternative monetary regimes. Return to text
29. Some might be surprised that the preceding discussion of inflation determinants makes no mention of labor costs. In the past, wages provided a good empirical indicator of the future direction of price inflation; indeed, the presence of a so-called wage-price spiral--in which higher price inflation led workers to push for higher wage growth, thereby in turn leading to even faster price increases as firms' labor costs accelerated--was often invoked to explain the inflationary dynamics of the 1970s. The wage-price spiral no longer seems to provide a useful description of the U.S. inflation process. In fact, some evidence suggests that, like inflation, the rate of growth of labor costs is now characterized by a stable long-run trend; again, a likely explanation for this empirical finding is the improved anchoring of long-term inflation expectations. (See Peneva and Rudd, 2015, for some suggestive evidence along these lines.) More generally, movements in labor costs no longer appear to be an especially good guide to future price movements. (This development does not imply that wage developments carry no useful information: Because wage growth is influenced by labor market slack, observed movements in compensation gains can provide an indication of how close the economy is to full employment.) Return to text
30. For a technical explanation of the procedure used to produce this decomposition, see the appendix. In the decomposition procedure, movements in core inflation affect headline inflation one-for-one; as a result, the contributions of food and energy price inflation are defined as each component's price change relative to the core, weighted by its share in total nominal consumer spending. (Note that the "other" category includes the effects of changes in food prices.) The estimated contribution of movements in import prices is also computed relative to core inflation; thus, if import prices are rising at the same rate as core inflation, they have no estimated effect on the shortfall of overall inflation from 2 percent. In addition, the decomposition takes account of lags in the adjustment of core inflation to movements in resource utilization and other factors. Return to text
31. As discussed later, the current difference between the unemployment rate and its normal longer-run level likely understates the actual amount of slack that remains in the labor market. If so, the estimates reported in figure 8 somewhat understate the contribution of slack to the current shortfall of inflation from 2 percent and, correspondingly, overstate the contribution from other factors. For example, if the standard unemployment gap currently understates the true level of slack by 1/2 percentage point, then the contribution of slack to this year's inflation shortfall is roughly 0.1 percentage point larger than the estimate reported in figure 8. Return to text
32. For a further discussion of the current level of resource utilization, see the Federal Reserve Board's most recent Monetary Policy Report, dated July 15, 2015. Return to text
33. For a discussion of the supply-side damage that has occurred since 2007 and the potential benefits of partially reversing it through more accommodative monetary policy, see Reifschneider, Wascher, and Wilcox (2015) and Van Zandweghe (forthcoming). Return to text
34. In addition, we cannot count on expectations remaining anchored if the Federal Reserve were to permit actual inflation to continue to run noticeably below its announced objective after the real economy has substantially recovered. Return to text
35. This appendix was revised on December 17, 2015, to provide additional information on the definition of core import inflation and its implications for the longer-run rate of unemployment consistent with stable inflation. In addition, the original version of the appendix incorrectly reported that the adjustment factor used to convert historical readings on expected long-run inflation from a CPI basis to a PCE basis was 50 basis points. Return to text
36. This measure of core import prices is constructed by Board staff using published and unpublished data provided by the Bureau of Economic Analysis and the Bureau of Labor Statistics. Return to text
37. The information on participants' forecasts provided at the September 17, 2015 press conference is available on the Board's website at http://www.federalreserve.gov/monetarypolicy/files/fomcprojtabl20150917.pdf. Return to text
38. The level of core import prices, expressed relative to core consumer prices, displayed a modest downward trend from 1990 through 2001 but since then has displayed little persistent trend, particularly if one controls for shifts related to recent changes in the real exchange rate. If the post-2001 pattern persists in coming years, then would be expected to converge to zero within a few quarters and core PCE inflation to converge to 2 percent within two or three years, assuming that the unemployment rate remains close to 5 percent (the CBO estimate of the natural rate) and there are no further shocks to the exchange rate and other factors. If, however, core import prices were expected to resume trending down relative to consumer prices, then the model as specified would imply that the unemployment rate consistent with inflation stabilizing at 2 percent in the longer run would be somewhat lower than 5 percent. Return to text