FEDS Notes
July 08, 2022
Declining Affordability and Home Purchase Borrowing by Lower Income Households
Affordability pressures
The COVID-19 era has experienced an unprecedented surge in home values. In the two years between March of 2020 and March of 2022, the S&P/Case Shiller U.S. National Home Price Index grew approximately 37 percent in nominal terms.1 For much of 2020 and 2021, the purchasing power of home buyers was buoyed by record-low mortgage interest rates, offsetting the higher prices. In early 2022, however, mortgage rates rose. Consequently, the required average monthly payment associated with newly originated purchase mortgages shot up to new heights, approximately 50 percent above their pre-pandemic levels (see Figure 1).
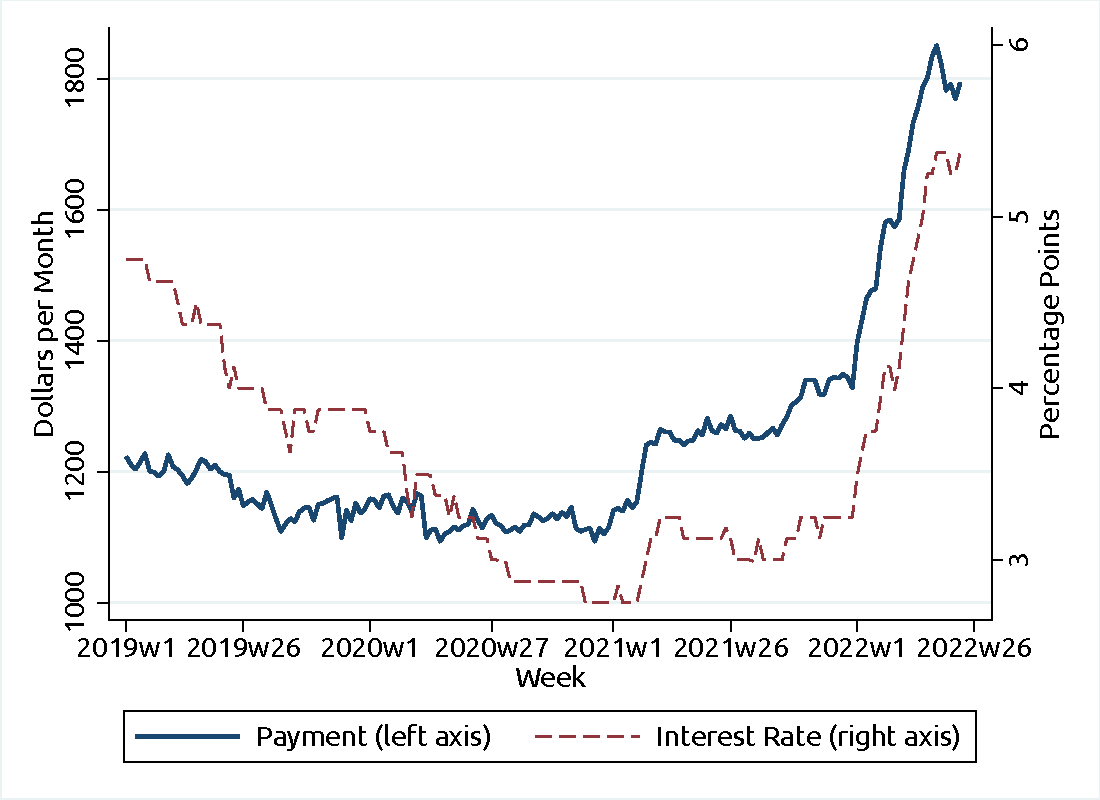
Note: Figure shows the median monthly scheduled principal and interest payments, and median interest rate, on home purchase mortgages for owner-occupied properties by week of rate lock.
Source: Optimal Blue LLC, Optimal Blue Mortgage Price Data.
Under these higher required payments, many potential home buyers would struggle to afford a home or qualify for a mortgage. Lenders (often following the guidelines of the government sponsored enterprises Fannie Mae and Freddie Mac, or those of the Federal Housing Administration) impose maximums on the ratio of a borrower's debt service payments to their income (DTI ratio).2 As required payments rise, mortgages will increasingly be available only to households with higher incomes.
Home purchase lending to lower income borrowers
Data recently collected under the Home Mortgage Disclosure Act (HMDA) reveal that home purchase lending to lower income borrowers has fallen dramatically in 2022. The Census Bureau estimates that the median household income in 2020 was about $68 thousand (Shrider et al, 2021). The solid red line in Figure 2 plots the fraction of originated home purchase mortgages to borrowers with an income below this median by the week of loan application.3
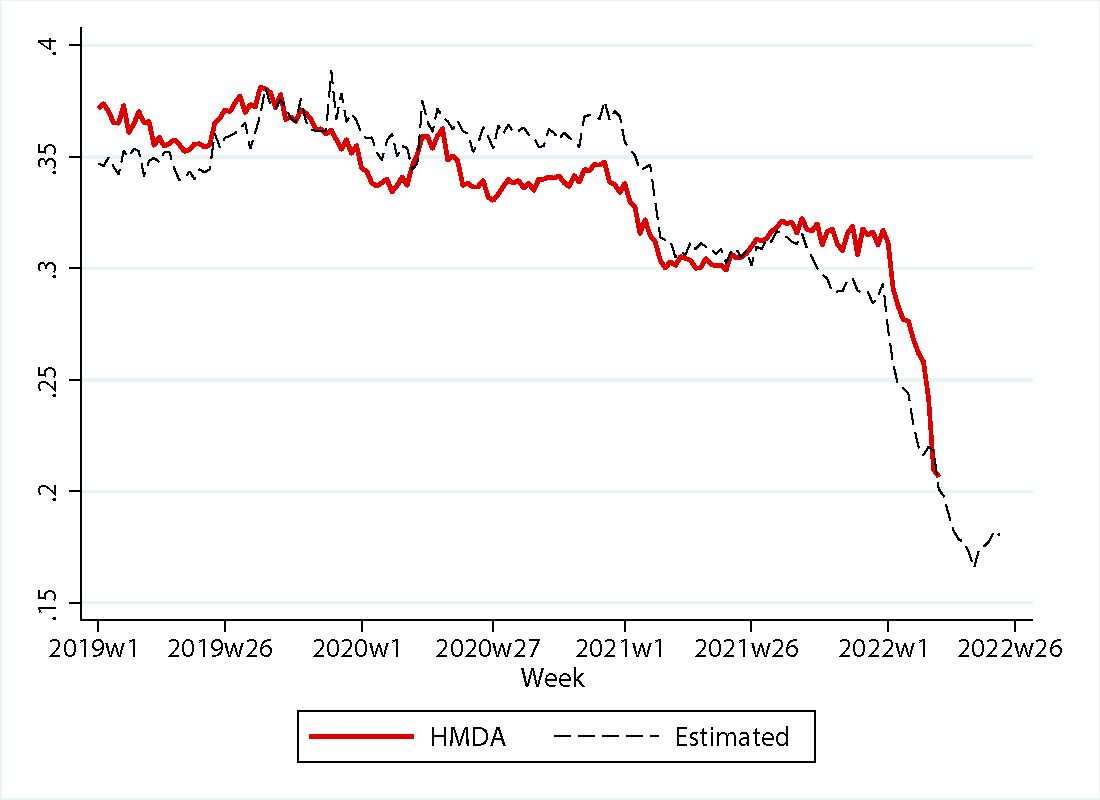
Note: Figure shows the percentage of home purchase loans going to borrowers with reported annual incomes below $68 thousand. The solid red line represents data from HMDA, the black dashed line represents author's estimates.
Source: Home Mortgage Disclosure Act Data, Optimal Blue LLC, Optimal Blue Mortgage Price Data.
A drop in the fraction of borrowers with a below-average income in 2022, coinciding with the rise in mortgage rates, is quite evident from the figure. Borrowers earning less than $68 thousand annually accounted for over 35 percent of home purchase loans prior to the pandemic. By March of 2022, they accounted for only about 20 percent of such loans.
Timelier data from mortgage rate locks suggest the decline in lending to below-average income borrowers continued through at least May of 2022. The rate locks data come from Optimal Blue and provide detailed underwriting information on mortgage borrowers whose rate is locked through the Optimal Blue platform.4 The locks data do not include borrower income, as the HMDA data do, but include required monthly principal and interest payments and the DTI ratio. The probability a borrower is of below-average income was calculated for each combination of monthly payments and DTI ratio using HMDA data from 2021, and the estimates applied to the payments and DTI ratio data from Optimal Blue to produce a weekly estimate of the fraction of home purchase rate locks going to below-average income borrowers.
The estimated fraction of below-average income borrowers from this procedure are shown in Figure 2 alongside the HMDA data, by week of rate lock. As can be seen, the estimates provide a close approximation to the true HMDA data over the sample period in which they overlap. The estimates suggest a further decline in the fraction of home purchase mortgages going to lower-income households, from about 20 percent in mid-March to 17 percent in mid-May of 2022.
Implications for home buying demand
Housing market data available as of June 2022 suggest the demand for homes continues to be very high, as prices rise rapidly and homes put on the market sell quickly. However, some indicators are recently showing signs of cooling. For example, the National Association of Realtors reports that the months of supply of existing homes for sale ticked up in April (albeit only to 2.2 months, a level that is extremely low by historical standards). As more and more households get priced out of the market, the cooling trend may become more pronounced.
Works Cited
Shrider, Emily A., Melissa Kollar, Frances Chen, and Jessica Semega, U.S. Census Bureau, Current Population Reports, P60-273, Income and Poverty in the United States: 2020, U.S. Government Publishing Office, Washington, DC, September 2021
1. Source: S&P Dow Jones Indices LLC, S&P/Case-Shiller U.S. National Home Price Index [CSUSHPINSA], retrieved from FRED, Federal Reserve Bank of St. Louis; https://fred.stlouisfed.org/series/CSUSHPINSA, June 1, 2022. Return to text
2. The DTI ratio includes payments on both the mortgage and other debts in the numerator. This ratio is reported in both the data sources used in this analysis. Return to text
3. Beginning in 2020, the largest mortgage lenders (those that received at least 60,000 applications in the prior year) have been required to report their loan application data at a quarterly frequency. Data is shown for 2019 through the first quarter of 2022, but in all years the sample is limited to lenders who reported quarterly data in 2022 to avoid changes in the sample composition at year's end. Data for 2022 have not yet undergone a full set of quality checks, and so may contain more errors than are typically found in the annually released HMDA data. Applications received in the last two weeks of March 2022 are omitted, as very few loans go from application to origination within two weeks and the reported data (which consists of loans originated as of March 31, 2022) becomes extremely unrepresentative. The sample is also limited to first lien purchase mortgages for owner-occupied, single family, site-built homes. Return to text
4. The statistics derived from the Optimal Blue locks data shown Figures 1 and 2 of this note are aggregated and anonymized, and do not contain lender or customer identities or complete rate sheets. Return to text
Ringo, Daniel (2022). "Declining Affordability and Home Purchase Borrowing by Lower Income Households," FEDS Notes. Washington: Board of Governors of the Federal Reserve System, July 8, 2022, https://doi.org/10.17016/2380-7172.3160.
Disclaimer: FEDS Notes are articles in which Board staff offer their own views and present analysis on a range of topics in economics and finance. These articles are shorter and less technically oriented than FEDS Working Papers and IFDP papers.