FEDS Notes
October 21, 2020
The Effects of the COVID-19 Shutdown on the Consumer Credit Card Market: Revolvers versus Transactors
1 Introduction
The consumer credit card market has experienced dramatic, unprecedented changes in the wake of the COVID-19 shutdown of the U.S. economy. Revolving credit in the G.19 Consumer Credit statistical release fell by an annualized rate of 32 percent in the second quarter of 2020.2 The 65 percent April plunge is the largest since the Federal Reserve began collecting data on revolving credit in 1968 and draws no comparison in the history of this series. Credit cards have both a transaction function—the ability to make purchases using the card, with payment due after the statement closes—and a credit function—the ability to revolve a balance and not fully pay it each month. Therefore, the reduction in revolving credit can be due to one or both of the following factors: borrowers reducing their credit card purchase volume and borrowers paying down their revolving balances.3 The distinction between transaction demand and credit demand is important to evaluate the effects of the shutdown, as it has bearing on overall consumption and the financial well-being of consumers. Moreover, because transaction demand is less likely to respond to lending standards and credit supply changes, the distinction between transaction and credit demand can shed light on the role of tighter lending standards in the decline of credit card balances. The G.19 data alone do not allow these factors to be distinguished.
In this note, we use account-level supervisory data to analyze these dramatic changes in credit card balances in greater detail. We show that an enormous plunge in purchase volume was the main driver of the decline in revolving consumer credit in the first phase of the COVID-19 pandemic, with—for example—purchase volume falling by a monthly rate of almost 25 percent from March to April. In contrast, revolving balances on credit card accounts (that is, balances outstanding from the previous month not paid off in the current month) stayed approximately flat in April. In the second phase, as states and cities lifted the initial stay-at-home orders in May and June, purchase volume increased at a monthly rate of almost 10 percent in May and June. At the same time, revolving balances plunged in May and June, in part because previous months' balances outstanding contracted and in part because of higher payments, amid the implementation of stimulus payments and other government actions that boosted people's incomes.
We further compare credit card accounts with and without regularly revolving balances. This distinction is important because whether borrowers use credit cards primarily for their transaction or credit functions helps explain spending patterns during the pandemic. While the April decline in purchase volume was broad based, the rebound was driven by borrowers with revolving balances. Revolvers also paid down a higher share of their balances in May and June, likely supported by the stimulus payments implemented as part of the Coronavirus Aid, Relief, and Economic Security (CARES) Act.4 Indeed, the drops in revolving balances in May and June were associated with the lowest share of borrowers with revolving balances since the data were first collected in 2013, indicating that an unusually large fraction of people paid their credit card balances down completely in these months.
Our findings on the importance of categorizing borrowers based on their credit use add to a growing literature that has started looking at the effects of the COVID-19 shutdown on consumption and spending using credit card data. Cox et al. (2020) use detailed credit and debit card transaction and bank account data to study changes in spending by income quartile and by credit score. Chetty et al. (2020) find initial lower spending from high-income individuals using transaction-level credit card data. This reduced spending eventually results in lower incomes and decreased spending by low-wage earners as well. Baker et al. (2020) study the effects of the CARES Act using transaction-level data and bank account information for low-income individuals. They find the largest declines in spending from individuals with higher declines in income. Consumption responses to the stimulus are significant and depend on income levels, income declines, and family liquidity. Finally, Horvath, Kay, and Wix (2020) use supervisory data to study the initial response in credit card activity, also by credit score.
2 Data
We use account-level credit card data from the Capital Assessments and Stress Testing Report (FR Y-14M). The Y-14M data provide information on all credit card accounts for the largest banking organizations (that is, those involved with stress testing).5 The data include all of the largest credit card issuers, covering about 73 percent of credit card balances reported in the Call Reports, which reflect total credit card outstanding balances at banks, as of the end of 2019.6 Our analysis is based on a 1 percent random sample of general purpose accounts from January 2019 through June 2020, which results in more than 50 million observations representing more than 3.5 million unique consumer credit card accounts.7
3 Analysis
We start by examining the declines in overall credit card balances. Figure 1 shows the annual rate of change in credit card balances outstanding, with and without seasonal adjustment, and compares it with the change in revolving debt in the Federal Reserve's G.19 statistical release, which is reported at a seasonally adjusted annual rate (s.a.a.r.). Credit card outstanding balances in our Y-14M sample plummeted 71 percent (s.a.a.r.) in April 2020, 35 percent in May, and 15 percent in June. These declines are consistent with the 65 percent, 29 percent, and 3 percent declines in April, May, and June, respectively, in total revolving credit reported in the G.19.8 Figure 1 also shows that seasonal adjustment for credit card data, though generally important, does not affect the magnitudes of the declines in April and May. Throughout the rest of this note, we do not seasonally adjust our Y-14M data, but results are very similar if we do.
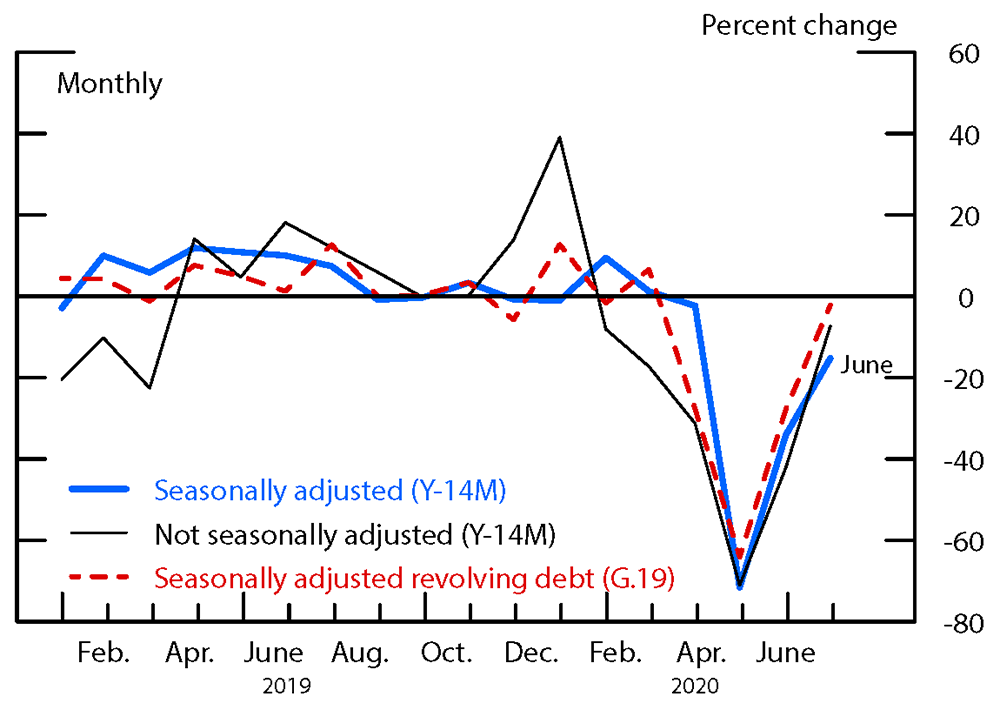
The percent change is at an annual rate. Percent changes in July and August 2019 are interpolated because of a data issue.
Source: FR-Y14M.
We next decompose credit card balances outstanding into revolving balances (defined as the previous statement balance not paid off in the current statement month), net new purchase volume (new consumer purchases less any pre-payments of these purchases), and other charges (fees, finance charges, refunds, and other charges that post to the borrower's account in the statement month).9 As figure 2 shows, total credit card balances outstanding dropped $36 billion in April and a further $20 billion in May and $13 billion in June. Net purchase volume fell $33 billion (monthly rate of 25 percent) in April and rebounded $8 billion (8 percent) and $11 billion (10 percent) in May and June, respectively, as many states lifted stay-at-home orders and economic activity began to resume.10 In contrast, revolving balances remained almost flat in April and fell $18 billion in each of May and June.11 Thus, on balance, the drop in purchase volume accounts for almost all of the decline in total credit card balances in April, whereas the drop in revolving balances accounts for most of the declines in May and June. This decline in revolving balances is by far the largest observed in the data. Consistent with this decline in revolving balances, the share of accounts with revolving balances fell in May and June to below 44 percent, the lowest level since the data were first collected, as an unusually large fraction of consumers fully paid down their balances.
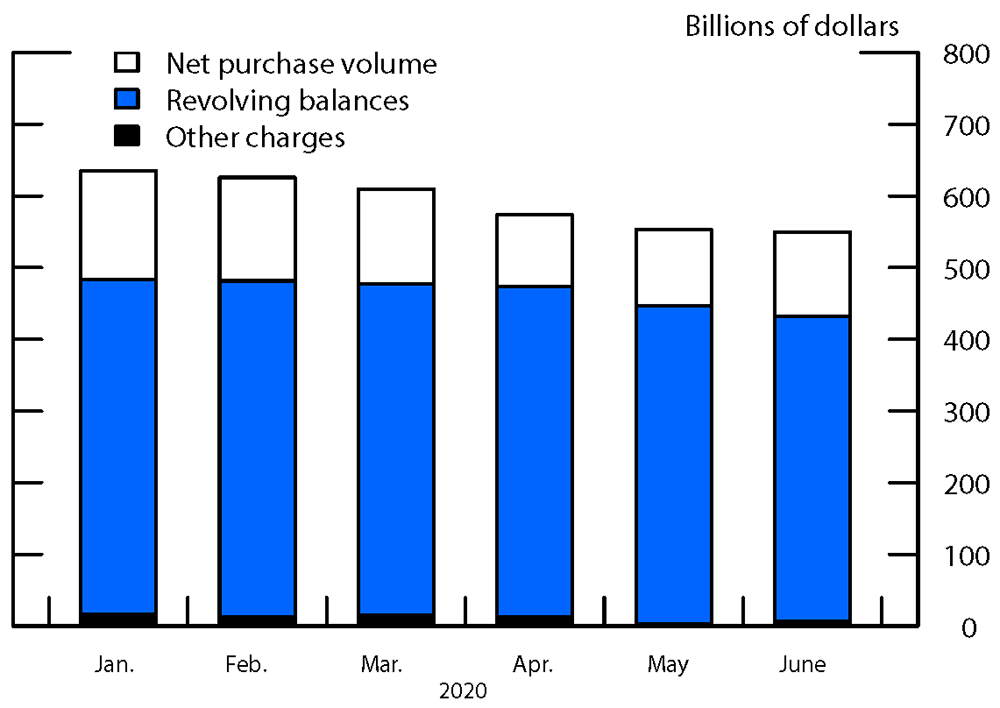
Note: Net purchase volume is new consumer purchases using credit cards less any prepayment of these purchases. Revolving balance is the previous statement balance minus any payments. Other charges are finance charges, fees, and other charges posted to the account.
Source: FR-Y14M.
3.1 Revolver and Transactor Accounts
Next, we separate credit card accounts into three groups based on how the cards are used over the previous 12 months. We define transactor accounts as credit card accounts that did not revolve a balance over the past 12 months; light revolver accounts as those that revolved a balance fewer than 6 months out of 12; and heavy revolver accounts as those that revolved a balance more than 6 months of the past 12.12 Approximately 30 percent of accounts in our data set are transactors, 30 percent are light revolvers, and 40 percent are heavy revolvers.13 Throughout this note, we refer to accounts by their type: transactors, light revolvers, and heavy revolvers.
Transactor accounts correspond to borrowers with higher incomes, higher credit scores, and lower credit card utilization rates than revolver accounts. For holders of transactor accounts, the median income is $65,000, the median credit score is 804, and the utilization rate is about 8 percent as of December 2019. For holders of light (heavy) revolver accounts, the median income is $63,000 ($55,000), the median credit score is 783 (703), and the utilization rate is 20 percent (58 percent) as of December 2019. Note that for owners all three categories of credit card accounts in the Y-14M data, median credit scores are relatively high. Although holders of heavy revolver accounts tend to have lower credit scores than holders of accounts in the other two categories, more than 40 percent of heavy revolver accounts belong to borrowers with prime credit scores.14
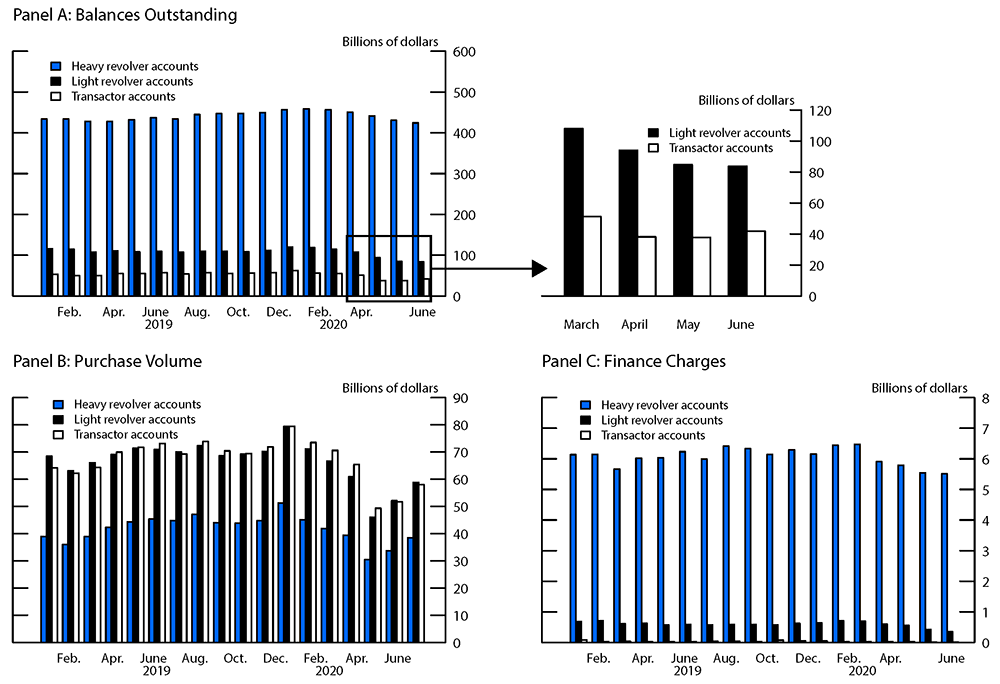
Not surprisingly, heavy revolvers account for approximately three-fourths of balances during our sample period, whereas transactors account for the largest share of purchase volume (see panels A and B of figure 3). As of May 2020, 78 percent and 15 percent of balances belonged to heavy and light revolvers, respectively. By contrast, transactors, who account for about 7 percent of balances, were responsible for almost 40 percent of the purchase volume. In comparison, light revolvers accounted for about 35 percent and heavy revolvers accounted for less than 25 percent of purchase volume.15 Panel C of figure 3 shows that heavy revolvers also account for more than 85 percent of finance charges paid, consistent with their higher levels of balances.
Source: FR-Y14M.
3.2 Total Balances and Purchase Volume
Panels A and B of figure 3 show the trends in balances outstanding and purchase volume among the three types of accounts. Balances for heavy and light revolvers declined sharply in both April and May and continued to decrease slightly in June of 2020. By contrast, balances for transactors declined in April, remained approximately flat in May, and increased in June. The declines in credit card purchase volume in April were broad based, affecting all three categories of borrowers, and appear to be the main driver of the decrease in April balances. That month, purchase volume declined $16 billion (25 percent at a monthly rate), $14 billion (25 percent), and $9 billion (23 percent) for transactors, light revolvers, and heavy revolvers, respectively.16 At the same time, total balances decreased $13 billion, $14 billion, and $9 billion, respectively, for the three categories, almost exactly as much as the declines in purchase volume.
In May and June, purchase volume recovered somewhat, but balances continued to decline, driven by a decrease in revolving balances, as we discuss in the next section. The May rebound in purchase volume was somewhat uneven among the three categories of credit card accounts; purchase volume increased $2 billion (5 percent), $6 billion (13 percent), and $3 billion (11 percent) for transactors, light revolvers, and heavy revolvers, respectively, in May. That said, as consumer expenditures continued to recover in June, transactor purchase volume grew robustly at 12 percent, compared with the continued growth of 13 percent and 14 percent for light and heavy revolvers.
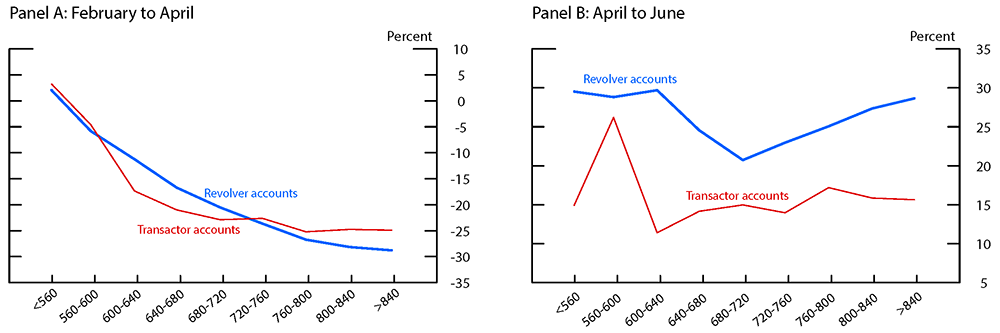
Despite this convergence in June, the trends in purchase volume growth differed between transactors and revolvers throughout the pandemic. Figure 4 plots the growth in average purchase volume from February to April (panel A) and April to June (panel B) for transactor accounts (red line) and revolver accounts (blue line), by income bin. We aggregate across heavy and light revolvers, as the trends in these two groups are similar and distinct from that of transactors. Figure 4 highlights three important points. First, as previous analysis has noted, purchase volume dropped more among higher-income borrowers during the pandemic (Farrell et al, 2020a; Cox et al, 2020). The downward slopes in both the blue and red lines of panel A indicate this drop. Despite the positive growth in purchase volume from April to June, the total purchase volume growth from February to June remains lower among higher-income borrowers.
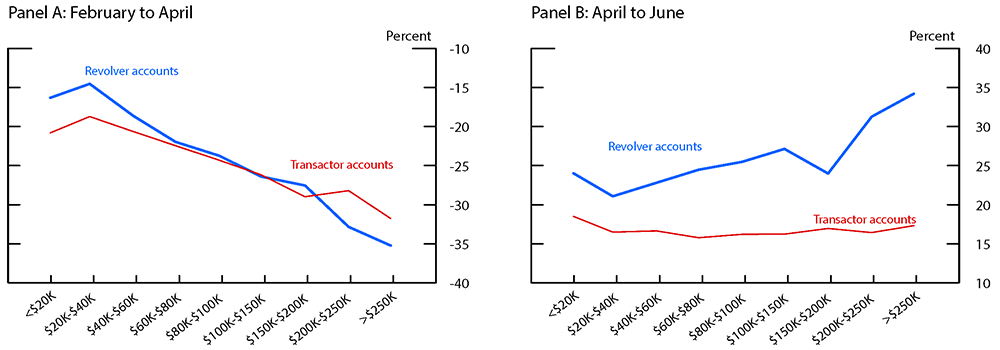
Panel A - Note: Growth in average purchase volume from February to April. Income is measured as of January 2020.
Panel B - Note: Growth in average purchase volume from April to June. Income is measured as of January 2020.
Source: FR-Y14M.
Second, transactor and revolver accounts experienced relatively similar declines in purchase volume from February to April, with some exceptions at the tails of the income distribution. Moreover, among low-income borrowers, purchase volume growth for revolvers was higher than that for transactors, whereas purchase volume for revolvers was lower than that for transactors among high-income borrowers. This finding suggests that low- and high-income borrowers who revolve may use their revolving balances differently. Low-income borrowers who carry a balance may use their balances to fund essential purchases such as food, spending on which did not fall by as much during the first few months of the pandemic. In contrast, high-income borrowers who carry a balance may revolve balances to fund discretionary purchases, a category for which spending plummeted as the pandemic began.
Third, from April to June, purchase volume growth was higher for revolvers than for transactors and higher still among high-income borrowers. It is beyond the scope of this note to resolve why this pattern holds. That said, because the initial decline in spending lowered credit utilization, some borrowers who revolve, particularly high-income consumers, may have used this extra liquidity to spend more as states began to reopen (Gross and Souleles, 2002).
The higher purchase volume growth among revolvers mitigates concerns that the overall decline in credit card balances is due to tighter lending standards during the pandemic. Our findings indicate that lending standards are not a major driver of the decrease in revolving balances because revolver accounts are likely to be more responsive to changes in lending standards than transactor accounts.
Figure 5 repeats the analysis of figure 4 by credit score bin, and the patterns are generally the same.17 Again, previous literature has noted the lower spending among prime borrowers, apparent as the downward slopes of both lines in panel A (Stolba, 2020; Horvath, Kay, and Wix, 2020). That said, purchase volume growth from April to June, within each credit score bin, is higher among revolvers than among transactors as panel B of Figure 5 shows.
Panel A - Note: Growth in average purchase volume from February to April. Credit score is measured as of January 2020.
Panel B - Note: Growth in average purchase volume from April to June. Credit score is measured as of January 2020.
Source: FR-Y14M.
3.3 Revolving Balances and Payments
Whereas the declines in purchase volume neatly accounted for the declines in balances in April, balances in May continued to fall despite the rising purchase volume, driven by a reduction of more than $9 billion each in revolving balances for light and heavy revolvers.18 In June, as purchase volume continued to increase across all three categories of accounts, transactor balances increased $4 billion. Balances for heavy and light revolvers, by contrast, continued to decrease in June, though at a much slower pace, driven by declines in revolving balances of $7 billion and $6 billion, respectively. Two main factors appear to drive this reduction in revolving balances: reduced purchase volume and increased payments.
First, revolving balances in a month are composed of the previous month's balances that are not paid down. Before the pandemic, each month, heavy (light) revolvers paid off approximately 13 percent (54 percent) of their previous balances and added approximately 11 percent (54 percent) of their previous balances in purchase volume. Thus, if the paydown rate in May remained constant, the contraction in balances in April, due to the plunge in April purchase volume, would lead to a decline in revolving balances in May. Similarly, although May purchase volume began to recover, it remained far below pre-pandemic levels, leading to a continued contraction in balances in May and thus to a decline in revolving balances in June.
Second, payment behavior of revolvers did not remain constant throughout the early months of the pandemic. As panel A of figure 6 shows, the share of the previous month's balances paid down beyond the minimum due increased sharply in May after dropping in April and continued increasing, though more moderately, in June. Note that for light revolvers, the higher paydowns are due to payments holding up as balances decline, whereas for heavy revolvers, payments increased slightly in May and June. In both cases, these paydowns led to record levels of accounts fully paying off their revolving balances. By June, less than 44 percent of accounts had a revolving balance, a historical low. The share of heavy revolvers who fully paid off their revolving balances in a month jumped to 8.5 percent in June, a historical high.19
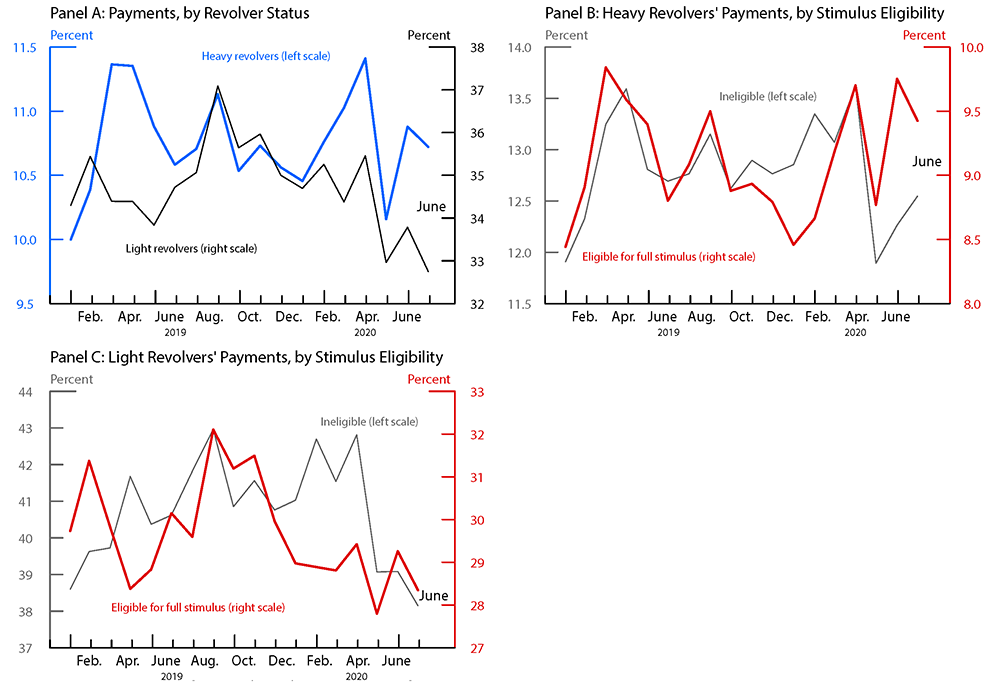
Payments in excess of minimum due are shown as a percentage of previous statement balances for borrowers with a revolving balance in the previous month. Eligible for full stimulus are borrowers with reported individual (household) income of less than $75,000 ($150,000). Ineligible are borrowers with individual (household) income of more than $100,000 ($200,000).
Source: FR-Y14M.
The higher paydowns of existing debt during the pandemic is consistent with evidence on the role of government responses to the pandemic in supporting borrower spending. For example, Farrell et al. (2020b) show that spending held up better for unemployed borrowers who immediately received the expanded unemployment insurance benefits. Other aid programs include the stimulus checks implemented as part of the CARES Act, signed into law on March 27, 2020. In mid-April, the U.S. Department of the Treasury began sending checks of $1,200 ($2,400) to individuals (couples) with adjusted gross income of less than $75,000 ($150,000). A payment of $500 was added for each dependent child under age 16. Those with income between $75,000 (150,000) and $99,000 ($198,000) received a reduced payment.
We next examine whether payment behavior differed between borrowers eligible for the full stimulus (with income of less than $75,000) and those ineligible for the stimulus (with income of more than $100,000). As panels B and C of figure 6 show, the increases in payments beyond the minimum for both light and heavy revolvers were larger among borrowers eligible for the stimulus payments. Interestingly, the share of heavy revolvers eligible for the stimulus paying exactly $1,200 or $2,400 also increased more than 20 percent in May, consistent with some borrowers applying the full stimulus payments to their revolving balances.20
As lower purchase volume and higher payments led to a contraction of balances during the pandemic, finance charges, which are calculated based on outstanding balances, also declined. The total amount of finance charges paid by borrowers fell from more than $7 billion in February to $6.5 billion in April and to less than $6 billion in June (see panel C of figure 3). In addition to the decline in balances, these changes are likely due to the decrease in the target range for the federal funds rate in March, which is reflected in a lower "prime" interest rate upon which most credit card rates are benchmarked.21
References
Baker, Scott R., R. A. Farrokhnia, Steffen Meyer, Michaela Pagel, and Constantine Yannelis (2020). "How Does Household Spending Respond to an Epidemic? Consumption during the 2020 COVID-19 Pandemic (PDF)," NBER Working Paper Series 26949. Cambridge, Mass.: National Bureau of Economic Research, April.
Chetty, Raj, John N. Friedman, Nathaniel Hendren, Michael Stepner, and the Opportunity Insights Team (2020). "How Did COVID-19 and Stabilization Policies Affect Spending and Employment? A New Real-Time Economic Tracker Based on Private Sector Data (PDF)," NBER Working Paper Series 27431. Cambridge, Mass.: National Bureau of Economic Research, June.
Cox, Natalie, Peter Ganong, Pascal Noel, Joseph S. Vavra, Arlene Wong, Diana Farrell, and Fiona Greig (2020). "Initial Impacts of the Pandemic on Consumer Behavior: Evidence from Linked Income, Spending, and Savings Data (PDF)," Becker Friedman Institute Working Paper 2020-82. Chicago: Becker Friedman Institute, July.
Farrell, Diana, Fiona Greig, Natalie Cox, Peter Ganong, and Pascal Noel (2020a). "The Initial Household Spending Response to COVID-19: Evidence from Credit Card Transactions," JPMorgan Chase Institute Research Paper, May, https://institute.jpmorganchase.com/institute/research/household-income-spending/initial-household-spending-response-to-covid-19.
Farrell, Diana, Peter Ganong, Fiona Greig, Max Liebeskind, Pascal Noel, and Joseph S. Vavra (2020b). "Consumption Effects of Unemployment Insurance during the COVID-19 Pandemic," JPMorgan Chase Institute Research Paper, July, https://institute.jpmorganchase.com/institute/research/labor-markets/unemployment-insurance-covid19-pandemic.
Gross, David B., and Nicholas S. Souleles (2002). "Do Liquidity Constraints and Interest Rates Matter for Consumer Behavior? Evidence from Credit Card Data," Quarterly Journal of Economics, vol. 117 (February), pp. 149–85.
Horvath, Akos, Benjamin Kay, and Carlo Wix (2020). "The COVID-19 Shock and Consumer Credit: Evidence from Credit Card Data," Working Paper, May.
Stolba, Stefan Lembo (2020). "COVID-19 Impact: Changes to Consumer Debt and Credit," Experian Blog, July 8, https://www.experian.com/blogs/ask-experian/research/covid-19-impact-on-consumer-debt-and-credit.
1. Board of Governors of the Federal Reserve System. The analysis and opinions set forth are those of the authors and do not indicate concurrence by other members of the research staff or the Board of Governors. We thank Tim Dore, John Driscoll, and Geng Li for helpful comments and Bradley Katcher for excellent research assistance. Return to text
2. The vast majority of G.19 revolving credit represents credit card balances. Return to text
3. Payment patterns are also an important factor, as credit cards do not have fixed payments. Return to text
4. Total payments exceeded purchase volume in both April and May, but the difference between the two contracted in May. Return to text
5. The Y-14M dataset captures information only on individual credit card accounts and, hence, does not provide a complete picture of household expenditures or credit usage. Seasonally adjusted revolving credit in the G.19 was approximately $1 trillion in April 2020, higher than the $770 billion of balances reported in the Y-14M. One source of difference is that revolving credit in the G.19 reflects balances held by depository institutions, credit unions, finance companies, and nonfinancial businesses and includes personal lines of credit, overdraft programs, and similar plans, in addition to credit card balances. Another difference is that Y-14M balances are reported as of statement close rather than at month's end. Month-end balances tend to be larger, as some borrowers pay down their credit cards to have a low balance reported to credit bureaus when the statement closes. Return to text
6. Our sample only includes general purpose credit cards. Call Report data also include charge and private label cards. If we include those cards, our sample accounts for about 85 percent of balances reported on the Call Report. Return to text
7. Our results are robust to larger pulls of the data. For comparability, we exclude private label and secured cards, as well as charge cards. This exclusion results in approximately $600 billion of consumer credit card balances. Our results are robust to including private label and secured accounts. Return to text
8. In March, the G.19 and Y-14M report declines of 28 percent and 3 percent, respectively (s.a.a.r.). The differences in G.19 and Y-14M percentage changes in March and June are likely due to the time periods the data use. The G.19 measures balances at the end of the calendar month and reports the percentage change over the month. By contrast, the Y-14M measures balances at the end of the borrower's statement period, and because the COVID-19 slowdown began in mid-March, these balances do not necessarily reflect the effects of the slowdown. Similarly, the rebound in balances is not fully reflected in the June Y-14M data. Return to text
9. Pre-payments of purchases are payments applied toward current purchases prior to statement close. They are calculated as any payments in excess of the previous statement balance. Return to text
10. Total new purchase volume similarly declined 25 percent in April and rose 9 percent and 13 percent in May and June, respectively. Return to text
11. Revolving balances in April fell $1 billion; however, seasonally adjusting the data shows a slight increase in revolving balances. Return to text
12. Light revolver accounts include instances corresponding to borrowers who forgot to make a payment (accounts with a nonzero balance who do not make a payment but make a payment the next month). These accounts represent a small fraction of light revolver accounts. Return to text
13. Our unit of analysis is an account, not a borrower, as we are unable to track all of a borrower's accounts across different banks. The percentage of accounts in each category is fairly stable over time, ranging between 28 and 29 percent for transactors, 30 and 32 percent for light revolvers, and 40 and 41 percent for heavy revolvers during our sample period. We assign an account to each category contemporaneously. However, assigning based on previous months' data does not change our results. Return to text
14. The data show that 85 percent of transactor accounts and 75 percent of light revolver accounts are held by borrowers with prime credit scores. Return to text
15. The fraction of purchase volume accounted for by transactors ranged between 38 and 40 percent during our sample period. Similarly, light revolvers accounted for between 36 and 39 percent and heavy revolvers were responsible for between 23 and 25 percent of the purchase volume. Return to text
16. Declines in net purchase volume (purchase volume less any payments beyond the previous statement balance) were similar. Return to text
17. Very few transactors have credit scores lower than 600. Thus, the estimates for purchase volume for transactors in those credit score bins are likely less reliable. Return to text
18. Transactors' balances are mainly composed of their purchases in the same month because, by definition, they do not have revolving balances. Return to text
19. The share of light revolvers with revolving balances who paid them off in June jumped to 42 percent, near historical highs. Return to text
20. The increase is similar when we consider borrowers making payments of $1,700, $2,200, $2,900, and $3,400 to account for dependents. The share of heavy revolvers making payments of these exact sums remained low in May, at less than 0.5 percent. Return to text
21. The interest rate on most existing credit cards is variable and tied to the prime rate, defined as a fixed markup over the federal funds rate. Once card rates completely adjust to the drop in the target federal funds rate of 150 basis points in March, consumers should benefit about $1.25 per $1,000 per month in interest charges on revolving balances, totaling savings of approximately $4 per month for the average heavy revolver with revolving balances of $3,500. The decrease in finance charges between February and June could also reflect lenders granting interest waivers; however, this type of forbearance is reportedly rare relative to payment deferrals with accruing interest. Return to text
Adams, Robert M., and Vitaly M. Bord (2020). "The Effects of the COVID-19 Shutdown on the Consumer Credit Card Market: Revolvers versus Transactors," FEDS Notes. Washington: Board of Governors of the Federal Reserve System, October 21, 2020, https://doi.org/10.17016/2380-7172.2792.
Disclaimer: FEDS Notes are articles in which Board staff offer their own views and present analysis on a range of topics in economics and finance. These articles are shorter and less technically oriented than FEDS Working Papers and IFDP papers.