FEDS Notes
July 07, 2023
A (Bayesian) Update on Inflation and Inflation Persistence
Highlights
- Earlier research noted how a Bayesian decisionmaker would update their assessment of inflation dynamics using pre- and post-1999 data. Even with a very low weight on their prior (pre-1999) information, such a decisionmaker would have viewed inflation as persistent in 2021.
- This finding implied that the elevated inflation of 2021 may continue into 2022.
- A key element of a Bayesian decisionmaker is to re-evaluate as new data arrives. This note considers experience in 2022 and forecasts for 2023-25.
- Experience in 2022 and early 2023 suggests that the Bayesian approach with notable inflation persistence provided good guidance on the inflation outlook. Models using this approach suggest core CPI inflation may remain above 3 1/2 percent through 2024, higher than professional forecasters expect.
Inflation in 2021 reached the highest level seen since the early 1980s. High inflation has raised questions regarding the speed with which inflation may return to the 2-percent range consistent with the Federal Reserve's inflation objective.
In research last year (Kiley 2022a, 2022b), I asked how a Bayesian decisionmaker endowed with a prior regarding the inflation process observed in the United States from the 1960s to 1990s would view the current inflation process. Even with a very low weight on their prior (pre-2000) information, such a decisionmaker would have viewed inflation as persistent in 2021.
A core element of a Bayesian approach involves updating views as new information arrives. This note revisits the issues discussed in Kiley (2022a, 2022b) to see whether recent data suggests inflation is less persistent than judged in that work. The data in 2022 and early 2023 for core CPI inflation has been consistent with the models with substantial inflation persistence. Updating forecasts from these models suggests core CPI inflation is likely to remain above 3 1/2 percent through 2024. These projections lie substantially above those of professional forecasters.
1. Data and approach
Kiley (2022a, 2022b) provides details, and this note only summarizes key aspects. Interested readers should refer to those earlier pieces for technical aspects of the analysis. The analysis focuses on the CPI. The focus of the investigation is the evolution of the persistence of inflation in a Phillips Curve. To abstract from the volatility induced by fluctuations in food and energy prices, the empirical work uses the CPI excluding food and energy (core CPI).
The Phillips Curve framework relates inflation to a measure of economic slack. The analysis uses the unemployment rate of the civilian noninstitutional population aged 16 and over (the unemployment rate), produced monthly by the U.S. Bureau of Labor Statistics.
The model considered is a Phillips Curve in which inflation $$(\Delta p(t))$$ depends on its own lags and the (lagged) unemployment rate $$(u(t))$$ as in equation (1) (in which a constant term is suppressed):
$$$$(1) \Delta p(t) = b(1) \sum_{j=1}^N \Delta p(t-j)/N+a \cdot u(t-1)+e(t).$$$$
b(1) is the coefficient governing persistence, $$a$$ is the slope of the Phillips curve, and e(t) is the residual reflecting "supply" shocks and other unmodeled factors. An anchored Phillips Curve would tend to have small b(1), whereas an unanchored Phillips Curve will tend to have large b(1). Note that the lag structure in equation 1 is very restrictive, and results were similar for other specifications.
The analysis considers how a Bayesian decisionmaker would use the data from 2000-2019 to update their prior for the inflation process, where the prior is based in data from the late 1950s to 1999. This is a standard statistical problem, and the working paper provides details. To consider decreasing levels of conviction in the relevance of the 20th century prior, four values for weights on the pre-2000 information are considered: large, moderate, modest, and no weight. These weights on prior information equal 0.5, 0.2, 0.05, or (approximately) 0. The remaining weight is on the data and the weights sum to one. (See the earlier analyses for details.)
The earlier analyses provided detailed estimation results. In brief, the Bayesian decisionmaker combines the prior view and the 2000–19 data. The results show a high degree of persistence in the posterior estimate of the decisionmaker. This result is intuitive. The posterior estimate combines the prior view and the least-squares estimate for the post-1999 period. Each of these pieces if information informs estimates based on its precision. Because inflation was stable from 2000 to 2019, data from that period provide imprecise information regarding how inflation may behave if it were to deviate sizably from its lagged values. The information pre-2000 is more informative and implies persistence.
Much of the importance of this result can be gleaned from forecasts from the models. Table 1 repeats information from the earlier analyses on the forecasts of inflation from the models based on data available at that time. A Phillips Curve based on post-1999 data alone implied a sharp deceleration of inflation in 2022. In contrast, the Bayesian estimates implied that inflation would remain quite high in 2022 in the absence of unexpected shocks. Table 1 also includes the core CPI projection from the February 2022 Survey of Professional Forecasters (Federal Reserve Bank of Philadelphia, 2022), which was the projection based on similar information as used in the earlier analyses. This survey indicated that professional forecasters expected core CPI inflation to drop to 3 1/2 percent in 2022. The forecast by professional forecasters was consistent with the view that information on the inflation process prior to the last two decades is irrelevant to the inflation outlook.
Table 1: Inflation forecasts for 2022-23 (reported in Kiley, 2022b and Based on data through early 2022)
Core CPI inflation, Q4/Q4
| Year | Implied by specifications considered by the Bayesian decisionmaker | Survey of Professional Forecasters | |||
|---|---|---|---|---|---|
| Weight on prior=0.5 | Weight on prior=0.2 | Weight on prior=0.05 | Uninformative prior | February 2022 (median) | |
| 2021 | 5 | 5 | 5 | 5 | 5 |
| 2022 | 5.8 | 5.4 | 4.5 | 3 | 3.6 |
| 2023 | 5.5 | 4.7 | 3.3 | 2.3 | 2.5 |
| Forecast error relative to realized 2022 core CPI inflation of 6.0 percent | |||||
| 2022 | 0.2 | 0.6 | 1.5 | 3 | 2.4 |
Note: Author’s calculations based on the estimates for monthly data shown in table 2. The unemployment rate is assumed to remain at its January 2022 value of 4.0 percent.
Source: Bureau of Labor Statistics, Federal Reserve Bank of Philadelphia, and author’s calculations.
The bottom panel of table 1 reports the outcome for core CPI inflation in 2022—6.0 percent—and the forecast errors from the models and the February 2022 Survey of Professional Forecasters. The models in which a Bayesian decisionmaker assigns some weight to pre-1999 data make substantially smaller forecast errors. Through the first five months of 2023, core CPI inflation has run at an annual rate just above 5 percent, which is also in the range of forecasts from the models with inflation persistence for 2023. This pace of inflation is far above the expectation of professional forecasters in early 2022.
2. Updated Forecasts
These results suggest value in considering updated forecasts from the models. Table 2 and figure 1 present updated forecasts, using data through May 2023. The table also includes the forecasts from the May 2023 Survey of Professional Forecasters. The forecasts which use pre-2000 information point to substantial persistence in core CPI inflation. The decisionmaker who puts low (but still non-zero) weight on pre-2000 information expects core CPI inflation over the four quarters ending in 2024Q4 to be 3 1/2 percent. Decisionmakers with a higher weight on pre-2000 information expect higher core CPI inflation. These forecasts are much higher than those from professional forecasters for 2024. The forecasts from professional forecasters lie close to forecasts from a model using 2000-19 data only, with inflation falling rapidly to 2 1/2 percent.
Table 2: Inflation forecasts for 2023-25 (Based on data through May 2023)
Core CPI inflation, Q4/Q4
| Year | Implied by specifications considered by the Bayesian decisionmaker | Survey of Professional Forecasters | |||
|---|---|---|---|---|---|
| Weight on prior=0.5 | Weight on prior=0.2 | Weight on prior=0.05 | Uninformative prior | May 2023 (median) | |
| 2023 | 5.1 | 4.9 | 4.6 | 3.9 | 4.1 |
| 2024 | 5.1 | 4.5 | 3.5 | 2.5 | 2.7 |
| 2025 | 5 | 4.1 | 3 | 2.4 | 2.3 |
Note: Author’s calculations based on the estimates for monthly data shown in table 2. The unemployment rate is assumed to remain at its May 2023 value of 3.7 percent.
Source: Bureau of Labor Statistics, Federal Reserve Bank of Philadelphia, and author’s calculations.
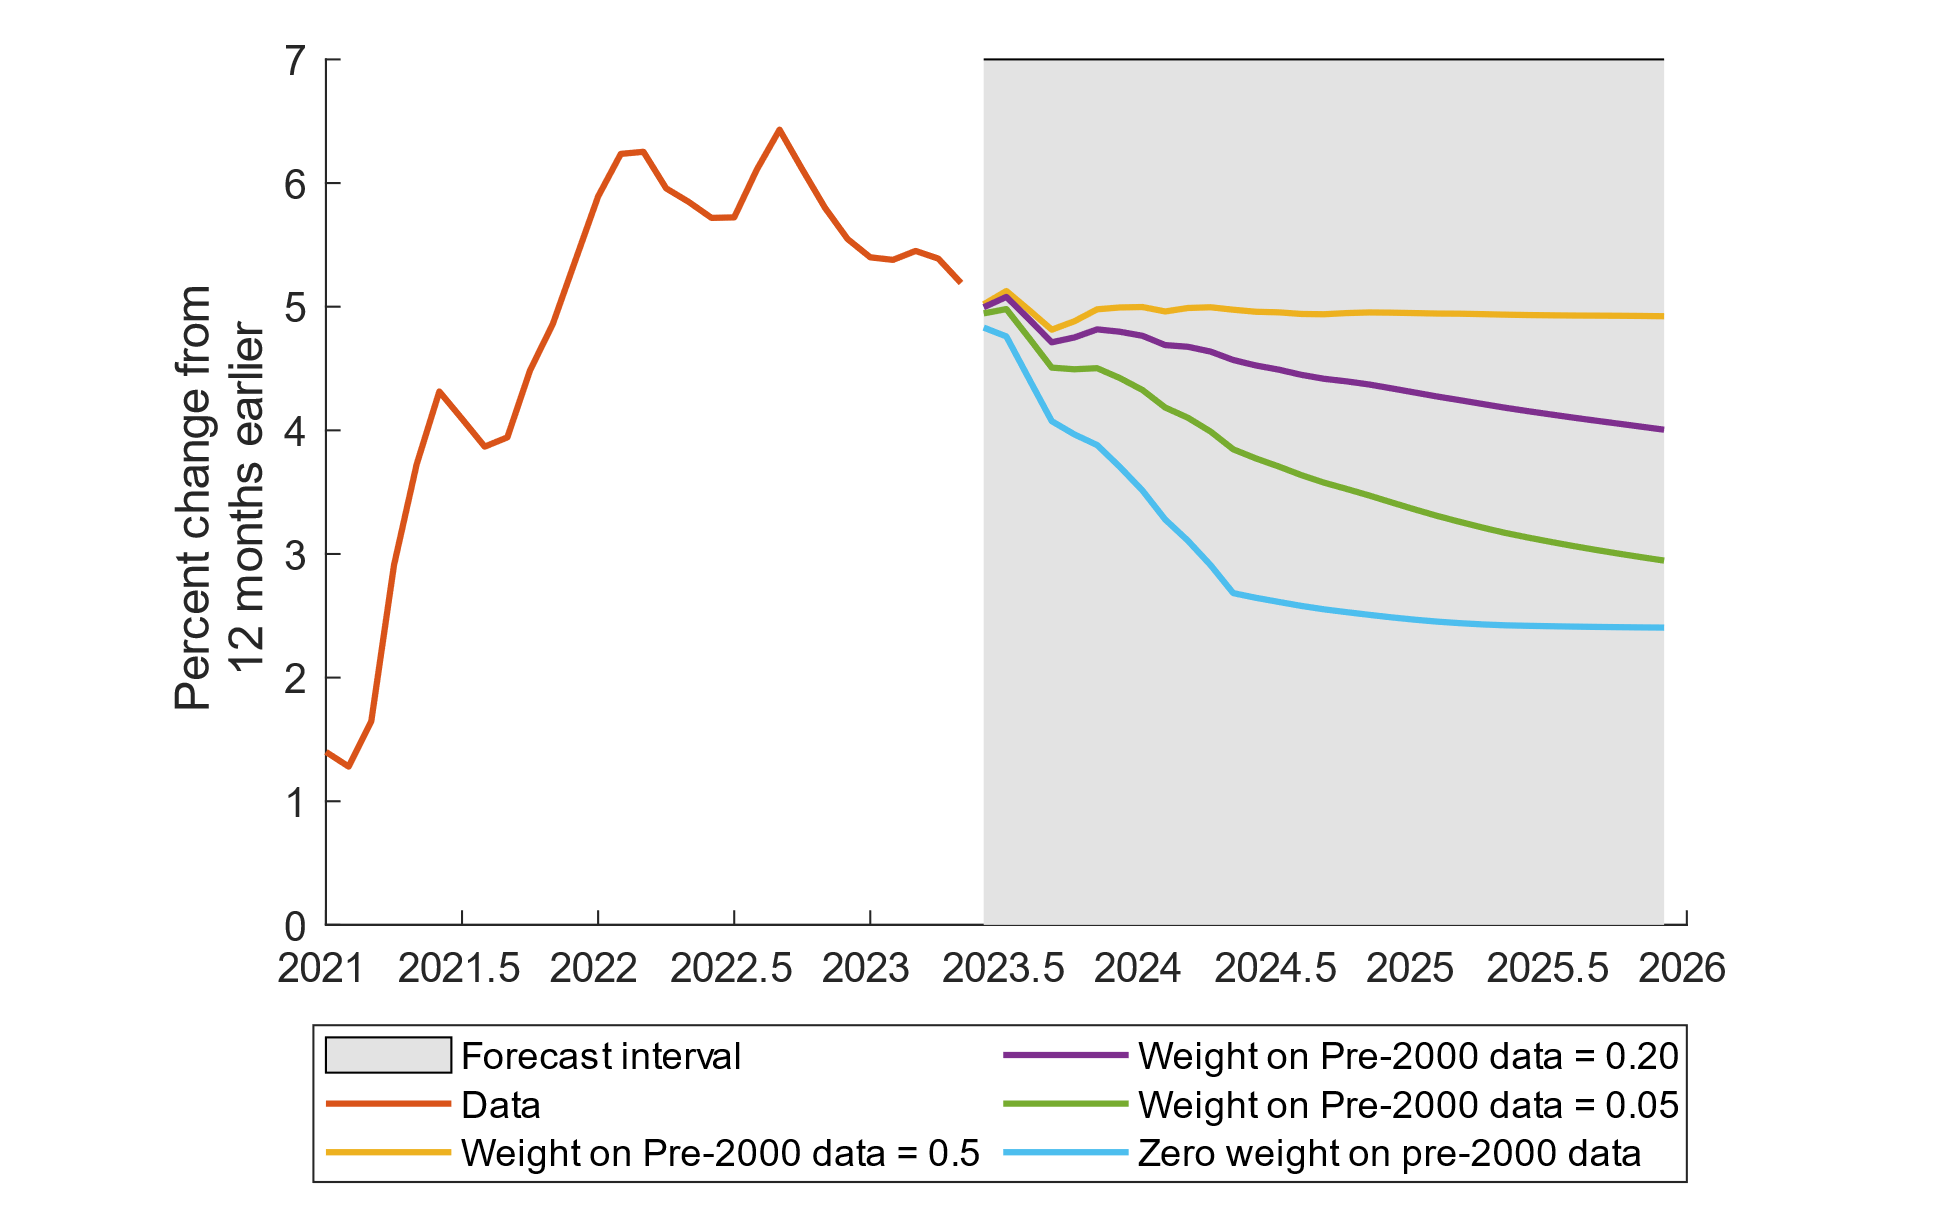
Source: Bureau of Labor Statistics and author's calculations.
3. Using post-2019 data
These results suggest that professional forecasters have not updated their model of inflation using data after 2019. The forecasts and outcomes for 2022 suggest that a model using pre-2000 data provided better guidance. This result begs the question of how persistent the inflation process would appear if data from 2000 to 2023 were used. Consider estimates of equation 1 from three approaches. The first approach ignores pre-2000 data and post 2019. This is the Bayesian approach with an uninformative prior or, more simply, the least-squares estimate of equation 1 using 2000-19 data. The second approach ignores pre-2000 data but uses data from 2000-23. The third approach is the Bayesian approach with moderate weight on pre-2000 data.
Table 3 presents the parameter estimates for these approaches. The approach using 2000-23 data yields estimates of inflation persistence very different from the approach using 2000-19 data and very similar to the Bayesian approach with a moderate weight on pre-2000 data. In other words, post-2019 experience validates the information in the prior from pre-2000 that inflation is persistent.2 This result suggests that professional forecasters are ignoring the information since 2019 when judging the nature of the Phillips curve, if forecasters are using a Phillips curve.
Table 3: Estimation of parameters
$$\Delta p(t) = b(1) \sum_{j=1}^N \Delta p(t-j)/N+a \cdot u(t-1)+e(t).$$
Monthly data (lag length N = 12)
| No weight on pre-2000 information and 2000-19 data | No weight on pre-2000 information and 2000-23 data | Moderate weight on pre-2000 information and 2000-19 data | |
|---|---|---|---|
| b(1) | 0.18 | 0.89 | 0.86 |
| s.e. | 0.16 | 0.09 | 0.05 |
| a | -0.14 | 0.01 | -0.04 |
| s.e. | 0.04 | 0.05 | 0.03 |
Source: Bureau of Labor Statistics and author's calculations.
Finally, it is interesting to note that the sensitivity of the results to the addition of a few years data is consistent with research on how macroeconomic data often contains moderate information and with the sensitivity of empirical results to prior choices, which are often implicit in macroeconomic research (Kiley, 2020a, 2020b, 2022a, 2022b). Explicit priors may illuminate such sensitivity.
References
Kiley, Michael T., 2020a. "The Global Equilibrium Real Interest Rate: Concepts, Estimates, and Challenges," Annual Review of Financial Economics, Annual Reviews, vol. 12(1), pages 305-326, December.
Kiley, Michael T., 2020b. "What Can the Data Tell Us about the Equilibrium Real Interest Rate?," International Journal of Central Banking, International Journal of Central Banking, vol. 16(3), pages 181-209, June.
Kiley, Michael T., 2022a. "Anchored or Not: How Much Information Does 21st Century Data Contain on Inflation Dynamics?," Finance and Economics Discussion Series 2022-016, Board of Governors of the Federal Reserve System (U.S.).
Kiley, Michael T., 2022b. "Anchored or Not: A Short Summary of a Bayesian Approach to the Persistence of Inflation," FEDS Notes 2022-04-08, Board of Governors of the Federal Reserve System (U.S.)
Kiley, Michael T., 2023. "The Role of Wages in Trend Inflation: Back to the 1980s?," Finance and Economics Discussion Series 2023-022, Board of Governors of the Federal Reserve System (U.S.).
1. Federal Reserve Board, Washington DC. Email: [email protected]. Michael Kiley is Deputy Director of the Division of Financial Stability of the Federal Reserve Board. The views expressed herein are those of the author, and do not reflect those of the Federal Reserve Board or its staff. Return to text
2. Other approaches have also detected inflation persistence in post-2019 data; see Kiley (2023). Return to text
Kiley, Michael T. (2023). "A (Bayesian) Update on Inflation and Inflation Persistence," FEDS Notes. Washington: Board of Governors of the Federal Reserve System, July 07. 2023, https://doi.org/10.17016/2380-7172.3349.
Disclaimer: FEDS Notes are articles in which Board staff offer their own views and present analysis on a range of topics in economics and finance. These articles are shorter and less technically oriented than FEDS Working Papers and IFDP papers.