FEDS Notes
February 03, 2023
A note on industry concentration measurement
Ryan Decker and Jacob Williams
Industry concentration—the share of sales or output accounted for by the largest firms within an industry—has received widespread attention recently, in part because concentration has generally risen in recent decades (figure 1).1 Measurement challenges are at the core of concentration-based inquiry: industry sales concentration is one of the lowest-frequency business statistics produced by the U.S. statistical agencies, with concentration data being released only twice per decade as part of the Economic Censuses.2 The data are released with a substantial lag: the latest available data currently cover 2017, and the "first look" results of the 2022 Economic Censuses are slated to be released in early 2024.
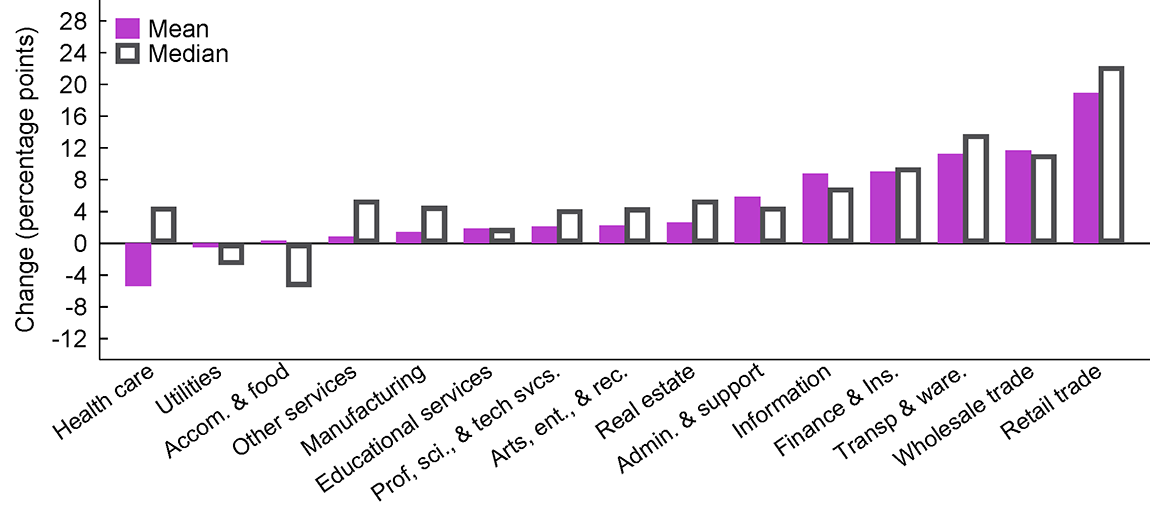
Note: Change in sales-weighted mean/median of 6-digit industries, 1997-2017. Concentration is measured as the share of sales accounted for by the top 4 firms.
Source: 1997 and 2017 Economic Censuses.
These constraints on the frequency and timeliness of official concentration data have prompted researchers to search for other, more convenient, data sources. Most prominent among these are data on publicly traded firms, such as those contained in Compustat: sales data for public firms are available at annual (or even quarterly) frequency and in almost real time, so the data are far more convenient than the Economic Censuses.3
Use of Compustat for concentration measurement is common in recent literature (e.g., Grullon, Larkin, and Michaely 2017; Covarrubias, Gutiérrez, and Philippon 2019; Bräuning, Fillat, and Joaquim 2022); but the data have been found to be poorly suited for studying industry concentration, at least in manufacturing (Bessen 2020; Keil 2017; Ali, Klasa, and Yeung 2009). In this note, we update past results through 2017, expand the industry coverage beyond manufacturing, and provide new investigations that should prompt additional caution among researchers seeking to measure industry concentration with data that are limited to publicly traded firms.
Using Compustat and multi-sector Economic Census data for 1997 through 2017, we find—consistent with prior work—that industry-level correlations of top-firm concentration ratios between Compustat and Census data are low, with correlations generally below 0.2 and typically closer to 0.1.4 In other words, Compustat-based concentration ratios are not highly correlated with more accurate measures from Census data.
We make two additional novel contributions. First, we enhance Compustat with industry sales data published by the Bureau of Economic Analysis (BEA); this only modestly improves correlations despite correcting one of the major flaws of Compustat-based measures. Second, we describe a timely application in which we study correlations between industry concentration and producer price changes during 2021 and 2022; we find that the empirical relationship between concentration and recent price growth is sensitive to the choice of concentration measure.
We now turn to our empirical analysis, after which we discuss conceptual and empirical considerations more broadly.
How well do Compustat concentration ratios match Census data?
We compare Compustat concentration ratios to their Economic Census counterparts using simple correlations.5 Figure 2 reports these correlations for 2002-2017 Economic Census years, with concentration ratios calculated at the 4-, 5-, and 6-digit level of NAICS industry detail across all of the sectors shown in figure 1.
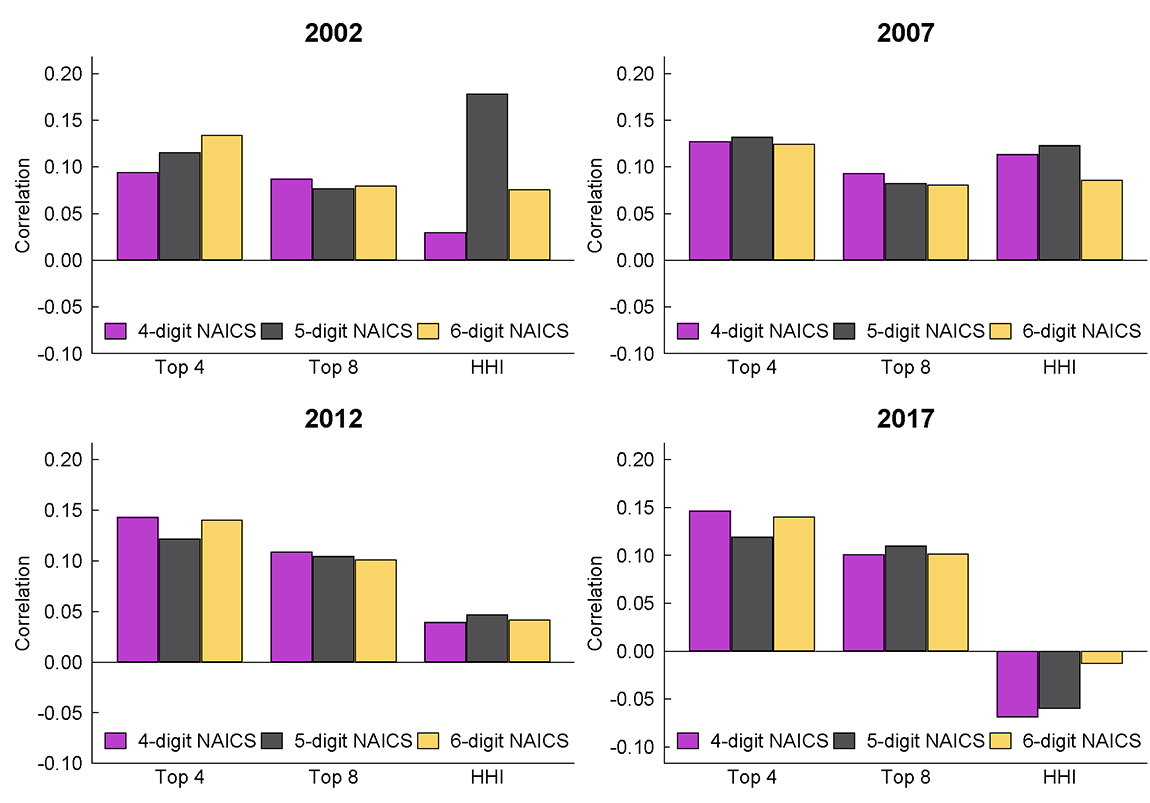
Note: The key identifies bars in order from left to right. Simple correlations of concentration ratios between Compustat and Economic Census.
Source: Compustat, Economic Censuses, and author calculations.
Focusing on top-4 firm ratios at the 4-digit level (leftmost bars in each panel of figure 2), in 2002 the correlation between Compustat and the Economic Censuses was just 10 percent. The correlation of top-4 firm shares is only slightly higher for 5-digit and 6-digit industries, and correlations of top-8 firm shares at every industry detail level are lower than for top-4 firm shares. The figure also reports correlations for the Herfindahl-Hirschman Index (HHI). Broadly speaking, while there is some variation in the correlations across industry detail specifications, concentration measures, and years, none of the correlations are high (though we note that the correlations are mostly positive and statistically significant). In unreported exercises we find similar results for 1997.
Though not shown on the figure, we also examine correlations for the change in concentration measures over time. That is, we calculate the total (log) change in industry top-4 shares, top-8 shares, and HHIs from 2002 to 2017, and we study correlations between Economic Census and Compustat.6 We find these correlations to be low as well—no higher than 0.2 (and typically not statistically significant), and even negative in some specifications. We also find low correlations when we focus on changes across individual Census years rather than the difference across the entire time period—that is, if we study the change in concentration from 1997 to 2002, from 2002 to 2007, from 2007 to 2012, and from 2012 to 2017. Pooled correlations of these 5-year changes in concentration are typically around 0.2 or lower, depending on level of industry detail. In other words, the change in concentration as measured in Compustat does not appear to be a good proxy for the true change in industry concentration.7
A more accurate sales denominator
The Compustat-based concentration measures can be mismeasured due to both the numerator—as the set of top firms is limited to publicly traded firms and their Compustat sales data—and the denominator—which is restricted to total Compustat sales among public firms. The latter limitation may be alleviated by other data sources that measure sales for entire industries (inclusive of privately held firms). As part of the national income and product accounts (NIPA), the BEA publishes annual nominal sales data at the industry level, with data currently available through 2021.8 If the top firms in a given industry are publicly traded, and if their sales data as reported in Compustat are accurate and conceptually congruent with national accounts data, then accurate annual concentration ratios could be calculated by using Compustat top firm sales for the numerator and BEA sales data as the denominator (as in Liu 2022), with analogous adjustments for the HHI.
We construct these "NIPA-enhanced" Compustat concentration ratios then measure their correlation with Economic Census tabulations; the results are reported in table 1. To be precise, in these concentration ratios, the numerator is total sales among top firms in an industry as reported in Compustat, while the denominator is total industry sales as reported by the BEA.9
Table 1. Correlations for NIPA-enhanced Compustat concentration ratios
| Top 4 | Top 8 | HHI | |
|---|---|---|---|
| 1997 | 0.37 | 0.34 | |
| 2002 | 0.36 | 0.33 | 0.13 |
| 2007 | 0.28 | 0.27 | 0.16 |
| 2012 | 0.25 | 0.25 | 0.10 |
| 2017 | 0.27 | 0.26 | 0.09 |
Source: BEA, Compustat, Economic Censuses, and author calculations.
The correlations shown in table 1 are indeed somewhat higher than those reported in figure 2, indicating that the use of business universe data in the denominator does improve accuracy. Indeed, we find that, among matched industries, Compustat industry-level sales are roughly half of BEA sales, on average, during the years of 1997-2017, so significant economic activity is omitted from Compustat-based industry sales denominators; and the share of BEA sales accounted for by Compustat varies widely across industries.10 In other words, Compustat coverage of total industry-level sales is incomplete and inconsistent, so replacing the Compustat denominator with the BEA denominator is an improvement.
However, the correlations in table 1 are still disappointingly low—below 0.4 in 2002 and below 0.3 thereafter. This suggests that the numerator of the concentration ratio remains mismeasured in many cases. There could be several reasons for this mismeasurement. First, some top firms in some industries may not be publicly traded such that important firms are missing from the calculation. Second, firm-level industry classifications—as are used in Compustat data—likely misclassify sales across industries; that is, large firms likely sell products in multiple industries, but the Compustat data we use assign all firm sales to a single industry. Third, Compustat sales data may not correspond to the concepts underlying national accounts or Census data; for example, prior work has found evidence that Compustat sales data may include sales made by foreign establishments (Keil 2017). Indeed, total Compustat sales exceed total BEA sales in many industries.11 Even aside from the disappointingly low correlations in table 1, then, these measurement issues cast serious doubt on Compustat sales data as a measure of domestic industry-level economic activity.
Application: Price growth in the COVID-19 pandemic
Some commentators and researchers have suggested that industry concentration has been an important determinant of price growth since 2020 (e.g., Bräuning, Fillat, and Joaquim 2022; Singer 2022; for a related discussion see Konczal and Lusiani 2022). We make no contribution to this question here, leaving a rigorous analysis of the hypothesis for other research; instead, we simply study reduced-form correlations between initial industry concentration and price growth during the 2021-2022 period to illustrate how this question might depend on the measurement issues we highlight. 12
We study producer price indexes (PPI) from the Bureau of Labor Statistics (BLS) at the detailed industry level.13 For comparability, we measure concentration in 2017 for both Compustat and the Economic Censuses. We merge both datasets at the 6-digit NAICS level, leaving us with a dataset containing, at most, 475 industries (PPI industry coverage is not comprehensive). We then calculate simple correlations between concentration and average monthly price growth starting since December 2020.14 Figure 3 features scatterplots of the results, while table 2 reports simple regression coefficients.
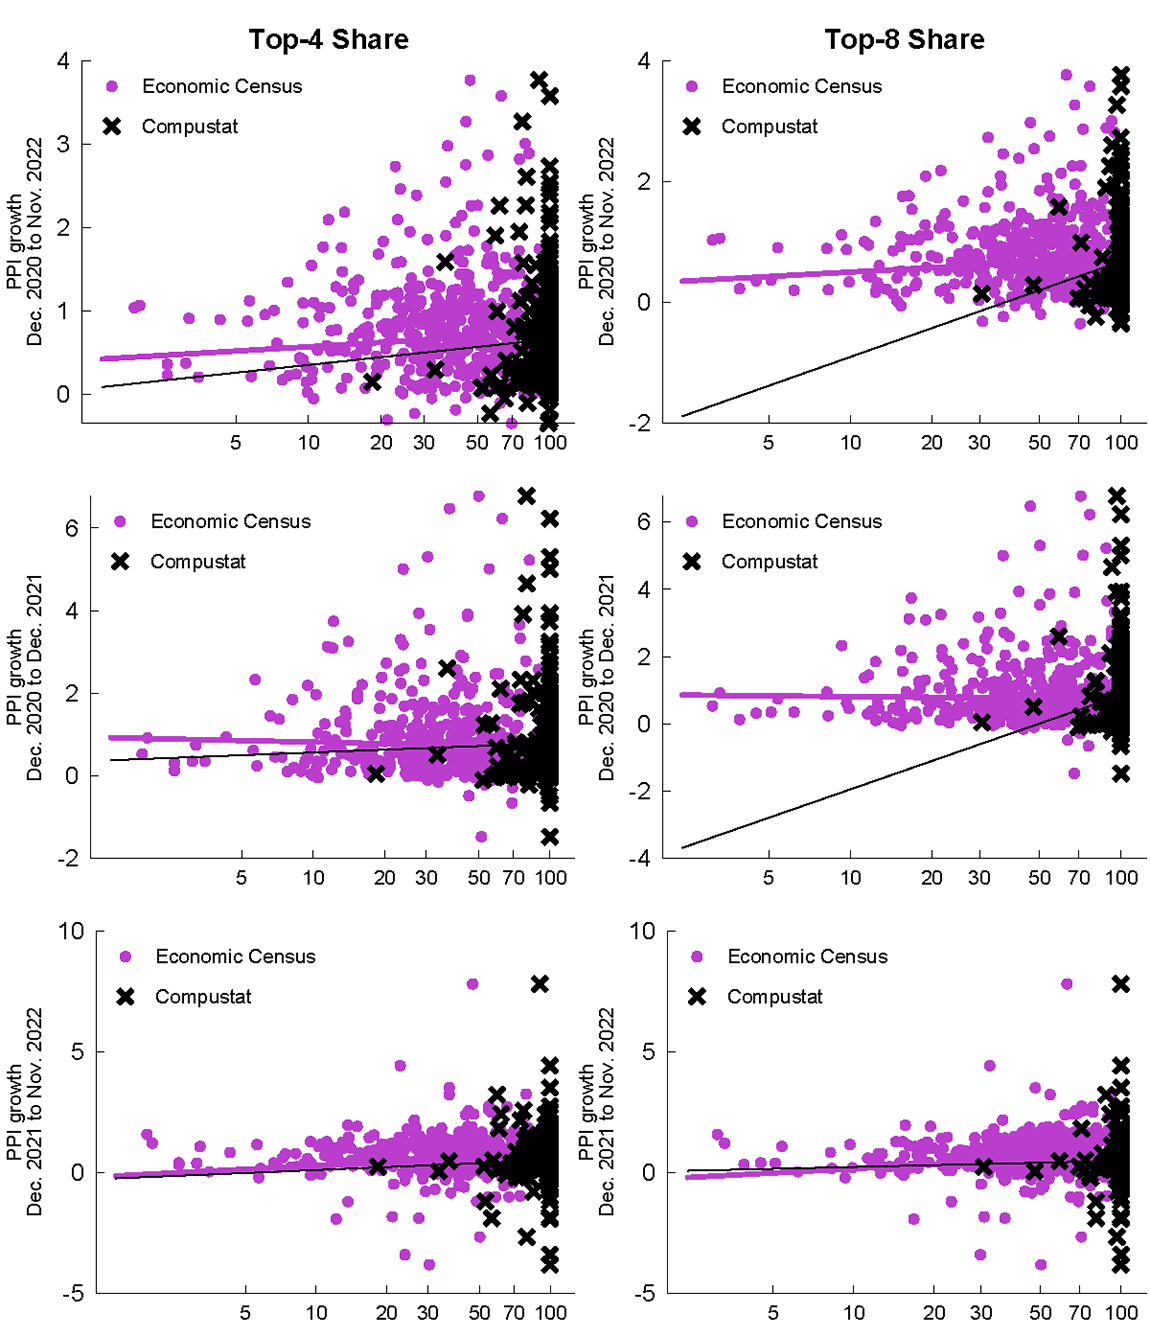
Note: PPI data are monthly average (log points) of seasonally adjusted index growth. Lines are sales weighted linear fit among industries present in both data sources. Data are at the 6-digit NAICS level.
Source: BLS, Compustat, Economic Censuses, and author calculations.
In figure 3, the left panels measure concentration as the top-4 firm share, while the right panels use the top-8 firm share. The top panels relate average monthly PPI growth during the entire period of December 2020 through November 2022, while the middle panels focus on the period through the end of 2021 and the bottom panels focus on 2022. In each panel, the thick pink line corresponds to a (sales-weighted) regression line for the Economic Census concentration measures, while the thin black line is the regression line for Compustat concentration measures.
The most notable feature of figure 3 is the dramatic difference in the distribution of industry concentration in Compsutat versus the Economic Census. In particular, Compustat concentration is heavily piled at the right end of the charts, where the top firm shares equal 100 percent. This reflects the highly limited nature of Compustat coverage; Compustat has eight or fewer firms—total—in about 80 percent of 6-digit NAICS industries and has four or fewer firms in about 70 percent of 6-digit industries.15 The Economic Census data, in contrast, reveal that concentration ratios of 100 are nearly nonexistent among the universe of employer firms. The prevalence of industries with 100 percent concentration in Compustat data is a serious problem which likely renders spurious most cross-sectional relationships between Compustat concentration ratios and other economic variables.
In table 2 we report regression coefficients associated with the fit lines of figure 3 along with HHI-based regression coefficients. That is, we regress average PPI growth (in log points) on the log of concentration (measured in 2017) for both Compustat and the Economic Censuses, and we restrict the sample to industries present in both data sources for direct comparability.
Table 2: Concentration and pandemic price growth
| Price growth period: | Top-4 Share | Top-8 Share | HHI | |||
|---|---|---|---|---|---|---|
| CS | EC | CS | EC | CS | EC | |
| Dec. 2020-Nov. 2022 | 0.14 | 0.08 | 0.69 | 0.11 | -0.03 | 0.08 |
| (0.28) | (0.11) | (0.41) | (0.13) | (0.12) | (0.07) | |
| Dec. 2020-Dec. 2021 | 0.10 | -0.05 | 1.22 | -0.03 | -0.07 | -0.00 |
| (0.42) | (0.20) | (0.62) | (0.24) | (0.17) | (0.13) | |
| Dec. 2021-Nov. 2022 | 0.18 | 0.22* | 0.11 | 0.26* | 0.02 | 0.16** |
| (0.37) | (0.09) | (0.60) | (0.10) | (0.14) | (0.06) | |
| Max R-squared | 0.00 | 0.05 | 0.03 | 0.05 | 0.00 | 0.08 |
Note: Coefficients from separate sales-weighted regressions of log price growth on log initial concentration. Robust standard errors in parentheses.
* p<0.05, ** p<0.01
Source: BLS, Compustat, Economic Censuses, and author calculations.
Consistent with figure 3, table 2 shows material discrepancies between regressions using Compustat and regressions using the Economic Census—though the comparison is made difficult by the large standard errors (especially in Compustat-based regressions). Interestingly, coefficients for the later pandemic period with top-4 shares are roughly similar. But this similarity is apparently deceiving: coefficients for the earlier period are markedly different, and the extreme prevalence of (essentially) top-coded concentration in Compustat data warrants caution. A focus on this limited time period could lead to incorrect conclusions about the broader consonance of Compustat data and higher-quality sources, as the coefficients from the earlier time period confirm. In unreported exercises, we find broadly similar results if we measure Compustat concentration in 2019 instead of 2017 and if we run the regressions with concentration in levels instead of logs. We find only modest improvement (but significantly reduced sample size) if we omit industries for which Compustat concentration ratios equal 100 (or HHIs equal 10,000). Results are also similar at the 5-digit NAICS level, though coefficients are generally greater (particularly in the later time period).
In additional unreported exercises, we run the regressions from table 2 using BEA-enhanced Compustat concentration ratios (and using detailed industry codes as defined in BEA data). The results are difficult to interpret since many Compustat industries have BEA-enhanced concentration ratios that are extremely high (above 100) or extremely low. That said, the BEA-enhanced Compustat data produce regression results that are a bit more consistent with Census-based results, especially with respect to the top-8 firm share measures.
Discussion
Our findings are not surprising in light of both conceptual issues and prior empirical work. Conceptual limitations of public firm data are numerous. Publicly traded firms comprise less than half of U.S. economic activity and a much smaller unweighted share of all firms, and the measurement of top firm concentration requires accurate data covering all top firms in an industry as well as accurate measures of total industry sales.16 Importantly, the (likely) fact that many of the largest firms are publicly traded does not address the lack of accurate industry sales denominators in public firm data—though even with higher-quality sales denominators, Compustat concentration ratios still have limited accuracy.
A top-firm concentration ratio among publicly traded firms simply measures the share of industry sales by publicly traded firms that is accounted for by the largest publicly traded firms, where industry is identified at the firm level (as opposed to the establishment level as in Census sources) for firms that are often large and engaged in multiple industries.17 This kind of empirical object might have some meaning for investors or analysts choosing between equity investments, but its meaning for broader macroeconomic inference is likely limited: both the numerator and the denominator of a public-firms-only concentration ratio could differ significantly from their counterparts calculated on the full universe of firms in an industry. There is little reason, conceptually, to expect concentration ratios computed among public firms to provide accurate measures of concentration ratios for the whole economy.
Relatedly, previous empirical literature documents the problems with drawing inference for the whole economy from data on publicly traded firms. Public firms exhibit different levels and trends for common measures of firm dynamics (Davis et al. 2007), and careful microdata linkages reveal sizeable discrepancies between Compustat and authoritative Census sources for sales and employment measurement (Dinlersoz et al. 2018); these discrepancies may arise due to possible inclusion of sales by international subsidiaries in Compustat data or other differences in measurement methodologies.
It is not surprising, then, that previous literature finds Compustat-based concentration ratios to be poor proxies for higher-quality Census measures. Ali, Klasa, and Yeung (2009) show that HHIs calculated in Compustat are much higher—in terms of mean, median, and quintiles—than those calculated on Census of Manufacturing data for 1963-2002 (consistent with our results in figure 3); and for 1980 onward, the correlation between Compustat and Census HHIs at the 4-digit SIC level (prior to 1997) and 6-digit NAICS level (1997 onward) is about 0.13. The authors then replicate several published finance papers that used Compustat concentration ratios, finding that the use of Census-based concentration measures substantially changes published results, and the authors argue that Compustat-based measures are best thought of as proxies for industry decline. Keil (2017) updates the analysis through 2012 and expands the exercise to include Compustat segment data, finding correlations between Census of Manufacturing HHIs and Compustat HHIs ranging from 0.03 (in 2007) to 0.15 (in 1997), with similarly low correlations when focusing on Compustat segments.
This note adds to the previous evidence finding that Compustat-based concentration measures make poor proxies for true industry concentration, which is evident in more recent data and more industries. We also show that enhancing Compustat with BEA industry sales data improves accuracy, but only modestly; and we find that reduced-form correlations between price growth and concentration during the early pandemic period are highly sensitive to the source of concentration data.
References
Albrecht, Brian. 2022. "Is Concentration Driving Inflation?" Economic Forces (May 26). At https://pricetheory.substack.com/p/is-concentration-driving-inflation.htm (accessed December 5, 2022).
Ali, Ashiq, Sandy Klasa, and Eric Yeung. 2009. "The Limitations of Industry Concentration Measures Constructed with Compustat Data: Implications for Finance Research." The Review of Financial Studies 22 no. 10:3839-3871.
Bessen, James. 2020. "Industry Concentration and Information Technology." Journal of Law and Economics 63 (August), pp. 531-555.
Bräuning, Falk, Jose L. Fillat, and Gustavo Joaquim. 2022. "Cost-Price Relationships in a Concentrated Economy." Available at SSRN: https://papers.ssrn.com/sol3/papers.cfm?abstract_id=4142715 (accessed December 3, 2022).
Covarrubias, Matias, Germán Gutiérrez, and Thomas Philippon. 2020. "From Good to Bad Concentration? U.S. Industries Over the Past 30 Years." Chapter 1 in NBER Macroeconomics Annual 2019, vol. 34, eds. Martin Eichenbaum and Erik Hurst. Cambridge, MA: MIT Press.
Crane, Leland, and Ryan Decker. 2020. "Research with Private Sector Business Microdata: The Case of NETS/D&B." Working paper, at https://conference.nber.org/conf_papers/f142811.pdf (PDF).
Davis, Steven J., John Haltiwanger, Ron Jarmin, and Javier Miranda. 2007. "Volatility and Dispersion in Business Growth Rates: Publicly Traded versus Privately Held Firms." Chapter 2 in NBER Macroeconomics Annual 2006, vol. 21, eds. Daron Acemoglu, Kenneth Rogoff, and Michael Woodford. Cambridge, MA: MIT Press.
Demsetz, Harold. 1973. "Industry Structure, Market Rivalry, and Public Policy." The Journal of Law and Economics 16 no. 1:1-9.
Dinlersoz, Emin, Sebnem Kalemli-Ozcan, Henry Hyatt, and Veronika Penciakova. 2018. "Leverage Over the Life Cycle and Implications for Firm Growth and Shock Responsiveness." NBER Working Paper no. 25226.
Grullon, Gustavo, Yelena Larkin, and Roni Michaely. 2019. "Are US Industries Becoming More Concentrated?" Review of Finance 23 no. 4:697-743.
Keil, Jan. 2017. "The Trouble with Approximating Industry Concentration from Compustat." Journal of Corporate Finance 45, pp. 467-479.
Konczal, Mike and Niko Lusiani. 2022. "Prices, Profits, and Power: An Analysis of 2021 Firm-Level Markups." Roosevelt Institute brief. At https://rooseveltinstitute.org/wp-content/uploads/2022/06/RI_PricesProfitsPower_202206.pdf (accessed December 20, 2022).
Liu, Ou. 2022. "Firm Dynamics and Innovation: Evidence from Decomposing Top Sales Shares." Working paper at https://www.ou-liu.com/research (accessed December 5, 2022).
Rossi-Hansberg, Esteban, Pierre-Daniel Sarte, and Nicholas Trachter. 2021. "Diverging Trends in National and Local Concentration." Chapter 2 in NBER Macroeconomics Annual 2020, vol. 35, eds. Martin Eichenbaum and Erik Hurst. Cambridge, MA: MIT Press.
Singer, Hal. 2022. Testimony from: U.S. Congress. Hearing of the House Committee on Economic Disparity and Fairness in Growth. "In Re: (Im)Balance of Power: How Market Concentration Affects Worker Compensation and Consumer Prices" (April 6). At https://docs.house.gov/meetings/EF/EF00/20220406/114615/HHRG-117-EF00-Wstate-SingerH-20220406.pdf (accessed December 5, 2022).
1. Figure 1 reports the change in the (sales-weighted) average of 6-digit NAICS industry top-4 firm sales shares from 1997 to 2017. This figure looks broadly similar if the comparison is from 2002 to 2017; the main exception is health care, which shows a notable decline in average concentration from 1997-2002 but a modest increase in average concentration (and modest decrease in median concentration) for 2002 to 2017. Several industries within this sector show extremely large declines in measured concentration between 1997 and 2002; in this short note we do not explore this issue, though it may be related to the issue of tax-exempt versus non-tax-exempt establishments in the Economic Census tabulations (we focus on the combined exempt and non-exempt tabulations). Return to text
2. The Economic Censuses are conducted in years ending in 2 or 7 (e.g., 2002 and 2007) and cover nearly all employer businesses in surveyed sectors, which are shown in figure 1. We omit the Census of Agriculture, which is a separate product. Return to text
3. Another possible alternative would be the Dun & Bradstreet (D&B)/National Establishment Time Series (NETS) family of products which, unlike Compustat, aspire to cover the universe of businesses; for example, Rossi-Hansberg, Sarte, and Trachter (2021) study concentration in NETS data. However, Crane and Decker (2020) find evidence that sales data in D&B/NETS are almost entirely imputed such that sales-based concentration ratios are uninformative relative to employment-based concentration ratios, and employment imputation is widespread as well. Return to text
4. We access Compustat data from S&P Global, Compustat North America, via Wharton Research Data Services (WRDS). When building filters on Compustat data through the WRDS interface, we set the consolidation level to C, the industry format to INDL, the data format to STD, and the population source to D. We then drop firms with NAICS codes with 9 as the leading digit; we keep only firms with a U.S. location (i.e., loc="USA") and drop firms with missing state codes. Return to text
5. A key challenge when comparing Compustat and Economic Censuses is the lack of compatibility of NAICS industry codes. While all of the Economic Census years we study use NAICS codes, each year features its own NAICS vintage, and there are some differences across NAICS vintages (especially at narrower levels of industry detail). Compustat NAICS codes, on the other hand, appear to follow no specific NAICS vintage but feature codes from all extant vintages. We adjust for these differences as best we can using publicly available data. In particular, where possible, we convert Compustat NAICS codes to their appropriate vintage before merging with the Economic Censuses. That is, in Compustat data prior to 2002 we attempt to convert all NAICS codes to NAICS 1997 vintage; in Compustat data for 2002-2006 we attempt to convert all NAICS codes to NAICS 2002 vintage; and so on. We do this using the publicly available concordances from the Census Bureau; this is straightforward when the concordances feature simple one-to-one industry code changes or industry codes that are combined from one vintage to another, but in cases where a single industry code splits into multiple codes we cannot adjust the vintage. This approach modestly—but nontrivially—improves match rates between Census and Compustat industries. Our detailed match rate—the share of all Economic Census industries that find matches in the adjusted Compustat data—ranges from about 58 percent for 2007 to about 75 percent for 1997; sales-weighted match rates are higher and range from 83 percent (for 2017) to 92 percent (for 1997). Return to text
6. We start this analysis in 2002 instead of 1997 because HHI is not available for all industries in the 1997 Economic Censuses. Return to text
7. An important caveat must be noted here: Economic Census data feature time-varying NAICS code vintages such that some data are lost when computing changes within industries. We first attempt to harmonize all 6-digit codes to the 2007 vintage; still, in comparisons for the 2002-2017 change, we lose roughly one-fourth of industries at the 4-digit NAICS level, roughly one-half at the 5-digit level, and roughly two-thirds at the 6-digit level. Return to text
8. We use BEA gross output by industry detail tables, table UGO305, at https://apps.bea.gov/industry/Release/XLS/UGdpxInd/GrossOutput.xlsx. Return to text
9. HHI calculations are analogous, with firm market shares calculated as firm Compustat sales divided by BEA industry sales. Note that BEA industry categories do not neatly follow NAICS industry detail categories but instead consist of industries that correspond to NAICS codes at varying levels of detail. We construct concentration ratios at the most detailed level possible in BEA concordances mapping BEA industries to NAICS codes, which allows for about 300 industries. Return to text
10. For 2017, the unweighted mean across industries is 72 percent with an interquartile range from 6 percent to 76 percent (this share was generally lower in past years). The share is below 1 percent in many industries. Comparisons between Compustat sales and Economic Census sales are broadly similar to these BEA comparisons. In particular, in 2017 Compustat sales account for roughly half of Economic Census sales overall, but this share varies widely across narrow industries. The unweighted mean share among 6-digit industries is 78 percent in 2017 (though lower in prior years), with a similar interquartile range as in the BEA comparisons. Return to text
11. Mismeasurement of industry sales arising from scope differences, potentially including both foreign sales and industry misclassification for multi-establishment firms, is readily apparent in the data. In BEA-defined industries, we find that total sales as reported in Compustat exceed total BEA-reported sales in one-fifth of industries, despite Compustat lacking many (privately held) firms. In about one-tenth of industries, Compustat sales are more than double BEA sales, and a few industries feature Compustat sales that are more than ten times BEA sales. These comparisons are broadly similar for Economic Census sales instead of BEA sales. If Compustat sales data were measured with the same scope and concepts as BEA and Census sales data, no industry would show higher Compustat sales than BEA or Census sales. This problem is manifest in our various BEA-enhanced concentration ratios, with many industries seeing top-4 and top-8 firm shares above 100 percent and HHIs above 10,000. Return to text
12. We note that this reduced-form approach features serious conceptual problems (see, e.g., Demsetz 1973; for more recent—and accessible—discussion see Albrecht 2022). Both concentration and prices are endogenous to broader market, technological, and managerial factors and are ultimately determined jointly in equilibrium. Moreover, careful attention to market definitions—which likely do not neatly correspond to 6-digit industry codes—is necessary for evaluation of the state of competition and market power. Our purpose is only to illustrate how concentration measurement choices can affect estimated empirical relationships. Return to text
13. The published table from which we obtain data is called Table 11. The November 2022 PPI detailed report is available at https://www.bls.gov/ppi/detailed-report/ppi-detailed-report-november-2022.xlsx. We (multiplicatively) seasonally adjust the industry-level PPI series, but omitting this seasonal adjustment step matters little for results. Return to text
14. We calculate the log difference of end-period PPI versus beginning-period PPI, divided by the number of months included and multiplied by 100. Return to text
15. Compustat data for 2017. The situation is only marginally better at the 5-digit level, where 75 percent of industries have eight or fewer firms and 60 percent of industries have four or fewer firms. At the 4-digit level, 60 percent of industries have eight or fewer firms and 35 percent of industries have four or fewer firms. The mean industry firm count is 21, 12, and 8 at the 4-digit, 5-digit, and 6-digit levels, respectively; medians are much lower. Importantly, sales-weighted means are significantly higher (e.g., the sales-weighted mean of 6-digit industries has 50 firms). Still, though, 25 percent of Compustat sales are accounted for by 6-digit industries with 6 firms or fewer, 5-digit industries with 8 firms or fewer, and 4-digit industries with 13 firms or fewer. Return to text
16. Our description here refers to top firm share concentration ratios, but it is broadly true for HHIs as well, though perhaps to slightly lesser extent; with only a subset of firms and industry sales, there is no reason to expect HHIs to be accurate in Compustat data. Return to text
17. In Census Bureau parlance, an establishment is a single operating location of a business, while a firm is a collection of one or more establishments under common ownership or operational control. This distinction is critical in the present context: publicly traded firms tend to be large and, therefore, may often be active in multiple industries, but the main Compustat datasets assign only one industry code to each firm (and segment files apply only a few additional industries). Counting all sales of a multi-industry firm in a single industry can lead to error in both the identification of an industry's top firms and the measurement of total industry sales. Return to text
Decker, Ryan A., and Jacob Williams (2023). "A note on industry concentration measurement," FEDS Notes. Washington: Board of Governors of the Federal Reserve System, February 03, 2023, https://doi.org/10.17016/2380-7172.3256.
Disclaimer: FEDS Notes are articles in which Board staff offer their own views and present analysis on a range of topics in economics and finance. These articles are shorter and less technically oriented than FEDS Working Papers and IFDP papers.