FEDS Notes
September 08, 2023
A Sourcing Risk Index for U.S. Manufacturing Industries
Andrea De Michelis and Mariano Somale1
Introduction
Modern manufacturing production is organized in complex global value chains (GVCs), whereby the production process of a good is split into multiple stages across many countries and sectors. By allowing producers to specialize in a narrow set of tasks according to their comparative advantage, GVCs have brought significant productivity gains. However, as highlighted by the COVID-19 pandemic and Russia's war against Ukraine, participating in GVCs also entails risks as access to foreign inputs of production can depend on developments abroad. For example, firms that rely more on foreign inputs are more exposed to disruptions in global transportation networks and to risks arising from reliance on inputs produced by geopolitical rivals. In addition, some GVCs exhibit a high geographical concentration of suppliers for some inputs, so even local shocks can have a disproportionate effect on downstream producers across the globe. Moreover, lack of access to critical and hard to substitute inputs can lead to major production disruptions, so the risks faced by a firm could be high even when only a limited number of its inputs are affected by these vulnerabilities.
In this note, we quantify the risks to U.S. manufacturing industries arising from their reliance on inputs form foreign suppliers. Specifically, we develop a sourcing risk index that examines risks to input access across three dimensions: general exposure to foreign shocks (such as disruptions in global transportation networks), geopolitical risks, and geographical concentration of suppliers. As some inputs can be critical and hard to substitute, we use the index to assess the risks that the sourcing of each intermediate input poses to each industry.
The Complex Structure of Global Value Chains
Assessing a firm's reliance on imported inputs requires accounting for both direct imports of inputs by firms as well as any indirect dependence through domestic input suppliers, in turn, importing part of their inputs. As illustrated by the left panel of figure 1, a firm's gross output can be decomposed into value added, which includes the contribution of labor and capital, and of intermediate inputs, which include semi-finished goods and raw materials, that are purchased from domestic suppliers or are imported. Accordingly, a firm relies on foreign intermediate inputs directly through its own imports (the darker blue box in the diagram) and indirectly through foreign inputs that are used to produce domestic inputs (the lighter blue box).
To quantify total reliance of U.S. manufacturers on imported inputs, both direct and indirect, we use the 2023 release of the Bureau of Economic Analysis (BEA) Input-Output (I-O) tables.2 These tables divide the universe of U.S. firms into 138 industries, of which 37 belong to the manufacturing sector. For each of these industries, information is available on gross output, value added, and expenditure on intermediate inputs, with the latter broken down by input type and region of origin. In addition, the tables also provide the same detailed information on the supplying industry for domestically sourced inputs, allowing us to compute the chain of indirect imports that are illustrated in the left panel of figure 1. Although the data are available at an annual frequency through 2021, the analysis uses 2019 as a benchmark year to compute the dependence on foreign inputs in order to alleviate concerns related to unusual consumption and production patterns induced by the pandemic.
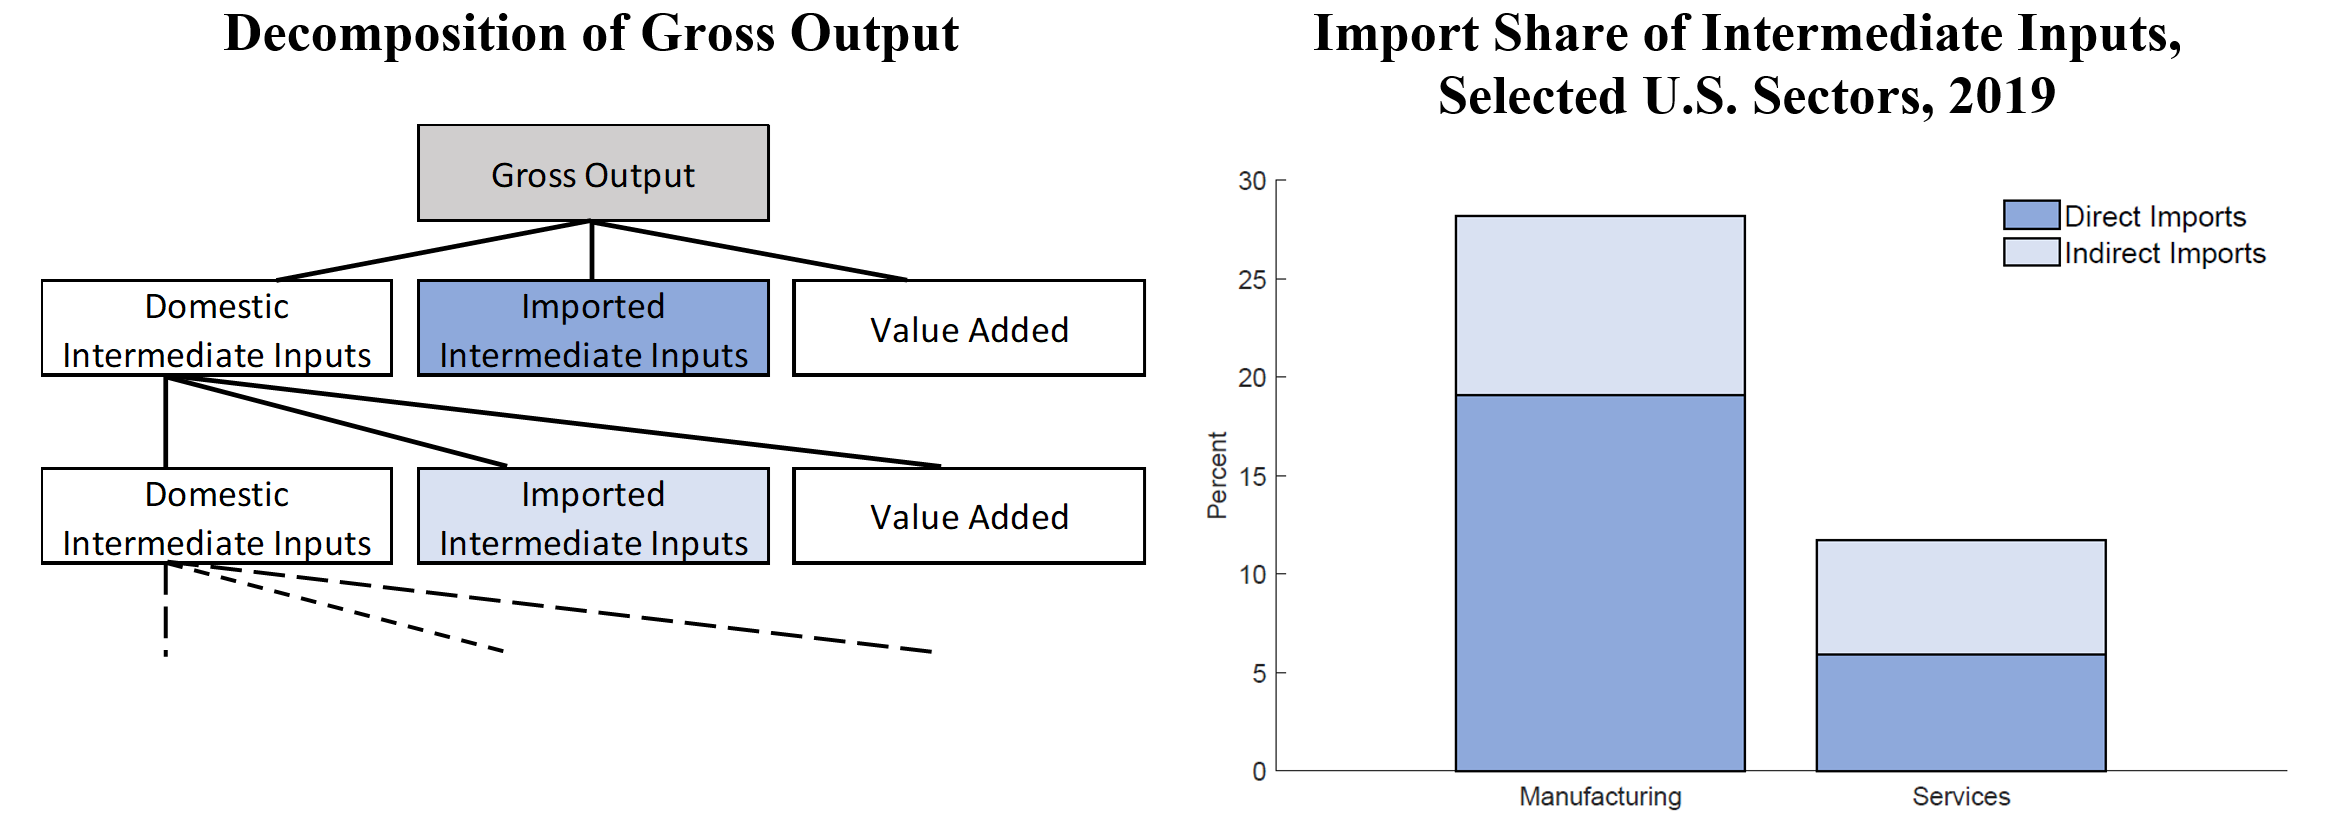
Note: Intermediate inputs of an industry are the goods and services (including energy, raw materials, semi-finished goods, and services that are purchased from all sources) that are used in the production process to produce other goods or services rather than for final consumption. Legend entries appear in graph order from bottom to top.
Source: Bureau of Economic Analysis; authors' calculations
For U.S. manufacturing and services sectors, the right panel of figure 1 shows the import share of intermediate inputs, a summary static for total foreign input reliance. Nearly one-third of intermediate inputs used to manufacture goods in the U.S. originate from abroad, with indirect imports representing a non-trivial portion. By contrast, the service sector relies much less on foreign inputs, with an import share of about 10 percent, about half of which is indirect imports. Given its higher dependence on foreign inputs, our analysis focuses on the manufacturing sector.
Three Important Sources of GVC Risks for U.S. Manufacturing Industries
Industries with a higher share of imported inputs are more likely to experience production disruptions from shocks that limit their access to foreign inputs, such as disruptions to global transportation networks. For example, the massive logistic hurdles seen in the wake of the COVID-19 pandemic together with a surge in global goods demand had significant knock-off effects on U.S. production.
As shown in figure 2, the import share of intermediate inputs varies notably by manufacturing industry. For example, pharmaceuticals source over 50 percent of their inputs from abroad whereas food production's import share is below 20 percent. Notably, three of the top five most imported input-dependent industries—heavy trucks, light trucks, and automobiles—are part of the motor vehicles sector, consistent with the many difficulties this sector encountered in securing inputs in the aftermath of the pandemic.3
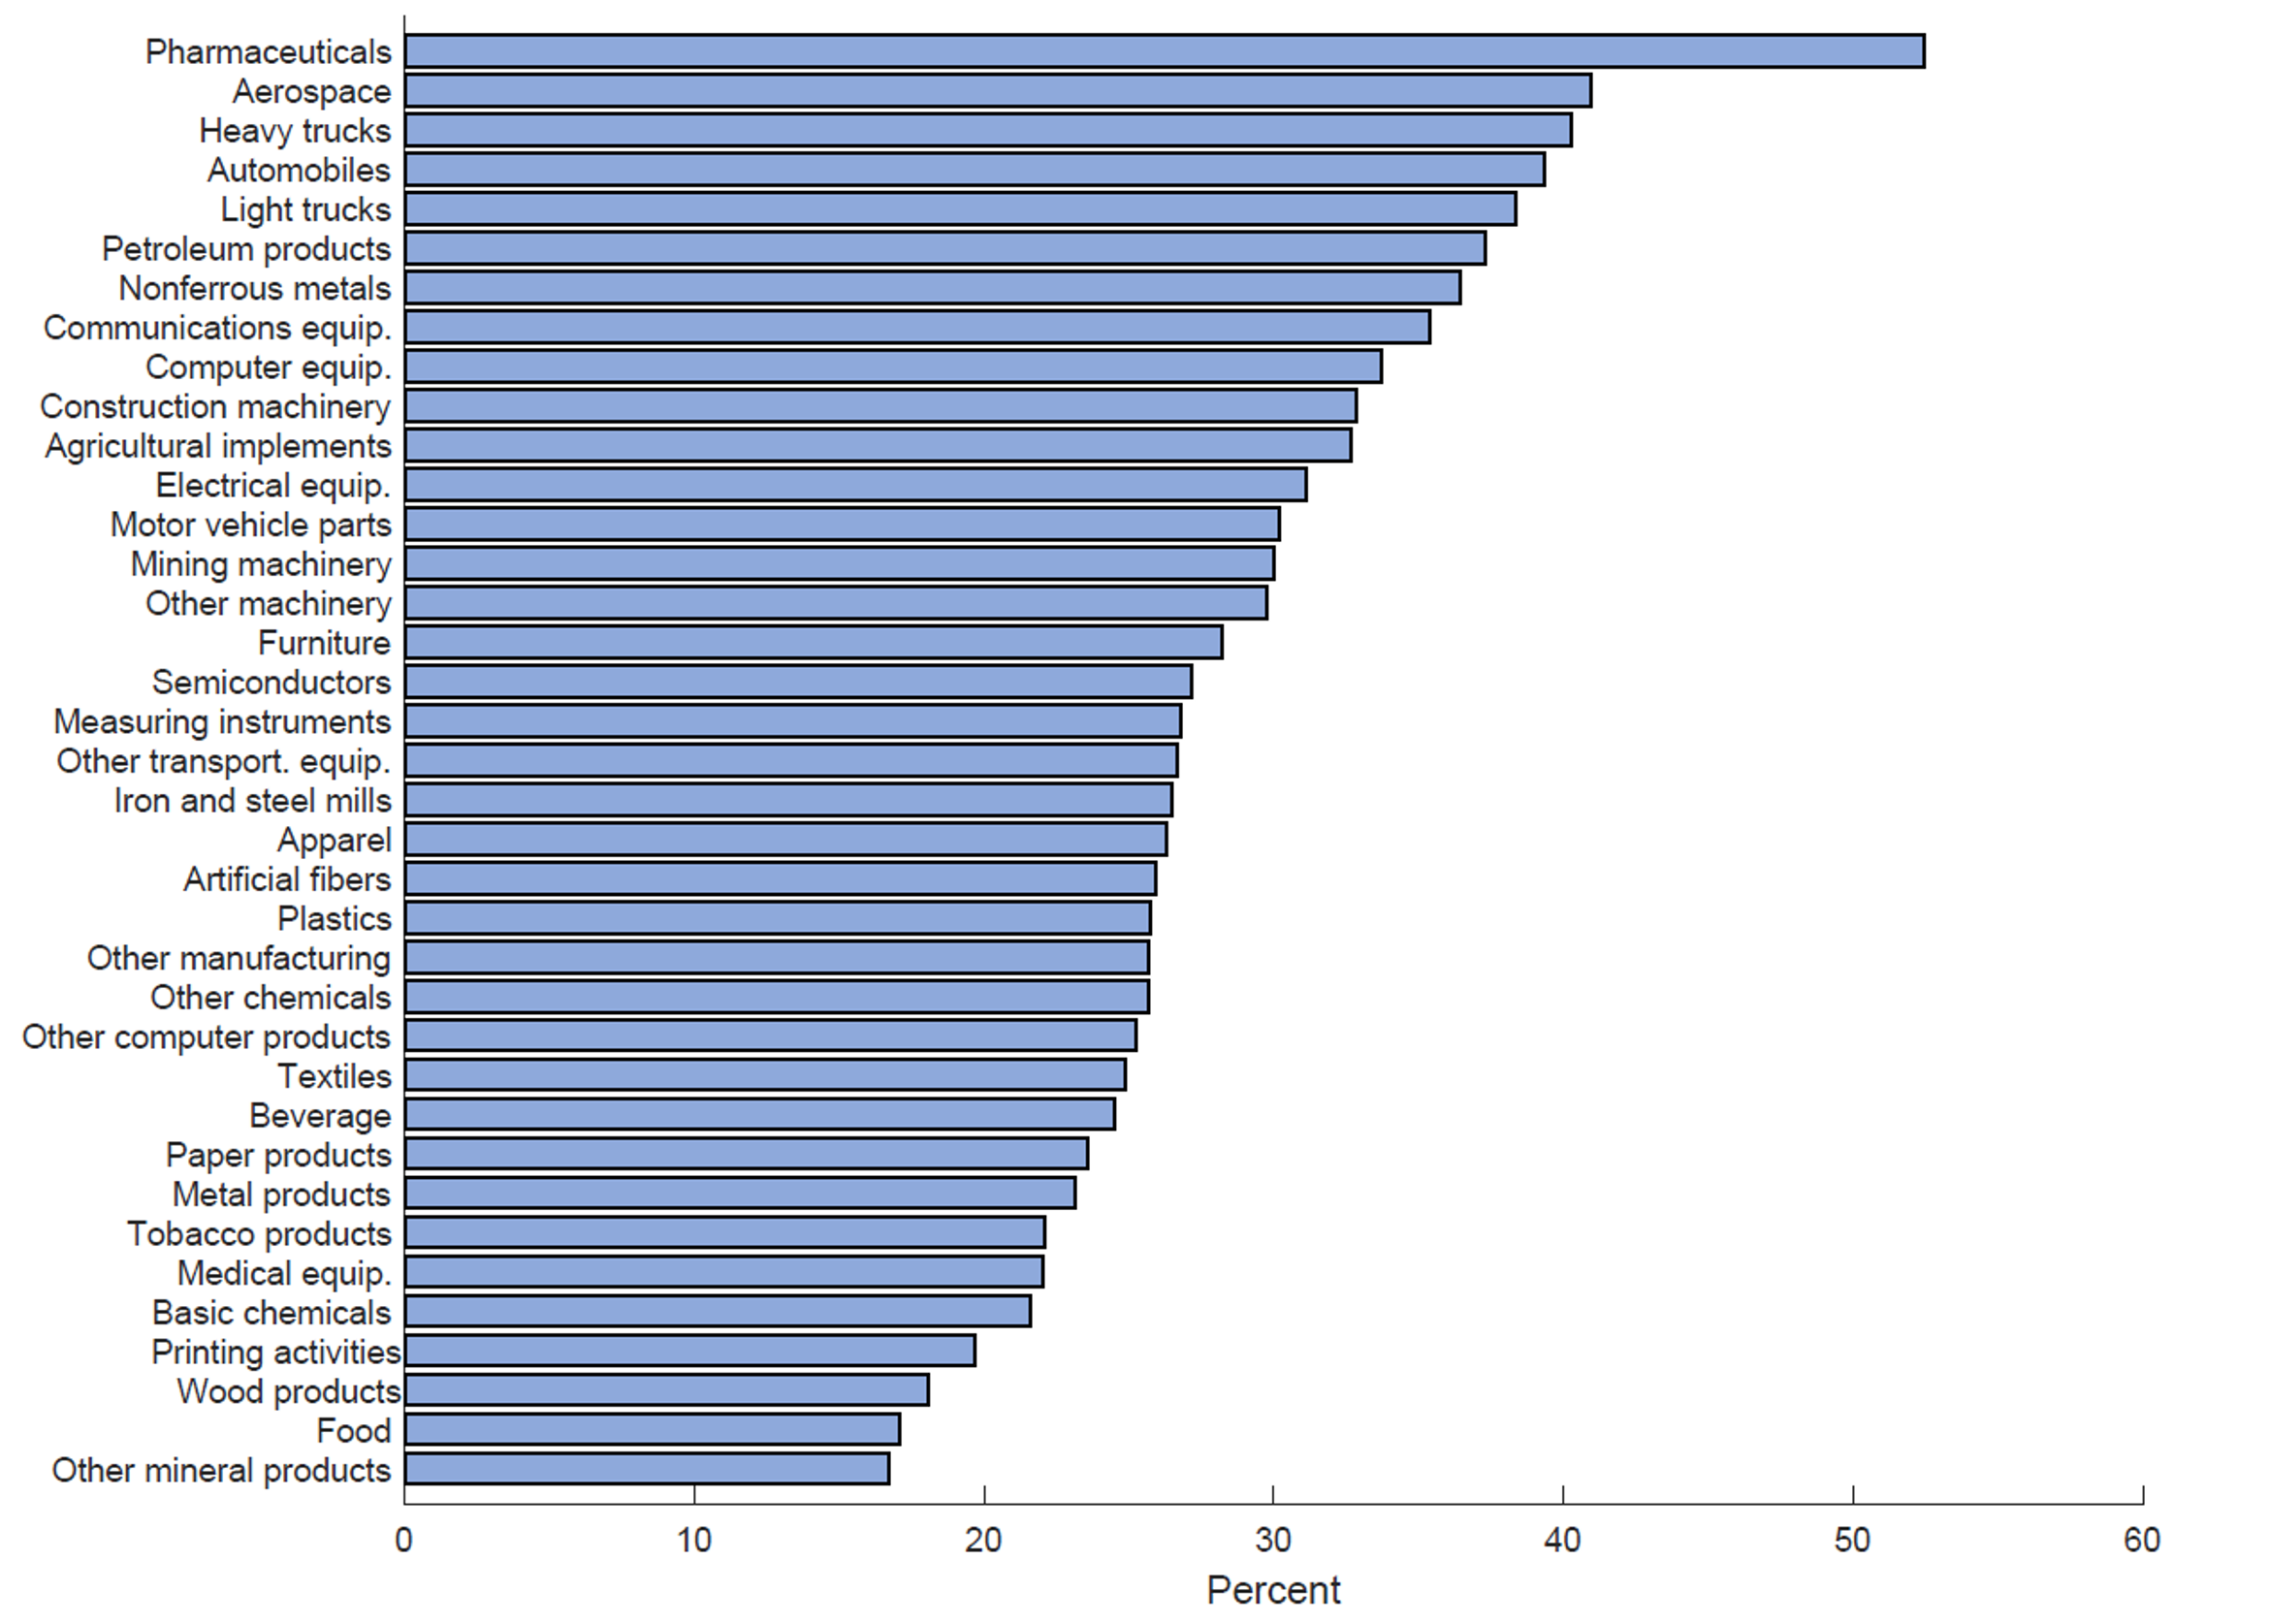
Note: Intermediate inputs of an industry are the goods and services (including energy, raw materials, semi-finished goods, and services that are purchased from all sources) that are used in the production process to produce other goods or services rather than for final consumption. Legend entries appear in graph order from bottom to top.
Source: Bureau of Economic Analysis; authors' calculations
Sourcing from abroad also entails risks emanating from geopolitical developments and supplier-concentration. Geopolitical risks reflect exposure to potential actions by geopolitical rivals that could affect U.S. firms' access to intermediate inputs, such as restrictions by these rivals on their own exports to the United States as well as political and other types of pressures to restrict the exports from other countries to the United States. Regarding concentration risks, a firm may find itself with limited sourcing alternatives if a shock hits a region where most of its suppliers are located. Accordingly, when industries exhibit high regional concentration of suppliers, even regional level foreign shocks can have a disproportionate effect on U.S. production.
Figure 3. Import Share of Intermediate Inputs by Region of Origin, Selected U.S. Manufacturing Industries, 2019
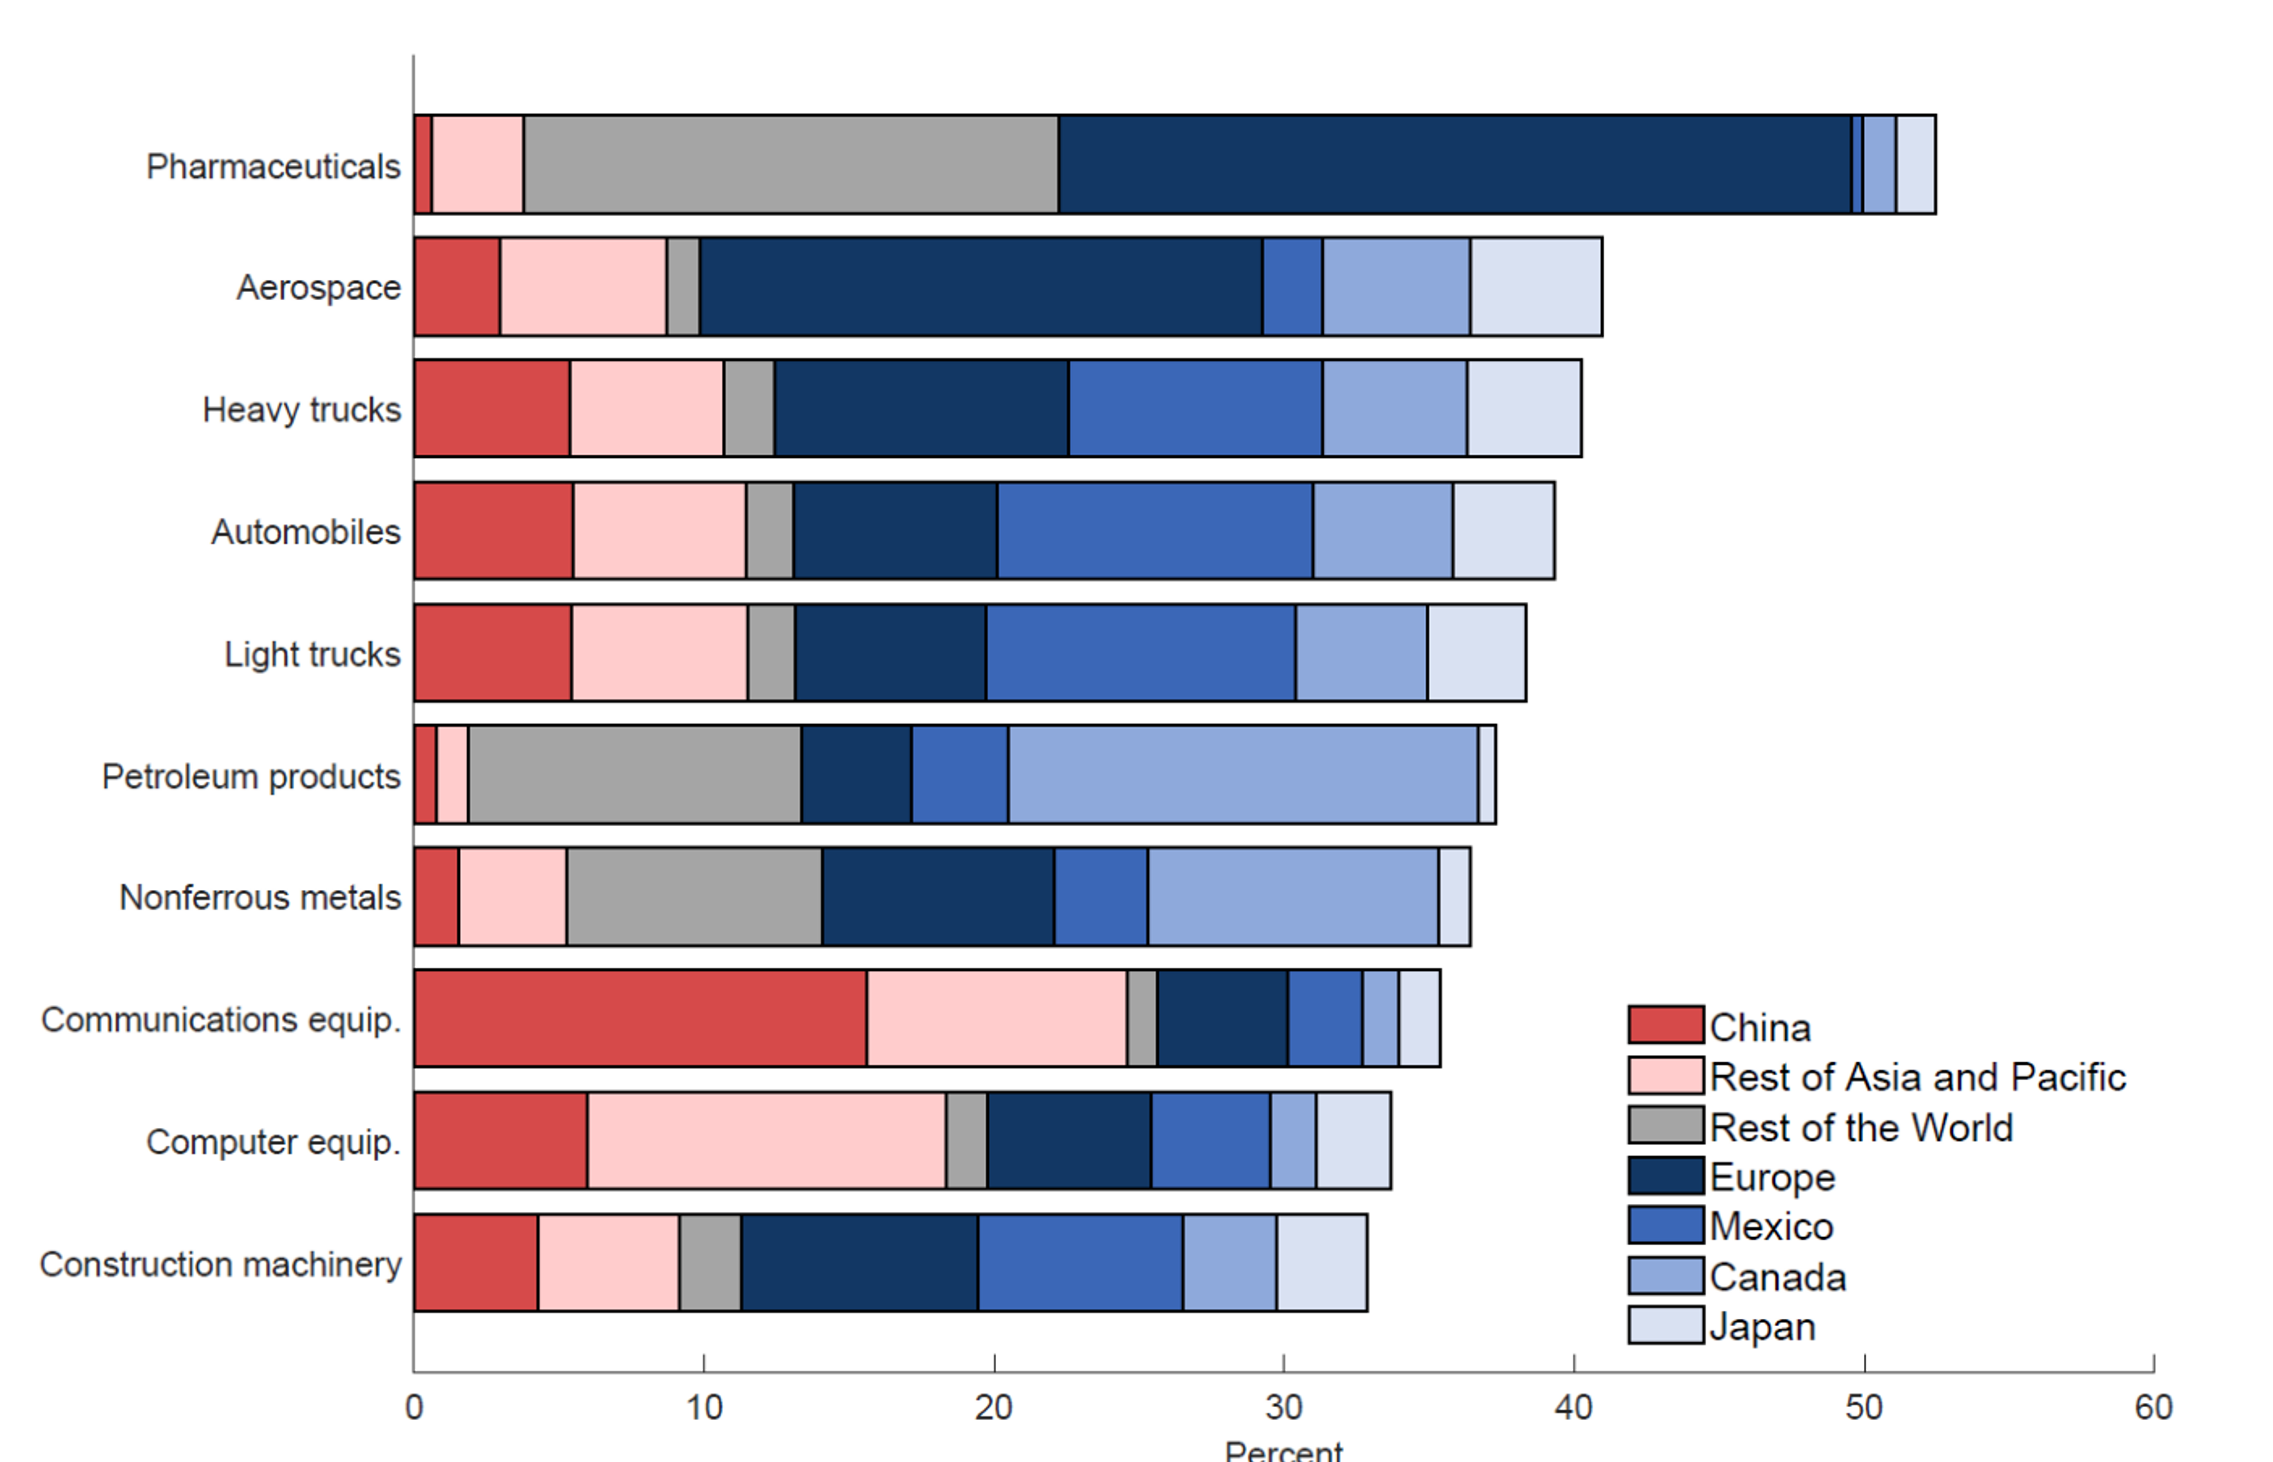
Note: Legend entries appear in graph order from left to right. Blue shadings are not meant to rank countries by the strength of their alliance with the United States.
Source: Bureau of Economic Analysis; authors' calculations.
Figure 3 divides the share of imported inputs of each of the top-ten imported input-dependent U.S. manufacturing industries shown in figure 2, into regions where they come from.4 We use the seven regions of origin available in BEA data–Canada, Mexico, Europe, Japan, China, Rest of Asia and Pacific, and Rest of the World. It is evident that the regional distribution of sourcing differs significantly by industry, implying different degrees of supplier-concentration and geopolitical risks. For the former, we consider supplier-concentration risks to be higher, the fewer the colors that dominate a bar. For the latter, we assess geopolitical risks following our reading of recent developments, such as the rise in tensions between the U.S. and China, as well as academic studies, such as Bailey et al (2017) which develops measures of geopolitical distance across countries based on United Nations voting data.5 The colors of the bars of figure 3 reflect our assessment of geopolitical risks. We assess risk to high when inputs are sourced from China (in red) and the Rest of Asia and Pacific (in pink), a region under significant economic and geopolitical influence from China. We assume that sourcing from the Rest of World (in grey) entails relatively medium levels of risks, as many regions within this aggregate, such as South America, do not show a clear geopolitical alignment with the U.S. or China. We judge geopolitical risks to be low when inputs are sourced from Europe, Mexico, Canada, or Japan (in shades of blue)6. For simplicity, in the rest of this note, we refer to Europe, Mexico, Canada, and Japan as U.S. "allies" but this groping is not exhaustive as there are other countries with close political ties with the United States.
Several features from figure 3 stand out. U.S. production of communications equipment relies heavily on inputs from China and Rest of Asia and Pacific, sources little from allies and shows relatively low sourcing diversification across regions (the red and pink bars dominate), making it vulnerable to geopolitical shocks as well as shocks to emerging Asia where most of the suppliers are concentrated. By contrast, motor-vehicles industries source inputs more safely on average, with lower sourcing from China and Rest of Asia and Pacific, high sourcing from allies (shades of blue dominate), and high geographic diversification (no specific colors dominate). Finally, the sourcing of inputs by the pharmaceuticals industry exhibits low geopolitical risks but more significant supplier concentration risks from shocks to Europe.
The Importance of Assessing the Sourcing Risks Posed by each Intermediate Input
An industry-level analysis, however, may significantly underestimate the risks of sourcing certain intermediate inputs. As exemplified by the effect of the semiconductor shortages on the motor-vehicles sector during the post-pandemic recovery, production can be severely disrupted by lack of certain inputs for which there are few substitutes, even when these inputs represent a small share of total production costs. Accordingly, sourcing such critical inputs from locations that may be considered riskier disproportionally affects the overall sourcing risks faced by an industry.
We illustrate these ideas focusing on the automobile industry, highlighting that the sourcing risks faced by firms in this industry are higher than what the industry-level input sourcing patterns in figure 3 would suggest. For the automobile industry, figure 4 decomposes total (both domestic and foreign) intermediate inputs by selected type of input product. Inputs of semiconductors (in dark blue) represent only 5 percent of the value of total intermediate inputs, but they are hard to substitute, as underscored by the repercussions of their shortages in 2021 and 2022.
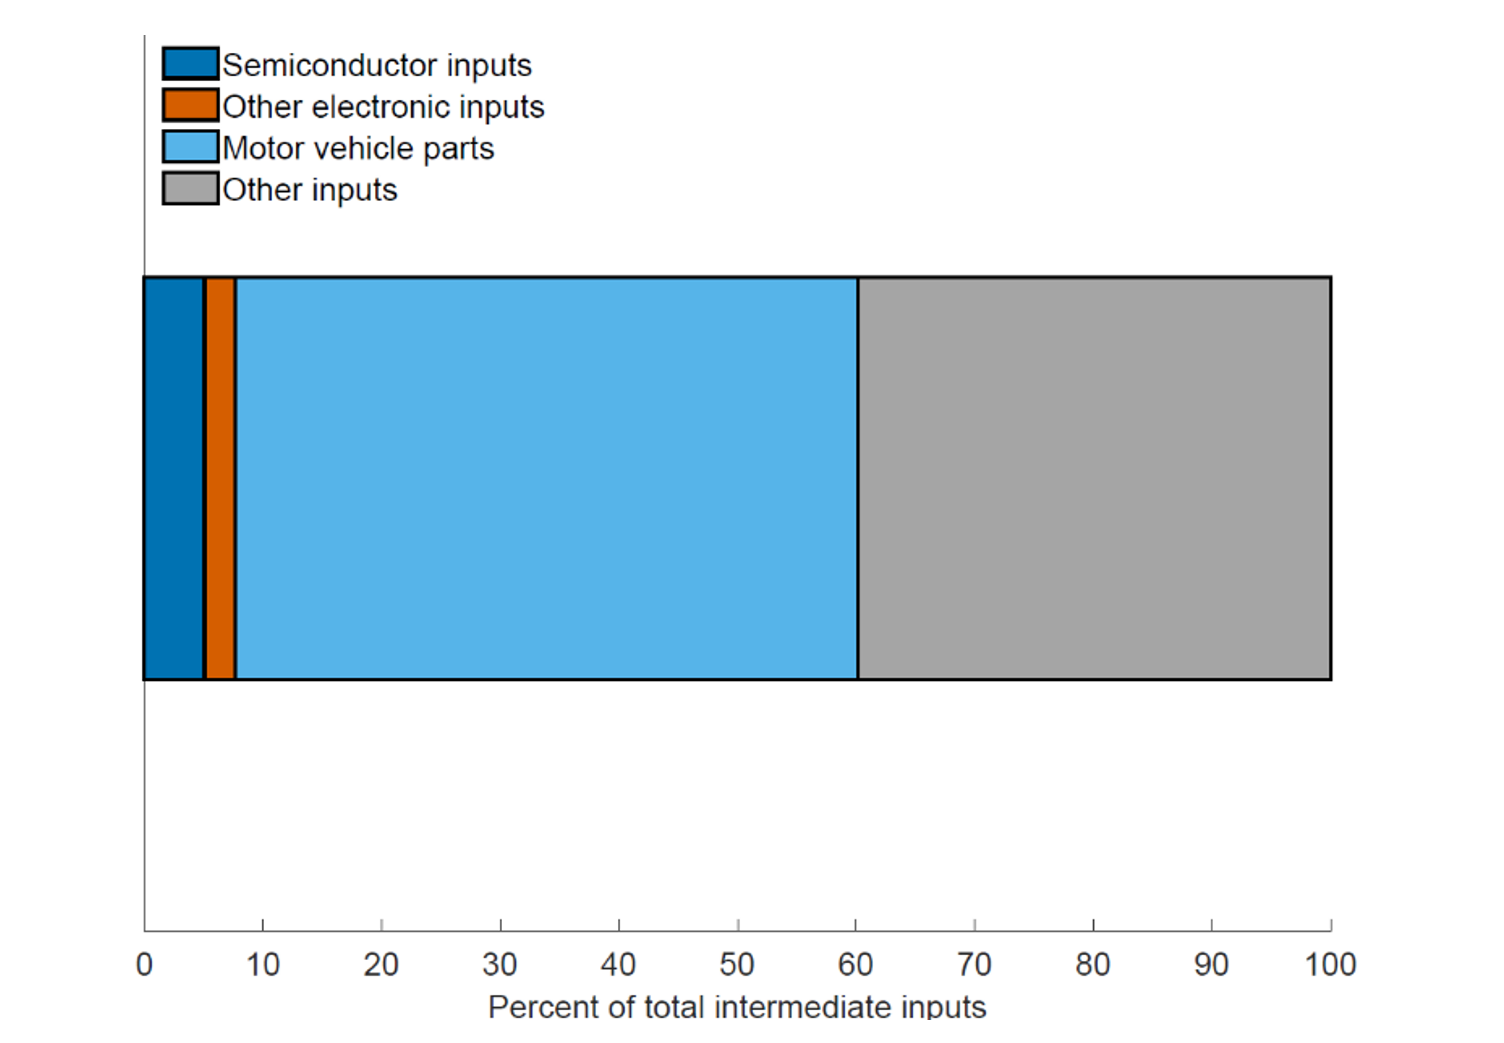
Note: Total intermediate inputs includes both domestic and foreign. Legend entries appear in graph order from left to right.
Source: Bureau of Economic Analysis, authors' calculations.
Even though the industry-level (across all inputs) sourcing patterns in figure 3 suggest that sourcing risks are not high for the automobile industry, this industry sources a critical input, semiconductors, from relatively few and riskier locations. Indeed, as shown by the left pie chart on figure 5, the industry exhibits significant sourcing of semiconductor inputs from China and Rest of Asia and Pacific, negligible sourcing from allies, and low geographic diversification (with Taiwan and Korea accounting for much of the pink slice). Other electronic inputs for this industry, such as computer equipment, exhibit even higher sourcing risks, with a very low domestic share (the white slice in the pie) and very high shares from China and Rest of Asia and Pacific. By contrast, motor vehicle parts (such as bumpers and engines) appear to be sourced mostly domestically or from locations with low geopolitical risk, with significant diversification across these regions. This case study illustrates the importance of assessing the risks that the sourcing of each intermediate input poses to each industry.
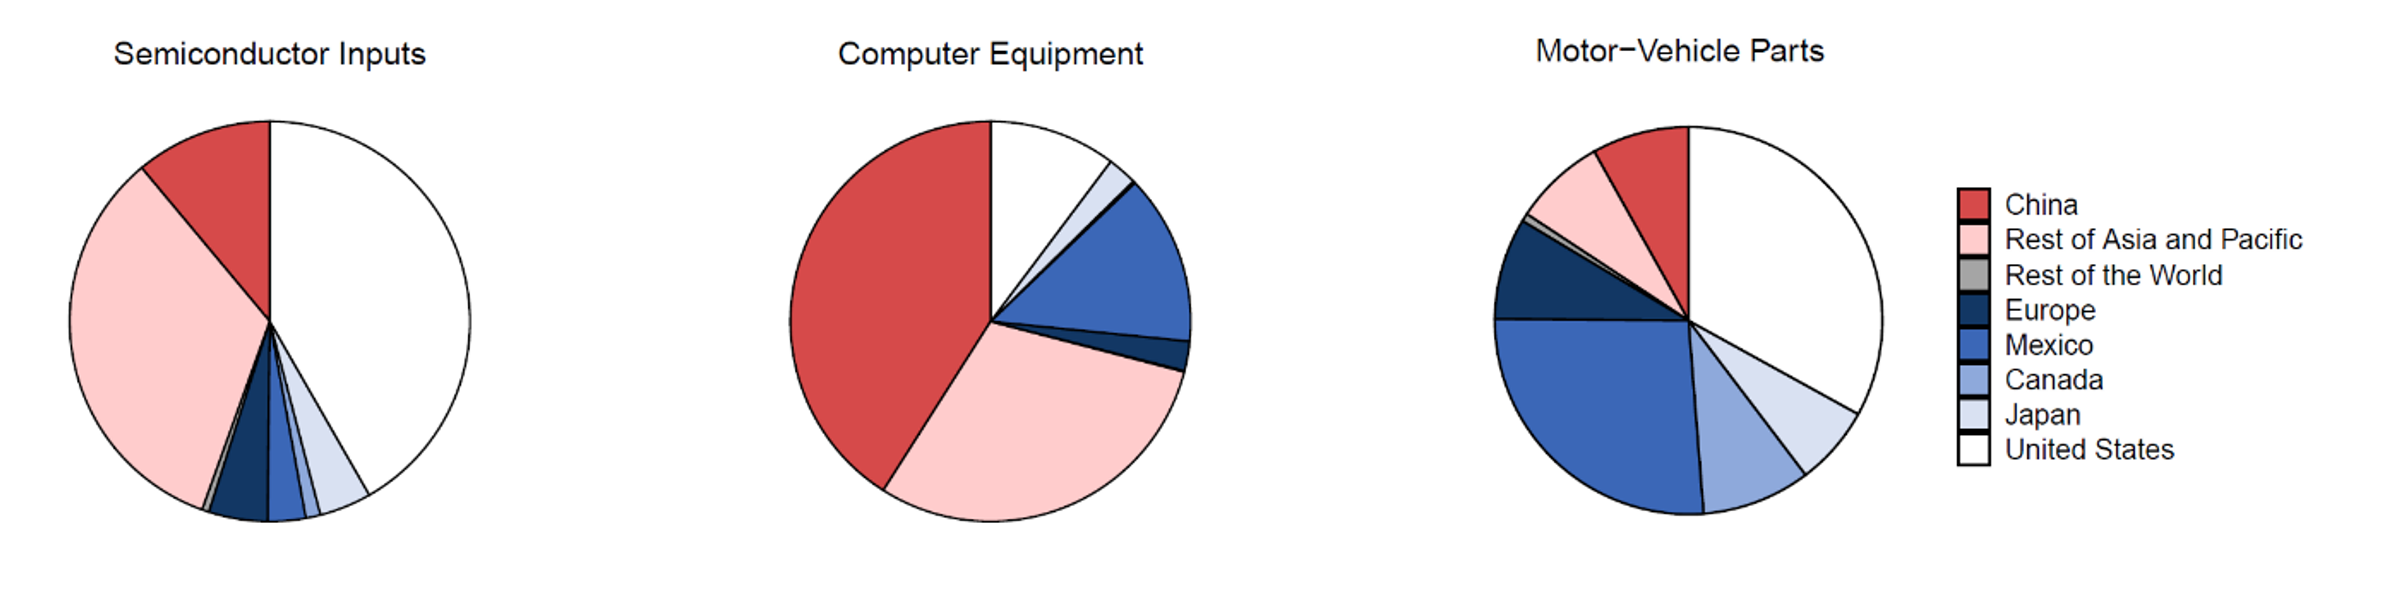
Note: Legend entries appear in counterclockwise chart order.
Source: Bureau of Economic Analysis; authors' calculations.
A Sourcing Risk Index for Inputs of U.S. Manufacturing Industries
In this section we quantify the risks that the sourcing of each intermediate input poses to each industry, i.e. we quantify the sourcing risks associated to each industry-input pair in the data. Specifically, we develop a sourcing-risk index that reflects the three risk factors discussed above—geographical concentration of suppliers, geopolitical risks, and general exposure to foreign shocks—and compute its value for each industry-input pair in our sample. Of note, we restrict our attention to industry-input pairs corresponding to manufacturing industries and inputs of manufactured goods and commodities.

Note: The histograms in the figure show the distribution of the Sourcing Risk Index (SRI) and its subcomponents across industry-input pairs. The supplier-concentration risk (top left panel) of each industry-input pair is quantified according to the Herfindahl-Hirschman Index (HHI), with higher HHI values indicating higher concentration. The geopolitical risk (top right panel) of each pair depends positively on the sourcing share from China and the Rest of Asia and Pacific, negatively on the sourcing share from allies and the U.S., and is neutral with respect to the sourcing share from the Rest of the World. The SRI value for each industry-input pair (bottom right panel) is computed as a weighted average of its three subcomponents normalized by their standard deviations. Following the order in the figure, the weights of SRI subcomonents are 3/6, 2/6 and 1/6. In our calculations, we consider inputs that represent at least 0.075 percent of the industry's gross output. Legend entries appear in graph order top to bottom.
Source: Bureau of Economic Analysis; authors' calculations.
Supplier-concentration risks are quantified according to the widely-used Herfindahl-Hirschman Index (HHI), with higher HHI values indicating more concentration. The top-left panel of figure 6 shows the distribution of HHI values across industry-input pairs in our sample, where the height of each bar indicates the number of pairs with HHI values in the range delimited by the left and right edges of the bar7 The distribution is skewed to the right, with a relatively fat right tail that gradually thins as HHI values increase. Industry-input pairs exhibiting high geographic concentration of suppliers largely reflect inputs that are mostly sourced domestically, such as agricultural inputs, printing activities and some type of chemicals used as inputs by some U.S. manufacturing industries.
To assess risks related to sourcing from geopolitical rivals, we construct a measure of geopolitical risk that increases on the sourcing share from China and the Rest of Asia and Pacific, decreases on the sourcing share from the U.S. and its allies, and is neutral with respect to the sourcing share from the Rest of the World. As shown in the top-right panel of figure 6, the distribution of this measure across industry-input pairs is for the most part largely concentrated around its modal value, with a relatively thin right tail of industry-input pairs exhibiting very high geopolitical risk. This right tail is largely accounted for by industry-input pairs involving electronic inputs—which include semiconductors, computer, and communication equipment—and inputs of electrical equipment, with some of the few remaining pairs reflecting inputs of apparel and furniture (not shown).
Finally, we use the import share for each industry-input pair as a proxy for the industry's overall exposure to other types of foreign shocks that could limit its access to foreign inputs, such as disruptions to global transportation networks. As shown in the bottom-left panel of figure 6, the distribution of import shares is roughly symmetric. As in the case of geopolitical risks, electrical equipment inputs and electronic inputs account for a significant fraction of the industry-input pairs at the higher end of the distribution. In addition, inputs of motor-vehicle parts and non-mining machinery also tend to be sourced significantly from abroad.
We combine these three risk factors—geopolitical, supplier concentration and general exposure to foreign shocks—into a Sourcing-Risk Index (SRI) that quantifies the overall sourcing risks associated to each industry-input pair. Specifically, the SRI is computed as a weighted average of our three risk measures normalized by their standard deviation.8 In our baseline specification, we assign the largest weight to geopolitical factors (1/2), with supplier-concentration factors receiving a somewhat smaller weight (1/3). In comparison, we assign a relatively small weight (1/6) to import shares.
The weights attributed to each risks factor reflect our assessment of their relative importance in light of recent developments and of the academic literature exploring some of these factors. We place geopolitical factors at the top of our list, as Russia's war against Ukraine has led to a major shift in the geopolitical landscape.9 Indeed, according to Goldberg and Reed (2023), national security concerns amid heightened geopolitical tensions may provide the best argument to date for rethinking globalization. Supplier-concentration risks also receive a significant weight in our index, as recent evidence indicate they affect the ability of firms to secure inputs following a shock.10 We assign the smallest weight to import shares as some of the risks associated with high reliance on foreign inputs are already captured by the geopolitical-risk component.11
As shown in the bottom-right panel of figure 6, the distribution of SRI values across industry-input pairs suggests that in most cases U.S. manufacturing industries source intermediate inputs relatively safely, but also that there is a thin right tail—accounting for less than 15 percent of the industry-input pairs—exhibiting very high sourcing risk. This right tail is largely accounted for by industry-input pairs involving electronic inputs and inputs of electrical equipment, in line with the current focus on the sourcing of electronic inputs in policy and public circles because some of these inputs, e.g. semiconductors, are regarded as critical.12
This analysis is subject to some limitations. The main limitation we see is related to the level of disaggregation in terms of industries and foreign regions available in the BEA data. A finer level of industry and input disaggregation could reveal even higher levels of sourcing risks for some industry-input pairs, while a finer disaggregation of foreign sourcing regions would permit a better assessment of geopolitical and supplier-concentration risks. For example, we are not able to quantify the risks posed by semiconductors produced in Taiwan to U.S. industries.13
Identifying Industries with Higher Sourcing Risks
We now turn to the question of which industries exhibit higher sourcing risks. To answer this question, we need to aggregate the SRI values for industry-input pairs into a measure of sourcing risk at the industry level. We propose a measure of industry-level (tail) sourcing risks that focuses only on the riskiest inputs of each industry, that is, it focuses on the industry' tail sourcing risk. Specifically, we define an industry's sourcing tail risk as the weighted average of the SRI values of its inputs—with costs shares as weights—but that includes only the riskiest inputs that represent a combined 5 percent of the industry's gross output.
The rationale behind our index is the following. The case of the automobile industry discussed earlier suggest that simply averaging SRI values across inputs according to their costs shares may underestimate the sourcing risks faced by an industry, as risks can be concentrated in critical inputs that do not represent a high share of costs. Ideally, we would like to combine SRI values with some measure capturing how critical inputs are in production. In the absence of such a measure, we think that our tail risks measure partially addresses the problem posed by critical inputs. In particular, if an industry sources a critical input in a very risky way, its sourcing tail risks will be high even if that input does not represent a large share of production costs. As such, our measure will correctly identify that industry as facing higher sourcing risks. That said, our measure of tail risks could lead to false positives if the inputs driving the industry's tail sourcing risks are particularly easy substitute in production or alternative sources are readily available. Put another way, our tail-risk measure can be thought of as an upper bound of an industry's sourcing risk.14 And, given that we know what the particular inputs are that are driving the tail sourcing risks, interpretative judgments can be made on how critical these inputs are for particular industries.
Figure 7 shows the ten manufacturing industries exhibiting riskiest sourcing, with our measure of industry sourcing tail risk broken down into the contributions of each risk factor (left panel) and of selected groups of inputs (right panel). By focusing on the riskiest inputs, our measure identifies the automobile industry among those facing the highest sourcing risks, even though this industry sources inputs relatively safely on average (figure 3). Indeed, consistent with the earlier case-study of the automobile industry, this analysis finds that automobile producers face high sourcing risks stemming from geopolitical factors (the pink bar in the left panel) associated with their sourcing of electronic inputs, especially of semiconductors (the dark green bar in the right panel).
Other industries of interest facing high sourcing risks include the aerospace, light-truck, and computer equipment industries, with similar sources of risks in terms of risks factors and inputs. Finally, the top three industries are somewhat special cases and of less national security concern. The sourcing risks faced by the U.S. furniture and apparel industries reflect their high dependence on inputs of furniture and apparel parts from China, while those faced by the beverage industry reflect high reliance on inputs of food products from the Rest of Asia and Pacific region.
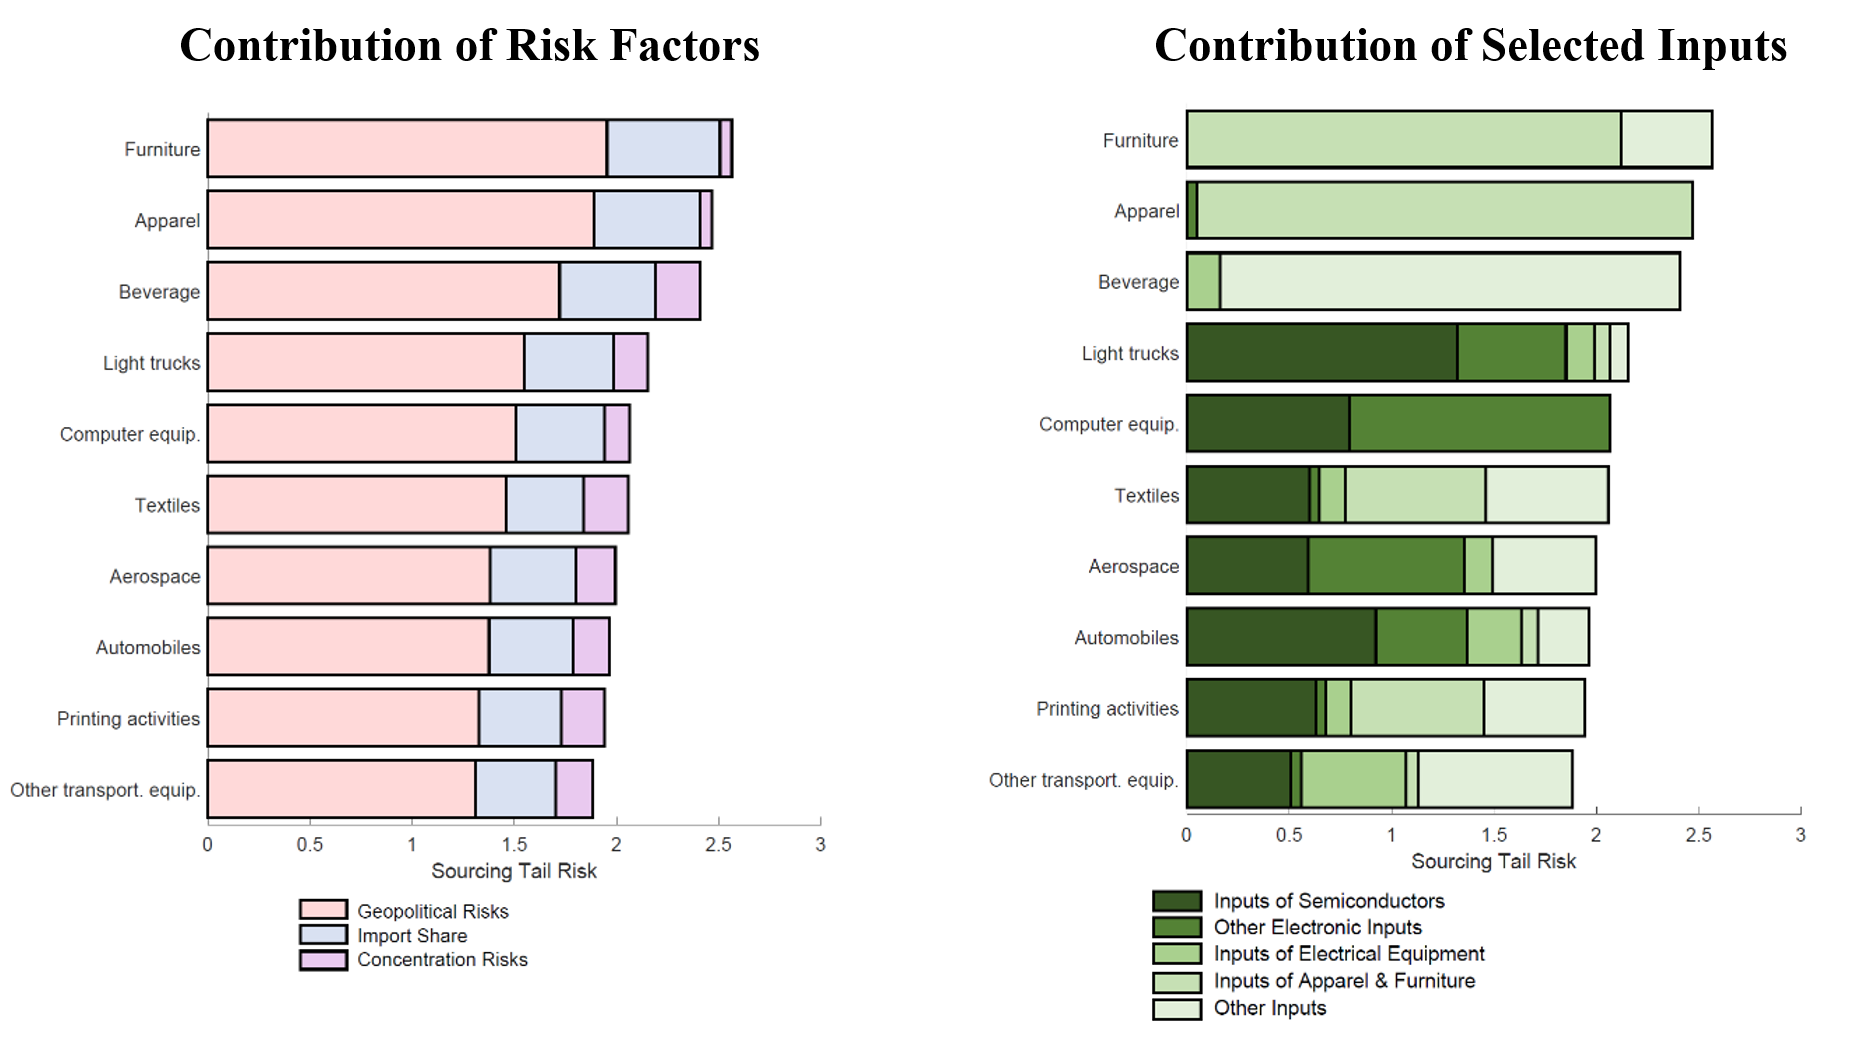
Note: The figure shows the ten manufacturing industries exhibiting highest sourcing risk. An industry's sourcing tail risk is defined as the weighted average of the SRI values of its inputs—with costs shares as weights—but that includes only the riskiest inputs that represent a combined 5 percent of the industry's gross output. The left panel shows the contribution of the risk factors considered in our analysis while the right panel shows the contribition of selected groups of intermediate inputs. Legend entries appear in graph order left to right.
Source: Bureau of Economic Analysis; authors' calculations
References
Bailey, Michael A., Anton Strezhnev, and Erik Voeten. 2017. "Estimating Dynamic State Preferences from United Nations Voting Data." Journal of Conflict Resolution 61 (2), pp. 430–56.
Caldara, Dario and Matteo Iacoviello. 2022. "Measuring Geopolitical Risk." American Economic Review, April, 112 (4), pp. 1194-1225.
Goldberg, Pinelopi K. and Tristan Reed. 2023. "Is the Global Economy Deglobalizing? And if so, why? And what is next?" BPEA Conference Draft, Spring, The Brookings Institution.
International Monetary Fund (IMF). 2023. World Economic Outlook: Geoeconomic Fragmentation and Foreign Direct Investment. International Monetary Fund, Washington, DC.
Khanna, Gaurav, Nicolas Morales and Nitya Pandalai-Nayar. 2022. "Supply Chain Resilience: Evidence from Indian Firms." NBER Working Paper Series, 30689, National Bureau of Economic Research.
1. The analysis and conclusions set forth are those of the authors and do not indicate concurrence by other members of the research staff or the Board of Governors of the Federal Reserve System. This note benefited from excellent research assistance by Akhil Saxena as well as from useful comments and suggestions by Shaghil Ahmed, Logan Lewis, and Andrea Raffo. Return to text
2. The 2023 release of BEA Input-Output tables covers the period 2007-2021 and features 138 industries and seven foreign regions--Canada, Mexico, Europe, Japan, China, Rest of Asia and Pacific, and Rest of the World. Although not the focus of this note, the tables also include information on industry's exports by destination. For access to the dataset and a detailed description, see https://www.bea.gov/data/special-topics/global-value-chains. Return to text
3. In this note, the motor vehicles sector includes heavy trucks, light trucks, automobiles, and motor vehicles parts. Return to text
4. The combined output of these industries represents 29 percent of U.S. total manufacturing output. Return to text
5. Other economic studies using the Bailey et al (2017) measure of geopolitical distance include IMF (2023). Return to text
6. Blue shadings are not meant to rank countries by their geopolitical distance from the United States. Return to text
7. We only consider industry-input pairs for which the input represents at least 0.075 percent of the industry's gross output. Return to text
8. Normalizing subcomponents by their standard deviations guarantees that differences in their contributions to the index are driven by differences in their assigned weights and not mechanically driven by differences in the dispersion of the subcomponents. Return to text
9. The global geopolitical risk index developed in Caldara and Iacoviello (2022) currently stand well above the pre-war levels, even though it has declined some of late after spiking at onset of Russia's invasion of Ukraine. Country-specific indices are especially elevated for the United States, Russia, Ukraine, China, and Taiwan. Return to text
10. Using firm data from India, Khanna et al (2023) find that pandemic lockdowns led to a larger drop in input purchases among firms exhibiting higher geographical concentration of suppliers, as these firms had more difficulty finding alternative input sources. Return to text
11. We have explored the robustness of our results by computing SRI with different weights. In particular, keeping the weight of import shares low, we tried specifications with supplier-concentration factors getting similar or even slightly higher weight than geopolitical factors. We also tried specification in which the three risk factors get the same weights. In all cases, the main messages of our analysis go through. Deviating significantly from the results in this note requires assigning a very low weight to geopolitical factors, which is unwarranted in our view. Return to text
12. This analysis finds that a few industry-input pairs involving inputs of apparel and furniture also show high sourcing risk. Return to text
13. Note that our general approach to assess sourcing risks can be applied at all levels of disaggregation. Return to text
14. An alternative approach to aggregate sourcing risks is to combine our SRI values with a judgmental measure of how critical each input is for each industry. Return to text
De Michelis, Andrea, and Mariano Somale (2023). "A Sourcing Risk Index for U.S. Manufacturing Industries," FEDS Notes. Washington: Board of Governors of the Federal Reserve System, September, 08, 2023, https://doi.org/10.17016/2380-7172.3367.
Disclaimer: FEDS Notes are articles in which Board staff offer their own views and present analysis on a range of topics in economics and finance. These articles are shorter and less technically oriented than FEDS Working Papers and IFDP papers.