FEDS Notes
July 28, 2017
Another Look at Residual Seasonality in GDP
Paul Lengermann, Norman Morin, Andrew Paciorek, Eugenio Pinto, and Claudia Sahm
According to the Bureau of Economic Analysis, real GDP rose at an annual rate of 1.2 percent in the first quarter of this year, a step down from the 2.3 percent pace in the second half of last year.1 The advance estimate for the first quarter published in April was even lower at 0.7 percent. Yet another weak first-quarter reading on GDP growth led several commentators to argue that growth continues to be understated because of a measurement problem known as "residual seasonality".2 However, we argue in this note that residual seasonality is unlikely to be the primary reason for the slowdown in first-quarter growth this year.
Residual seasonality exists when a time series, like GDP, continues to show a predictable pattern of ups and downs during the year even after attempts have been made to seasonally adjust the data to remove calendar and holiday effects. Looking at quarterly, seasonally adjusted GDP growth over the past ten years, in Figure 1, we see that first-quarter growth (blue dots) has often been low relative to growth in the year as a whole (horizontal bars). This pattern helps explain why the issue has attracted attention in recent years, but it is not proof that predictable residual seasonality exists. For instance, idiosyncratic factors, such as severe winter weather in 2011 and 2014 or the rollout of new government health care policies in 2014 may have weighed especially on some first quarters. In addition, the first quarter of 2009, which was during the Great Recession (the shaded area), was substantially weaker than the rest of the year as the recovery began. That one quarter plays a large role in the low first-quarter average during the past ten years, but a recession is clearly not an event that we think of as a predictable drag at the start of each year.
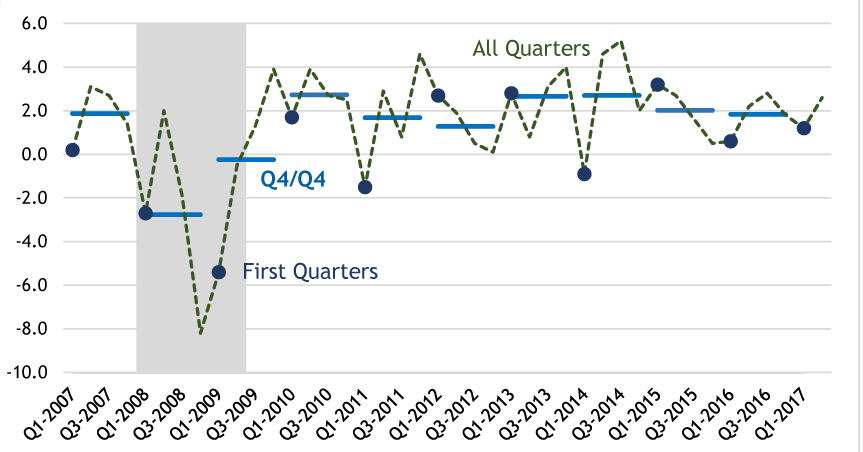
Source: Bureau of Economic Analysis. Note: Horizontal bars are the percent change in fourth-quarter GDP each year relative to prior fourth quarter. Dashed line is quarterly percent change in GDP, at an annual rate, with dots denoting first quarters. Shaded area denotes recession.
Previous Studies of Residual Seasonality in GDP
A common way to test for (and potentially remove) residual seasonality is to apply the Census Bureau's X-12 ARIMA seasonal adjustment program to the published, seasonally adjusted GDP data. However, the results are quite sensitive to the time period chosen. Using the standard diagnostic tests of X-12 ARIMA, Gilbert et al. (2015) did not find statistically significant evidence for residual seasonality in real GDP for the 2010 to 2014 or the 2005 to 2014 periods, but did identify certain subcomponents that exhibited residual seasonality. In contrast, Rudebusch, Wilson, and Mahedy (2015) found statistically significant residual seasonality in GDP over the period of 1960 to 2015 and an understatement of first-quarter growth in recent years that was over a percentage point.3 The Bureau of Economic Analysis also conducted its own extensive review of nearly 2,000 GDP series using X-12 ARIMA. Moulton and Cowan (2016) found that real GDP showed signs of residual seasonality over the past 10 years (2006 to 2015) and the past 30 years (1986 to 2016) but not over the past 15 years (2001 to 2015). The BEA's review also identified subcomponents of real GDP with statistically significant residual seasonality, such as nonresidential structures, exports of goods, federal government spending (especially defense spending) and state and local spending. This is essentially the same set of subcomponents as identified by Gilbert et al. (2015).
Steps Taken by the BEA to Improve Seasonal Adjustment of GDP
In 2015, the BEA launched a multi-phase effort to improve the seasonal adjustment of GDP. The BEA uses data from a variety of sources to estimate GDP.4 The BEA's standard practice had been to construct GDP from component series that were already seasonally adjusted by the source agency. Yet, in some cases, a short time series from a new survey or weak statistical evidence of seasonality meant that no adjustment was made to a particular series. In the summer of 2015, the BEA began seasonally adjusting source data used to estimate parts of PCE services, the change in private inventories, corporate profits, and federal defense spending that had previously not been seasonally adjusted by the source agency (McCulla and Smith, 2015). Given the three-year window of a BEA annual revision, however, these new methods were applied to the GDP data only since the start of 2012. At the subsequent annual revision in the summer of 2016, the BEA introduced new seasonal adjustment procedures for state and local investment in structures as well as prices for select PCE services and private fixed investment components (McCulla and Smith, 2016). Those changes were applied only back to the start of 2013. Importantly, the GDP estimate for the first quarter of this year reflects both sets of changes to seasonal adjustment procedures; however, these new procedures will be not be applied to the full history of GDP data until the comprehensive revision in 2018. Therefore, with only four years of revised data, data users should be very cautious when using the current time series of GDP to determine if residual seasonality is still a problem in the data released each quarter.
The process to improve seasonal adjustment is ongoing. Importantly, the BEA and the Census Bureau have been collaborating on ways to improve the seasonal adjustment of input series. In 2018, the BEA plans to begin publishing estimates of non-seasonally-adjusted GDP, which should support more external research on seasonal adjustment.
Is Residual Seasonality Still A Problem?
The current time series for GDP is a mix of data seasonally adjusted using different procedures, making it a challenge to assess how successful the BEA's new procedures have been and whether residual seasonality is still a material problem. While we review some patterns in the recent data here, it is also important to reiterate that since the BEA's improved methodology has only been applied to the past three or four years of published GDP data, it is difficult to draw any firm conclusions.5
Summary Statistics
Over the past ten years, first-quarter GDP growth was, on average, 1.3 percentage points below the growth for the year as a whole, shown by the first light bar in Figure 2.6 Even if we focus on the past four years, which incorporate the BEA's new seasonal adjustment procedures, first quarter GDP growth (first dark bar) remains relatively weak. Overall, this top-down view of the data leaves the impression that the BEA has made only some progress in addressing residual seasonality. Note, if we exclude recessions and the outliers of 2011 and 2014, the first-quarter weakness in both periods almost disappears.
Figure 2: GDP Still Weak in First Quarters After Seasonal Adjustment Changes But GDP Contributions of Subcomponents Shifted
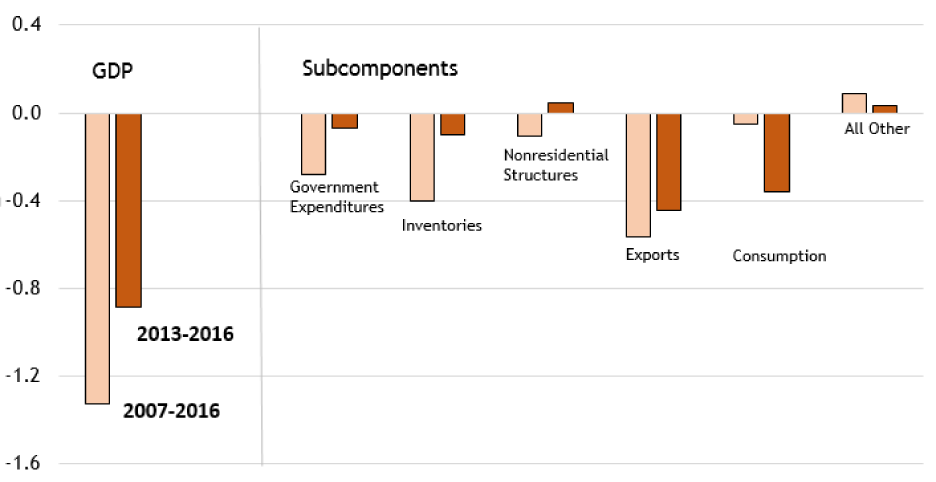
Source: Bureau of Economic Analysis
However, the contributions to GDP growth from various subcomponents of GDP suggest a more nuanced view. In some categories for which the BEA has altered its methods, like government spending and inventories, the recent data do show less first-quarter weakness. In addition, the GDP contributions from other categories for which the Census Bureau has improved the seasonal adjustment of source data that the BEA uses, like non-residential structures and net exports, show less weakness recently. Of course, progress does not necessarily mean that the issue is resolved, as one example, exports still shows notable first-quarter weakness.
Regardless, any reduction in residual seasonality in these components does not show through materially to stronger first-quarter GDP, largely because first-quarter consumer spending has been considerably weaker recently. In previous studies, consumer spending had not shown statistically significant signs of residual seasonality, even though some of its key source data were not seasonally adjusted. Only in recent years has first-quarter growth in consumer spending been substantially weaker than the year as a whole. Below we discuss some special factors, other than residual seasonality, that likely weighed on first-quarter consumer spending. In any case, even if residual seasonality remains a problem for GDP, the component-level view suggests that its sources may have shifted.
A Closer Look at Consumer Spending This Year
We also think that it is useful to look at the specific sources of first-quarter weakness this year. As noted above, consumer spending emerged in the past four years as a key contributor to weak first-quarter GDP. Indeed, this year's step down in first-quarter GDP growth can be fully accounted for by slower growth in consumer spending. Consumer spending added only 1.3 percentage point to GDP growth in the first quarter of this year, down from its 2.0 percentage point contribution in the fourth quarter of last year. Even relative to its average first-quarter contribution over the past four years, consumer spending was somewhat weaker at the start of this year. This slowing occurred in several categories of consumer expenditures, which are estimated using a wide range of data sources. One could legitimately be concerned about residual seasonality in some consumer services categories, since a key data source, the Quarterly Services Survey, is relatively new and has a short time series for seasonal adjustment. However, it would be hard to assign the sizable first-quarter decline in motor vehicle outlays to residual seasonality. A more likely explanation is that the robust growth in this category last year, supported in part by dealer incentives, was not sustainable and motor vehicle outlays have moved back closer to trend.
The consumer spending data also reveal an interesting case of first-quarter weakness every two years (after federal elections), which is therefore not removed by the standard seasonal adjustment. As Figure 3 shows, the contribution to GDP growth of professional advocacy non-profits, which include political organizations, exhibits a clear election cycle.7 In the first quarter of odd-numbered years, particularly after a presidential election, this category subtracts from GDP growth. In contrast, in the first quarter of even-numbered years, professional advocacy nonprofits add to growth. Spending in this tiny category was only 0.1 percent of the level of GDP in the fourth quarter, but professional advocacy alone can account for 0.3 percentage point less GDP growth in the first quarter of this year than in the fourth quarter.
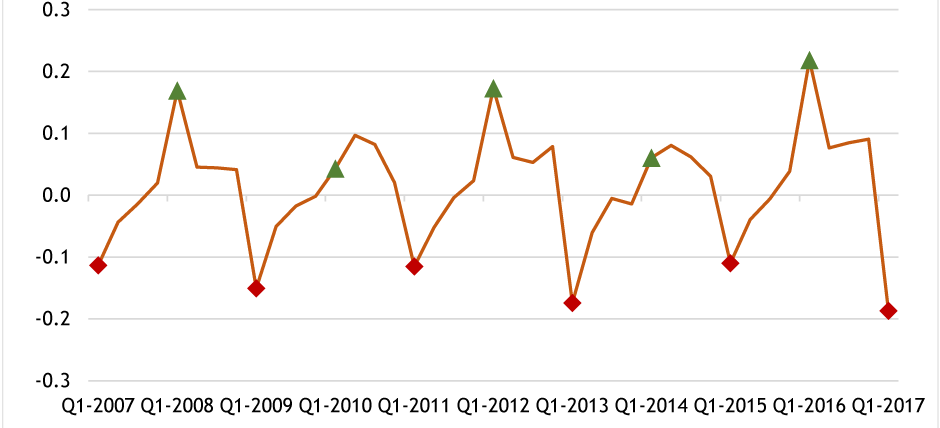
Source: Bureau of Economic Analysis. Note: Professional advocacy nonprofits includes political organizations.
This pattern raises a question of whether regular political cycles like this should be removed from the published GDP estimates in the same way as annual seasonal patterns. The answer likely depends on the underlying question of interest. If the goal is to estimate the underlying pace of growth, some--for example, Boldin and Wright (2015)--have argued that even the effects of unusual weather, not just regular seasonal patterns, should be mechanically removed from published economic data.8 On the other hand, as noted by Sahm (2015), consumers, employers, and even policymakers experience the economy with all its seasonal and weather-related variation, so using adjusted data misses the opportunity to study that variation.
Conclusion
In summary, we do not view residual seasonality as the primary reason for the slowdown in first quarter growth this year. It appears to us that the BEA's new seasonal adjustment procedures have addressed some prior areas of first-quarter weakness. We look forward to their next comprehensive revision in 2018 when these and further adjustments will be applied to the entire history of GDP data because a methodologically consistent time series is necessary for a more complete study of residual seasonality. The first-quarter weakness in consumer spending that has emerged recently does raise some concerns about measurement, though we tend to view that pattern as largely driven by idiosyncratic factors rather than residual seasonality. And regardless of whether the weak first-quarter GDP is due to residual seasonality, unusual weather, or other idiosyncratic factors, the key is to distinguish a temporary slowdown that will likely be reversed from signs of a more persistent downtrend. To assess the underlying trajectory of real activity, it is useful to consider a range of indicators in addition to GDP and its subcomponents, including Gross Domestic Income, labor market conditions, financial market data, and surveys of consumer and business sentiment, all of which have their own unique measurement issues. Finding the right approach to seasonal adjustment is just one example of the measurement challenges that statistical agencies face.
References
Boldin, Michael and Jonathan H. Wright. (2015). "Weather-Adjusting Economic Data." Brookings Panel on Economic Activity Fall 2015, p 227-278.
Gilbert, Charles, Norman Morin, Andrew D. Paciorek, and Claudia R. Sahm (2015). "Residual Seasonality in GDP," FEDS Notes 2015-05-14. Board of Governors of the Federal Reserve System (U.S.).
Groen, Jan and Patrick Russo. (2015). "The Myth of First-Quarter Residual Seasonality." Liberty Street Economics. Federal Reserve Bank of New York. June 8, 2015.
Holdren, Alyssa E. (2014). "Gross Domestic Product and Gross Domestic Income: Revisions and Source Data." Survey of Current Business 96 (June 2014).
Kliesen, Kevin L. (2017). "Residual Seasonality: The Return of an Old First-Quarter Friend?" On The Economy Blog. Federal Reserve Bank of St. Louis. March 27, 2017.
Lunsford, Kurt G. (2017). "Lingering Residual Seasonality in GDP Growth." Economic Commentary. Federal Reserve Bank of St. Louis. March 28, 2017.
McCulla, Stephanie H. and Shelly Smith. "The 2015 Annual Revision of the National Income and Product Accounts." Survey of Current Business 95 (August 2015).
---- , "The 2016 Annual Revision of the National Income and Product Accounts." Survey of Current Business 96 (August 2016).
Moulton, Brent R. and Benjamin D. Cowan. (2016). "Residual Seasonality in GDP: Findings and Next Steps." Survey of Current Business 96 (July 2016).
Rudebusch, Glenn D., Daniel Wilson, and Tim Mahedy. (2015). "The Puzzle of Weak First-Quarter Growth." FRBSF Economic Letter. Federal Reserve Bank of San Francisco. May 18, 2015.
Rudebusch, Glenn D., Daniel J. Wilson, and Benjamin Pyle. (2015). "Residual Seasonality and Monetary Policy." FRBSF Economic Letter. Federal Reserve Bank of San Francisco. August 24, 2015.
Sahm, Claudia R. (2015) "Comment on Weather-Adjusting Economic Data." Brookings Papers on Economic Activity Fall 2015, p 268-274.
Schwarz, Nelson. (2017). "G.D.P. Report Shows U.S. Economy Off to Slow Start in 2017." The New York Times. April 28, 2017. https://www.nytimes.com/2017/04/28/business/economy/economy-gross-domestic-product-first-quarter.html?mcubz=2
Sparshott, Jeffrey (2017). "Why First-Quarter Growth Is Often Weak." The Wall Street Journal. April 25, 2017. https://blogs.wsj.com/economics/2017/04/25/why-first-quarter-growth-is-often-weak/
1. The GDP estimates in this note reflect the BEA’s 2017 annual revision published on July 28, 2017, unless otherwise noted. Return to text
2. See, for example, Kliesen (2017), as well as press coverage of first quarter GDP by Schwarz (2017), Sparshott (2017). Return to text
3. In a follow-up study after the BEA’s 2015 annual revision, Rudebusch, Wilson, and Pyle (2015) again found evidence of residual seasonality in GDP. Similarly Lunsford (2017) argues that first-quarter GDP growth from 1985 to 2015 is systematically weak (coming in 0.8 percentage point lower, on average) and that this is largely offset by higher second-quarter growth (coming in 0.6 percentage point higher). Return to text
4. For an overview of how the BEA constructs GDP estimates, in particular the range of data sources it uses, see Holdren (2014). . Return to text
5. Moreover, with the BEA's efforts still ongoing, it would be too early to declare this issue resolved regardless of our findings. For those interested in further discussion of the seasonal adjustment of GDP, see also the presentations from the Federal Economic Statistics Advisory Committee meeting in December 2016: https://www.census.gov/about/adrm/fesac/meetings/2016-12-09-meeting.html Return to text
6. Using a standard seasonal adjustment program (and data prior to the 2017 annual revision), the Census Bureau's X-12 ARIMA, we find that the published estimates of first-quarter growth from 2007 to 2016 are about a percentage point lower than a re-seasonally adjusted series. However, given the mix of seasonal adjustment procedures in the current time series vintage for GDP, we do not view this as a reliable estimate of residual seasonality. Moreover, we found that estimates of residual seasonality from X-12 ARIMA were quite sensitive to influential observations, such as recessions and recent outlier quarters. Return to text
7. More broadly, the final consumption expenditures of non-profit institutions serving households are included in the BEA's measures of consumer spending. The estimates on professional advocacy non-profits here and in Figure 3 use data from before the BEA's 2017 annual revision, since the underlying data had not been released at the time of this note's publication. Even so, the less-detailed data from the annual revision do not suggest large revisions in the broad category which includes professional advocacy nonprofits. Return to text
8. In fact, Groen and Russo (2015) have argued that unseasonable weather can account for what looks like residual seasonality in GDP. Return to text
Lengermann, Paul, Norman Morin, Andrew Paciorek, Eugenio Pinto, and Claudia Sahm (2017). "Another Look at Residual Seasonality in GDP," FEDS Notes. Washington: Board of Governors of the Federal Reserve System, July 28, 2017, https://doi.org/10.17016/2380-7172.2031.
Disclaimer: FEDS Notes are articles in which Board staff offer their own views and present analysis on a range of topics in economics and finance. These articles are shorter and less technically oriented than FEDS Working Papers and IFDP papers.