FEDS Notes
May 06, 2022
Business entry and exit in the COVID-19 pandemic: A preliminary look at official data
Ryan A. Decker and John Haltiwanger1
Introduction
The economic effects of the COVID-19 pandemic brought new focus to questions about business entry and survival. The spring of 2020 was characterized by widespread fear of surging business exit (death). Meanwhile, by the second half of 2020 applications for new businesses were surging, suggesting a potential burst of business entry would quickly follow. The evolution of business dynamics in response to the pandemic shock could have potentially long-lasting implications for labor markets, potential output, and other important economic outcomes. In this note, we explore these issues by combining recently released Bureau of Labor Statistics (BLS) Business Employment Dynamics (BED) data for the period of the pandemic in combination with the more timely Business Formation Statistics (BFS) data released by the U.S. Census Bureau.
The early pandemic period featured surging establishment closures, many of which were temporary and reopened shortly thereafter. However, establishment exits also surged, permanently destroying nearly 1.2 million jobs in the second quarter of 2020. Starting in the second half of 2020, however, establishment births surged; this was largely consistent with previously reported BFS data on new business applications, though some differences hint at differing activity between incumbent firms and new entrepreneurial businesses. On net, surging births outnumbered exits. Partly as a consequence, the firm size distribution appears to have shifted leftward, with an increased share of firms and employment accounted for by smaller firms; though this leftward shift is also partly the result of existing firms downsizing into smaller size categories.
A key challenge for economic analysts during the pandemic has been the substantial lag with which official data on business entry and exit are released. Data on the entry and exit of establishments—that is, single operating locations of potentially larger businesses—are released by the BLS with a lag of about three quarters. Data on the entry and exit of firms—that is, collections of one or more establishments under common ownership or control—are released by the Census Bureau with a lag measured in years.2 In the meantime, the BED does include firm tabulations based on a narrower definition of firms, which we exploit in some analysis below (with appropriate caveats).
The development and release of the BFS helps overcome some of these limitations. Timely weekly and monthly statistics on new business applications by industry and location are released on an almost real-time basis (e.g., monthly data for March 2022 were released in early April 2022). Moreover, included in the BFS are transitions of these applications to actual new employer businesses over 4 and 8 quarters, though these transitions data are available only with a considerable lag (e.g., the current BFS includes transitions only up through 2019).
The new applications data exhibit a dramatic surge in the pandemic particularly in industries conducive to pandemic-era lifestyles such as online retail (see, e.g., Dinlersoz et al. 2021 and Haltiwanger 2021a). Given the lag in official statistics on business entry, an open question has been whether the surge in applications would translate into a surge in new employer businesses. We take a first look at that question in this note. Historically, there has been a tight connection between fluctuations in applications and new businesses (see Haltiwanger 2021a), but it is possible this relationship could have changed in the pandemic.
There is no official early indicator of business exit as there now is for business formation. Crane et al. (2022) observe that exit typically rises in recessions—particularly among small firms and establishments—and found evidence in nontraditional sources (primarily mobile phone tracking data) suggesting that establishment exit was roughly 200,000 above recent historical rates during the first year of the pandemic, which now appears to have been roughly correct.3
Even with the lag in official statistics on business entry and exit, statistics released from the BED now provide evidence through 2021:Q3. Combined with BFS data on business applications, we examine what we know so far about the impact of the pandemic on business entry and exit from these latest data.
Establishment openings and closures
Figure 1 reports establishment openings and closures from 2019 through the third quarter of 2021. In the BED, an establishment opening is an establishment with positive employment in the third month of the current quarter but zero or no reported employment in the third month of the prior quarter. A closure is its counterpart: positive employment in the third month of the prior quarter with zero or no reported employment in the current quarter. Notably, these definitions are inclusive of, but not limited to, establishment birth and exit.4
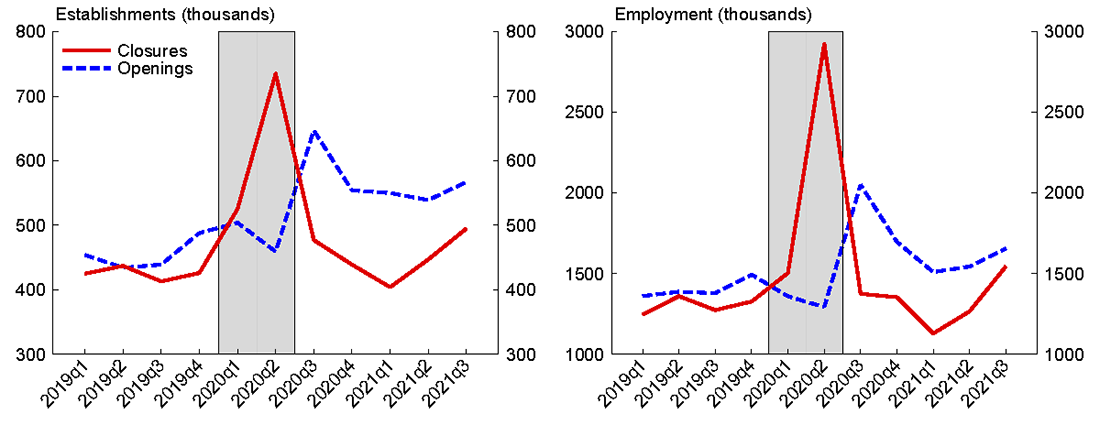
Note: Includes temporary closures and reopenings. Seasonally adjusted. Y axes may not start at zero. Shaded areas indicate NBER recession dates.
Source: BLS Business Employment Dynamics (BED).
Establishment closure and opening was an important feature of the early pandemic; more than 700,000 establishments closed in the second quarter of 2020 (left panel), accounting for nearly 3 million jobs (right panel) out of 20 million gross job losses occurring in that quarter (not shown). However, this surge in closures included many temporary closures and was followed by a surge in openings in the third quarter, which remained elevated through the middle of 2021.
Figure 2 shows temporary closures and reopenings more precisely; here we define temporary closures as closures minus exits in the same quarter, and we define reopenings as openings minus births (the temporary closure series only extends through the fourth quarter of 2020 because exit data lag closure, opening, and birth data).
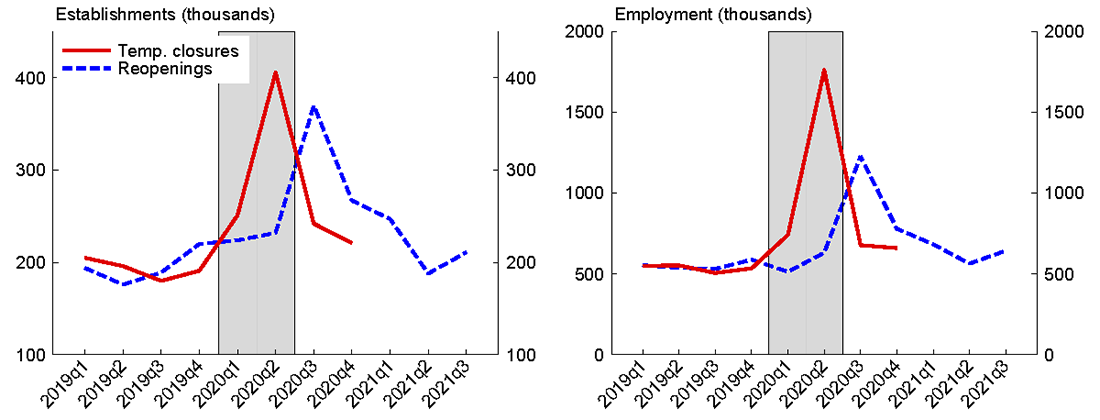
Note: Net temporary closures and reopenings. Seasonally adjusted. Y axes may not start at zero. Shaded areas indicate NBER recession dates.
Source: BLS Business Employment Dynamics (BED) and author calculations.
About 400,000 establishments closed in the second quarter of 2020 only to reopen thereafter (left panel); these temporary closures accounted for 1.8 million of the nearly 3 million jobs lost to closures in that quarter (right panel). The surge of reopenings in the third quarter, at about 370,000, nearly made up for the second-quarter temporary closures; though these reopenings brought back only 1.2 million jobs.
Establishment births and exits
Actual establishment births and exits are shown on Figure 3.5 During the second quarter of 2020 exits surged to a historic 330,000 establishments (left panel). Second-quarter exits permanently destroyed nearly 1.2 million jobs in that quarter (right panel); this kind of job destruction inherently leaves a lasting imprint on the labor market, separating workers from their employers with no recall option.6 Importantly, however, establishment exits fell back again in the third quarter of 2020; exits during 2020 as a whole reached nearly 1.1 million and exceeded pre-pandemic (2015-2019) rates by roughly 181,000, which is close to earlier estimates from nontraditional data by Crane et al. (2022).
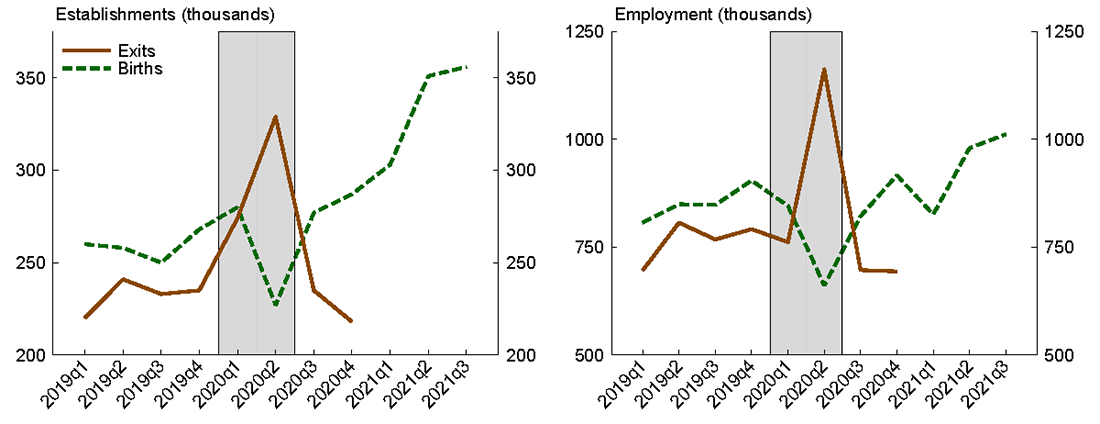
Note: Seasonally adjusted. Y axes may not start at zero. Shaded areas indicate NBER recession dates.
Source: BLS Business Employment Dynamics (BED).
Establishment births dropped in the second quarter but recovered quickly (left panel), bouncing back in the third quarter then surging markedly thereafter. This surge in births is apparent even in employment terms (right panel); births created roughly 1 million jobs in each of the second and third quarters of 2021. However, the birth employment surge of the right panel is not as striking as the surge in the number of establishment births of the left panel, suggesting that the birth surge was driven largely by small establishments.
Despite the jump in exits early in the pandemic, the surge in establishment births has been sufficient to increase the number of operating establishments on net. Existing literature using the BLS Quarterly Census of Employment and Wages (QCEW) finds wide geographic and industry dispersion in net establishment gains, with strong growth in "sun belt" areas and the mountain west but weak, or negative, growth in coastal urban areas (O'Brien 2022).
The preview from business applications data
An important economic indicator during the pandemic has been the Census Bureau's BFS. The BFS provides counts of applications for employer identification numbers (EIN), with total application counts as well as counts of applications indicating plans to hire workers and counts of "high-propensity" applications based on internal Census Bureau models. As described by Dinlersoz et al. (2021), applications initially plunged at the onset of the pandemic, but they began recovering in June 2020 then surged to record paces into 2021 and 2022. Figure 4 shows high-propensity business applications along with establishment births; the left panel shows the time period around the pandemic, while the right panel zooms out for a longer-term view.
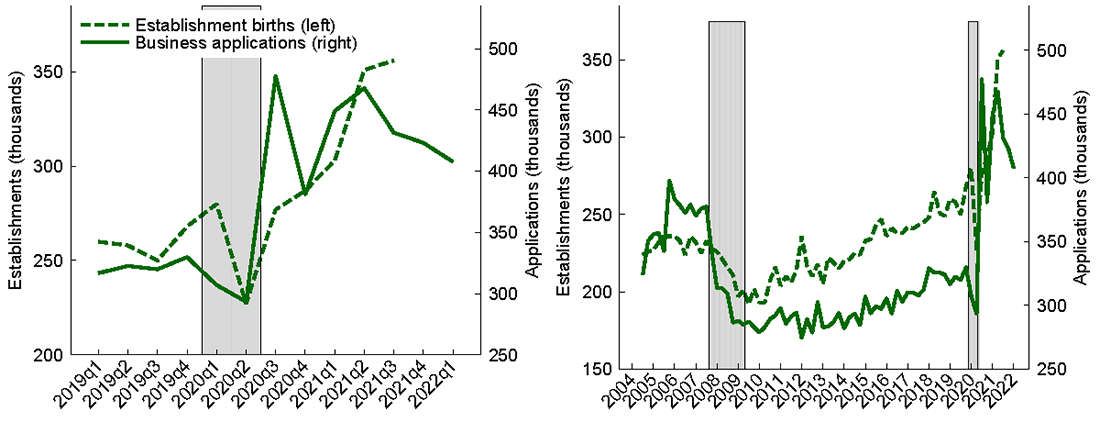
Note: High-propensity business applications. Seasonally adjusted. Y axes may not start at zero. Shaded areas indicate NBER recession dates.
Source: BLS Business Employment Dynamics (BED) and Census Bureau Business Formation Statistics (BFS).
Here it is important to highlight measurement issues. The BFS measures applications for new firms and is therefore a measure of entrepreneurial activity (or, at least, entrepreneurial ambition). These applications may or may not turn into actual employer firms (though historically the relationship between applications and employer firm births is strong and predictable, as shown by Haltiwanger 2021a). The BED measures all employer establishment births, including new establishments created by existing firms (for example, a new Starbucks location). Existing firms do tend to create new establishments in high numbers; for the 2015-2019 period on average, existing firms accounted for about 36 percent of annual establishment births, and mature firms at least five years old accounted for 30 percent.7 Large firms—those with at least 500 employees—accounted for 13 percent of new establishments.
For these reasons, we need not expect a perfect relationship between business applications and establishment births. Moreover, there is typically a lag of a few quarters between business application and employer firm creation among those applications that do result in employer firms, and this lag will be apparent in comparisons of applications with establishment births as well. Haltiwanger (2021a) finds that the cumulative impulse response of establishment births and hiring to an innovation in new business applications continues to increase through 12 quarters.
These important distinctions notwithstanding, the establishment birth data are an important early test of whether surging business applications turned into active new employer businesses. Establishment births did in fact surge as would have been predicted from application data, with both births and applications reaching record levels in 2020 and 2021. Applications eased somewhat after mid-2021 but have remained historically elevated.
While establishment birth data broadly confirm the signal from earlier business applications data, discrepancies between the two sources can provide insights into the pandemic economy. Figure 5 compares establishment births with high-propensity business applications at the sector level for the period of 2020:Q3 through 2021:Q3. The left panel plots the number of each (quarterly pace) minus their 2019 pace (in thousands), while the right panel reports the ratio of the pandemic pace to the 2019 pace; as such, the left panel is important for understanding contributions to the aggregate increase in these series, while the right panel is important for understanding growth within sectors.
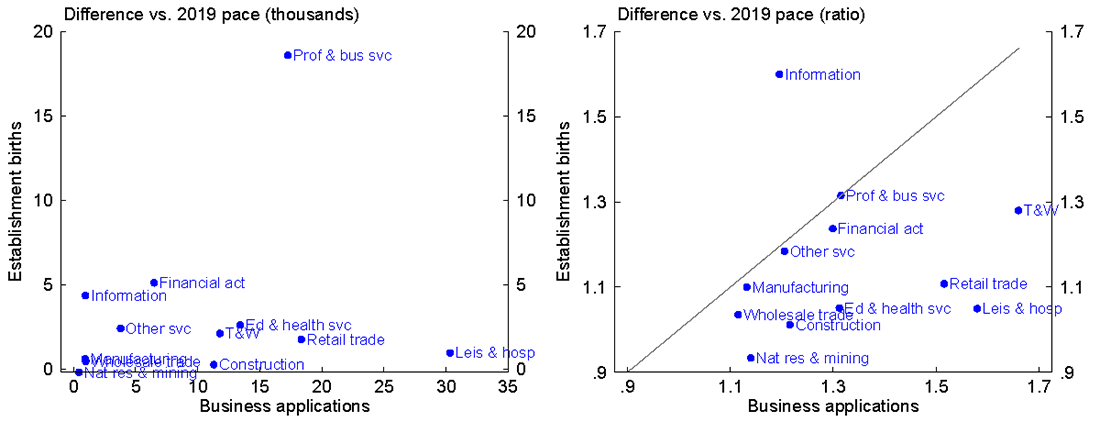
Note: 2020:Q3-2021:Q3. Left panel expressed in average seasonally adjusted quarterly pace. Solid line is 45-degree line. T&W is transportation & warehousing.
Source: BLS Business Employment Dynamics (BED), Census Bureau Business Formation Statistics, and author calculations.
Figure 5 shows that all sectors saw increases in business applications, though a few sectors saw no increase—or only a small increase—in establishment births. Focusing first on the left panel, some sectors are important for explaining the aggregate gains in both births and applications (such as transportation and warehousing or education and health services). However, other sectors show important distinctions: the professional and business services sector accounts for a sizeable portion of the rise in establishment births, far more than any other sector, while the leisure and hospitality sector is critical for understanding the aggregate rise in business applications.
The right panel provides insights into within-sector growth of births and applications, which abstracts from the relative size of sectors. The solid line is a 45-degree line; sectors falling on or close to that line had similar growth of births and applications. Here we see that professional and business services actually saw similar growth of births and applications, such that its outlier status in the left panel is likely the result of it simply being a large sector. Manufacturing and other services (which includes businesses like drycleaners and auto mechanics) are also close to the 45-degree line. However, the information sector is an important outlier with more growth in establishment births than in applications, while retail trade, transportation and warehousing, and leisure and hospitality each saw far more growth in applications than in births.
We can drill down into these industry stories with more industry detail. Figure 6 shows a modified version of this exercise at the 3-digit industry level. Because establishment births are not available at this level of industry detail, we instead report all establishment openings; since this potentially includes reopenings, we exclude 2020:Q3 (in which reopening activity was most intense).
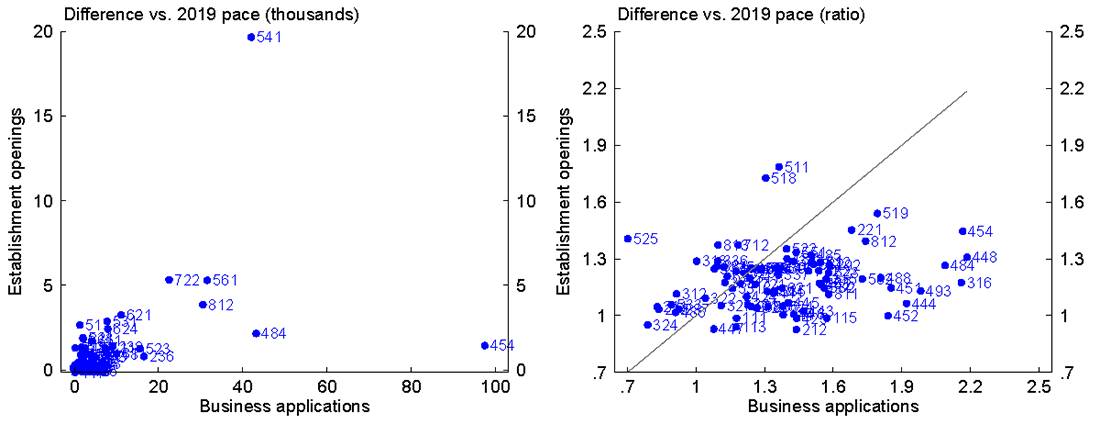
Note: 2020:Q4-2021:Q3. Left panel expressed in average seasonally adjusted quarterly pace. Solid line is 45-degree line. T&W is transportation & warehousing.
Source: BLS Business Employment Dynamics (BED), Census Bureau Business Formation Statistics, and author calculations.
Focusing on the right panel, the information sector (those industries starting with "51") can again be seen as having more growth in establishment births than in applications. In particular, NAICS 518 is data processing, hosting, and related services, and NAICS 511 is publishing industries (except internet), which includes software publishers and proprietary electronic networks.8 The relative strength of establishment births in these industries could potentially reflect incumbent firm activities; in particular, incumbent firms may have opened establishments for data processing and hosting, software publishing, and networking to facilitate remote working, online sales, and similar pandemic-friendly business considerations. Importantly, the firms opening these establishments could be in any industry; for example, large retailers may have opened such establishments to support retail activities, and professional services firms may have done so to support remote working. Such cross-industry activities could serve to reduce economic concentration in the information sector if these firms previously did not engage in such activities or did so at smaller scale within establishments classified in non-information industries. Importantly, newly formed businesses associated with surging business applications would be too small to need entire establishments dedicated to such auxiliary activities.
There are far more outliers in the other direction, that is, where growth of applications far exceeds growth of births. While specific explanations for each of these could range widely, it is not difficult to fit them into stories about the differing experiences of incumbent and new firms in the pandemic. New firms in NAICS 454 (nonstore retailers), which account for a wildly disproportionate share of the overall surge in applications (as shown in the left panel), likely took advantage of pandemic opportunities for online retail and related activities; existing retailers could manage online sales through their existing retail establishments (perhaps with assistance from newly opened information establishments). New firms in NAICS 484 (general freight transportation) and 493 (warehousing and storage) could be similarly providing pandemic-friendly services (storing and moving goods directly to consumers' homes) that can be handled by existing establishments of incumbent firms.
Some outlier industries do not suggest obvious explanations. New firms in NAICS 316 (leather and allied product manufacturing) and 448 (clothing and clothing accessories stores) could have opened to make and sell clothing and related products in pandemic-friendly ways; perhaps they took market share from incumbent firms that did not adapt quickly to pandemic commerce. NAICS 812 (personal and laundry service—most employment in this industry is in personal care services) could be similar in helping consumers adapt to pandemic lifestyles in ways incumbent firms did not foresee.
These industry comparisons may shed light on the differing experiences of incumbent and new firms in the pandemic. Each attempted to meet newly conceived needs created by the pandemic. But the business models and geographic structure of incumbents and new entrepreneurial ventures differ in ways that make sense given relative operational scales of these different types of businesses. Incumbents may have opened specialized establishments for enhancing the capabilities of existing establishments, while entrepreneurs started new firms focused on meeting similar needs but at smaller scales—or in profitable ways not anticipated by incumbent firms. While the long-run implications of these patterns are still unclear—and will depend on the extent to which pandemic-era lifestyle and work changes prove permanent—the patterns we document afford some optimism about productivity and labor markets. Existing literature finds examples of productivity gains from both incumbent firms opening new establishments (e.g., Foster et al. 2006) and from new firm creation (Decker et al. 2017 and Alon et al. 2018). Existing firms opening specialized establishments may enhance the productivity of existing establishments, while the creative destruction and experimentation wrought by the surge in entrepreneurship could remake business models to better meet customer needs.
An alternative possibility is that the propensity of business applications to convert into employer businesses may have varied materially across sector. A full exploration of these transitions must wait for the availability of Census Bureau microdata.
Preliminary evidence on the firm size distribution
Our use of BED data thus far has focused on establishments—single operating locations of businesses—which may be part of larger firms. The U.S. business dynamics literature typically defines a firm as a collection of one or more establishments under common ownership or operational control, consistent with the Census Bureau definition. While the bulk of BED tabulations are based on establishment data, the program does also release some firm tabulations using a narrower firm definition based on the EIN. We caution that large firms can have many EINs such that measured patterns of firm dynamics and the distribution of firm activity across firm sizes in BED data can, in some cases, capture divisions within firms instead of firms themselves.9 For example, for 2019 the BED reports that 40.6 percent of employment was in firms with more than 1,000 employees; in contrast, using the broader definition of the firm based on operational control, the Census Bureau reports that 47.5 percent of employment was in firms with more than 1000 employees in that same year. With that caveat noted, a strength of BED firm-based tabulations is their timeliness, so we report an early look at firm dynamics in BED data.
The BED provides total employer firm counts on an annual basis, as of March of each year. The total number of firms in BED data rose from 5.27 million in March 2020 to 5.37 million in March 2021, suggesting that firm exit during the first year of the pandemic was lower than firm entry. The total increase obscures noteworthy variation across firm size classes. The top panel of Figure 7 shows the change in activity shares by firm size class over this period: the solid blue bars show the change in the share of firms accounted for by each size class, while the hollow bars show the change in the share of employment. Firms with fewer than 5 employees saw their share of all firms rise by more than 1 percentage point, while all firm size classes above 9 employees saw declines in their shares. The employment share of the smallest firms rose by nearly 1/2 percentage point. We describe this as a "leftward shift" in the firm size distribution.
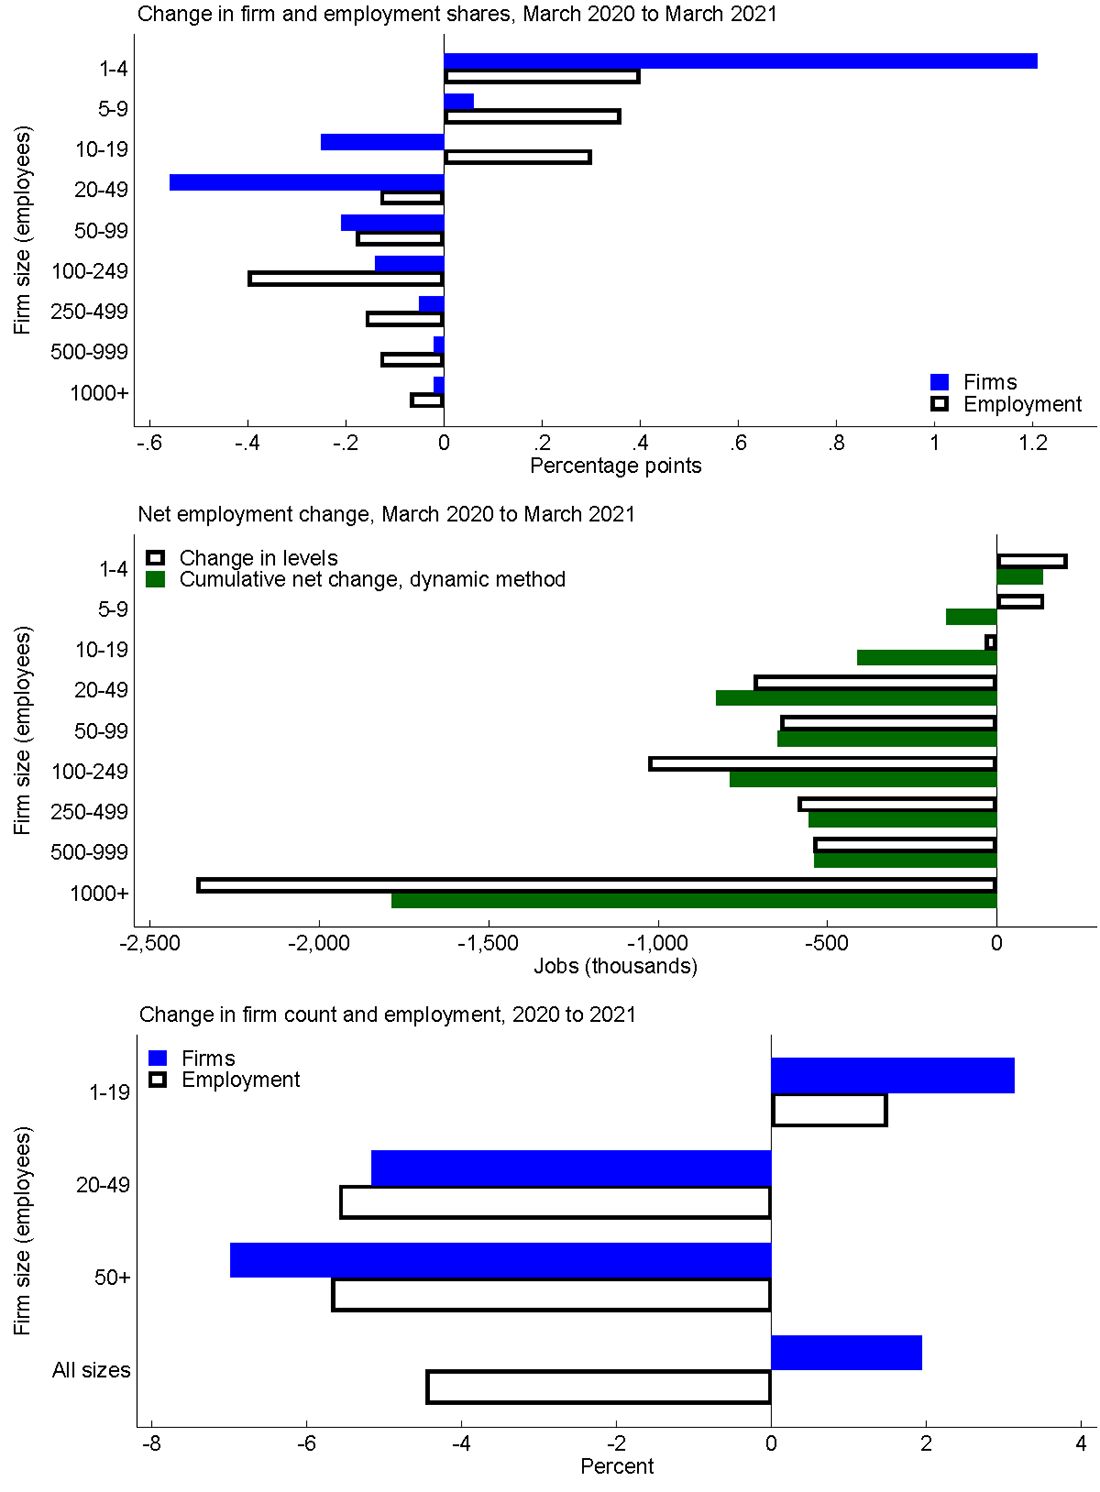
Note: Firms and firm size defined by EIN. Dynamic method distributes net growth across size categories in which it occurs.
Source: BLS Business Employment Dynamics (BED).
Given the aggregate decline in total employment over this period and the decline in the number of large firms, some of the patterns in the top panel of Figure 7 are likely driven by movement across size classes, as larger firms destroyed jobs and entered lower categories. This can be studied in the middle panel of Figure 7. The hollow bars show the change in the employment level (not share) by firm size; this measure, again, could be driven both by net firm entry and by downsizing firms moving into smaller size classes. But the solid green bars show net employment changes within each size category based on a BLS "dynamic method" which distributes employment growth linearly across the size categories in which it occurs (see Helfand, Sadeghi, and Talan 2007).10
If no firms changed size classes over this time period, the hollow bars and the solid green bars on the middle panel of Figure 7 would be identical. In actuality, they differ because of considerable movement of firms between size classes. For example, the level of employment in the 1000+ category declined by more than 2.3 million, but the dynamic method assigns only 1.8 million job losses to this category. The difference reflects job losses among firms that started with at least 1000 employees but moved down into lower size classes. On the other hand, employment in the smallest size class (1-4 employees) increased by about 200,000, though the dynamic method assigned less than 150,000 job gains to that size class; firms that were previously in a larger class but downsized into the 1-4 employee category had a negative effect on the dynamic method job gains, while job growth among firms that started in that category, as well as newly created firms, had a positive effect. The 5-9 employee category saw an increase in its employment level amidst negative net job gains from the dynamic method, suggesting considerable movement of larger firms down into this category. Other size classes may have seen roughly offsetting dynamic allocations such that the dynamic method generates net changes that are similar to the change in employment levels. In sum, the middle panel of Figure 7 shows that some of the leftward shift in the firm size distribution illustrated by the top panel reflects the downsizing of large firms.
However, movement across firm size categories is not the only reason for the leftward shift in the firm size distribution. The bottom panel shows the percent change in employment and the number of firms by size class (where we combine size classes to avoid integer problems). The number of firms in the smallest category increased 3 percent, while the overall number of firms of all sizes increased about 2 percent. The fact that the total number of firms rose suggests that net firm entry was indeed an important contributor to the firm distribution over this period, with the number of small firms increasing not only due to some larger firms downsizing but also due to newly created firms (which tend to be small). The business entry patterns previewed by BFS data are therefore evident in BED firm tabulations as well.
The increased employment share of small firms in the first year of the pandemic contrasts with the longer-run shift toward larger firms over the last couple of decades (e.g., Autor et al 2020 and Haltiwanger 2021b). This is a plausible outcome given the extraordinary surge of business entry and the likely downsizing of many large firms during the pandemic. However, two caveats (in addition to those mentioned above) are worth noting. First, this leftward shift in the size distribution is not necessarily directly informative about economic concentration, which is more typically described using top firm shares (e.g., the share of activity accounted for by the top 10 or 20 firms); top firm shares cannot be measured with the BED tabulations. It is possible for top firm shares to rise even while the share of activity accounted for by firms with fewer than 20 employees rises if there were polarized movements in the firm distribution—with medium-sized firm classes losing firms or employment while dominant firms gain market share and entrants increase activity at the small end of the distribution. For example, it has been reported that Amazon hired roughly 400,000 U.S. workers in 2020 (Francis 2021), which may have increased its share of overall employment. Second, while employment concentration is interesting from the perspective of labor markets, the study of product market concentration requires sales tabulations. Both top firm shares and sales concentration measures will not be available for the U.S. generally until the release of the 2022 Economic Census.
Conclusion
This preliminary look at official data on business dynamics in the COVID-19 pandemic yields several insights. Temporary closure and reopening was an important aspect of the early pandemic period, accounting for large flows of employment. Establishment exit (death) surged early in the pandemic—destroying nearly 1.2 million jobs in a single quarter—but appears to have fallen back quickly; lower-than-expected exit may have led to better-than-expected outcomes for employment, potential output, and even supply chain resilience in the later pandemic period, but it could also have negative implications if it resulted from low-productivity businesses receiving excessive policy support. The surge in business entry previewed by business applications data appears to have materialized; both business applications and establishment births appear most prevalently in industries conducive to pandemic lifestyles. Some industries saw more establishment creation than was suggested by business application data, which may suggest a role for incumbent firms opening new establishments that complement or support the work of their existing operations. Finally, the BED data provide an early hint that the firm size distribution shifted leftward during the pandemic, with a higher share of activity accounted for by smaller firms.
These patterns of entry and exit (as well as temporary business closure) are important for understanding the pandemic economy, but they were not reflected in important official statistics in real time. For example, the monthly "jobs report" establishment survey, the Current Employment Statistics (CES), does not measure job flows associated with birth and exit but instead relies on a time series forecast informed by data from up to 12 months earlier.11 The National Income and Product Accounts (NIPA) data underlying GDP and related reports rely largely on surveys of continuing businesses. While the statistical agencies have substantially expanded their business dynamics statistical products in recent years—including the highly useful business applications data that provided a timely early preview of business entry patterns—the timeline of business entry and exit measurement remains a material limitation of the U.S. statistical system.
References
Alon, Titan, David Berger, Rob Dent, and Benjamin Pugsley. "Older and Slower: The Startup Deficit's Lasting Impact on Productivity Growth." Journal of Monetary Economics 93 no. 1:68-85.
Autor, David, David Dorn, Lawrence F. Katz, and Christina Patterson. 2020. "The Fall of the Labor Share and the Rise of Superstar Firms." The Quarterly Journal of Economics 135 no. 2:645-709.
Crane, Leland D., Ryan A. Decker, Aaron Flaaen, Adrian Hamins-Puertolas, and Christopher Kurz. 2022. "Business Exit During the COVID-19 Pandemic: Non-Traditional Measures in Historical Context." Journal of Macroeconomics 72 (June).
Dalton, Michael, Elizabeth Weber Handwerker, and Mark A. Loewenstein. 2020. "An Update on Employment Changes by Employer Size During the COVID-19 Pandemic: A Look at the Current Employment Statistics Survey Microdata. BLS Working Paper no. 532.
Davis, Steven and Till von Wachter. 2011. "Recessions and the Costs of Job Loss." Brookings Papers on Economic Activity (Fall).
Decker, Ryan, John Haltiwanger, Ron S. Jarmin, and Javier Miranda. 2017. "Declining Dynamism, Allocative Efficiency, and the Productivity Slowdown." American Economic Review: Papers & Proceedings 107 no. 5:322-26.
Dinlersoz, Emin, Timothy Dunne, John Haltiwanger, and Veronika Penciakova. 2021. "Business Formation: A Tale of Two Recessions." American Economic Association: Papers & Proceedings 111 (May):253-57.
Foster, Lucia, John Haltiwanger, and C. J. Krizan. 2006. "Market Selection, Reallocation, and Restructuring in the U.S. Retail Trade Sector in the 1990s." Review of Economics and Statistics 88 no. 4:748-58.
Francis, Theo. 2021. "Tesla, Facebook, FedEx Hired Through the Pandemic as GE, Marriott, Others Shed Jobs." The Wall Street Journal, April 4. At https://www.wsj.com/articles/big-u-s-companies-added-jobs-in-2020thanks-to-amazon-11617528602 (accessed April 22, 2022).
Fujita, Shigeru and Giuseppe Moscarini. 2017. "Recall and Unemployment." American Economic Review 107 no. 12:3875-3916.
Haltiwanger, John. 2021a. "Entrepreneurship During the COVID-19 Pandemic: Evidence from the Business Formation Statistics." NBER Working Paper no. 28912. (forthcoming, NBER Entrepreneurship and Innovation Policy and the Economy, 2022)
Haltiwanger, John. 2021b. "Entrepreneurship in the Twenty-First Century." Small Business Economics 58:27-40.
Handwerker, Elizabeth Weber and Lowell G. Mason. 2013. "Linking Firms with Establishments in BLS Microdata." Monthly Labor Review (June):14-22.
Helfand, Jessica, Akbar Sadeghi, and David Talan. 2007. "Employment Dynamics: Small and Large Firms over the Business Cycle." Monthly Labor Review (March):39-50.
O'Brien, Connor. 2022. "More Physical Places of Businesses Open Now than Pre-Pandemic, Led by Sun Belt Metros." Economic Innovation Group. At https://eig.org/more-physical-places-of-businesses-open-now-than-pre-pandemic-led-by-sun-belt-metros/ (accessed April 22, 2022).
Sadeghi, Akbar. 2008. "The Births and Deaths of Business Establishments in the United States." Monthly Labor Review (December):3-18.
1. Decker: Division of Research and Statistics at the Federal Reserve Board. Haltiwanger: University of Maryland and NBER. We thank Chris Kurz, Norm Morin, and John Stevens for helpful comments. Return to text
2. BLS data on establishment closures during the critical second quarter of 2020 became available in the end of January of 2021. Census Bureau data on firm dynamics in the Business Dynamics Statistics (BDS) product are annual snapshots of March activity; the period covering the bulk of the early pandemic period—that is, from March 2020 to March 2021—will likely be released in the fall of 2023. Return to text
3. A notable series of papers combines BLS microdata with newly developed methodologies to track employment dynamics associated with entry and exit; see Dalton, Handwerker, and Loewenstein (2020). Return to text
4. Establishment births are openings of establishments with no activity in any of the prior four quarters. Establishment exits (called "deaths" in BLS documentation) are closures of establishments that do not reopen during the four quarters subsequent to the quarter in which employment was last observed. See Sadeghi (2008) for discussion. Return to text
5. We adjust the establishment births observation for the first quarter of 2020 with an "imputed" value. Current published data for that quarter show a puzzling surge in births to 316,000 that was not present in data vintages prior to the latest BED annual revision; in correspondence with BLS staff we determined that this surge was likely spurious reflecting administrative adjustments rather than economic outcomes. For this quarter we impute a value equal to 280,000, which is the estimate published prior to the annual revision. We do not make any adjustment to the employment-weighted counterpart on the right panel of Figure 3. Return to text
6. Fujita and Moscarini (2017) show that recall is an important component of employment dynamics. Davis and von Wachter (2011) show that permanent job displacement has long-lasting detrimental effects on workers particularly in times of high unemployment. Return to text
7. Data from the Census Bureau's Business Dynamics Statistics. Existing firms are even more important on an employment-weighted basis, accounting for more than half of the jobs created by new establishments. Return to text
8. NAICS 525 is also an outlier in this direction; this industry group is funds, trusts, and other financial vehicles. Return to text
9. See Handwerker and Weber (2013) for a discussion of firm identifiers in BLS data. Return to text
10. The BLS provides net employment change from the "dynamic" (or "momentary") method at a quarterly frequency. We construct an annual tabulation by summing across quarters (such that the net change for 2021 is the sum of quarters 2020:Q2 through 2021:Q1, consistent with timing of BED annual tabulations). To understand the dynamic method, consider an example: if a firm had 1,010 employees in March 2020 and 990 employees in March 2021 (for a total net employment change of minus 20 jobs), the dynamic method would assign -11 jobs to the 1,000+ size category and -9 jobs to the 500-999 category. Return to text
11. See https://www.bls.gov/ces/methods/ces-quarterly-birthdeath.htm. Return to text
Decker, Ryan A., and John Haltiwanger (2022). "Business entry and exit in the COVID-19 pandemic: A preliminary look at official data," FEDS Notes. Washington: Board of Governors of the Federal Reserve System, May 06, 2022, https://doi.org/10.17016/2380-7172.3129.
Disclaimer: FEDS Notes are articles in which Board staff offer their own views and present analysis on a range of topics in economics and finance. These articles are shorter and less technically oriented than FEDS Working Papers and IFDP papers.