FEDS Notes
September 28, 2020
Disparities in Wealth by Race and Ethnicity in the 2019 Survey of Consumer Finances
Neil Bhutta, Andrew C. Chang, Lisa J. Dettling, and Joanne W. Hsu with assistance from Julia Hewitt1
New data from the 2019 Survey of Consumer Finances (SCF) show that long-standing and substantial wealth disparities between families in different racial and ethnic groups were little changed since the last survey in 2016; the typical White family has eight times the wealth of the typical Black family and five times the wealth of the typical Hispanic family.
This FEDS Note explores patterns in wealth holding by race and ethnicity, as well as some key issues related to the accumulation of wealth, using new data from the 2019 Survey of Consumer Finances (SCF). We first analyze total wealth among families classified, according to their self-identification during the interview, as White non-Hispanic, Black or African American non-Hispanic, Hispanic or Latino, and other or multiple race (we will henceforth refer to these groups as White, Black, Hispanic, and other, respectively).2 Wealth is defined as the difference between families' gross assets and their liabilities.3 We will describe patterns at the median (the typical household within each group) and at the mean (the average among households in each group).
In the 2019 survey, White families have the highest level of both median and mean family wealth: $188,200 and $983,400, respectively (Figure 1). Black and Hispanic families have considerably less wealth than White families. Black families' median and mean wealth is less than 15 percent that of White families, at $24,100 and $142,500, respectively. Hispanic families' median and mean wealth is $36,100 and $165,500, respectively. Other families—a diverse group that includes those identifying as Asian, American Indian, Alaska Native, Native Hawaiian, Pacific Islander, other race, and all respondents reporting more than one racial identification—have lower wealth than White families but higher wealth than Black and Hispanic families. The same patterns of inequality in the distribution of wealth across all families are also evident within race/ethnicity groups; for each of the four race/ethnicity groups, the mean is substantially higher than the median, reflecting the concentration of wealth at the top of the wealth distribution for each group.
Figure 1. White families have more wealth than Black, Hispanic, and other or multiple race families in the 2019 SCF.
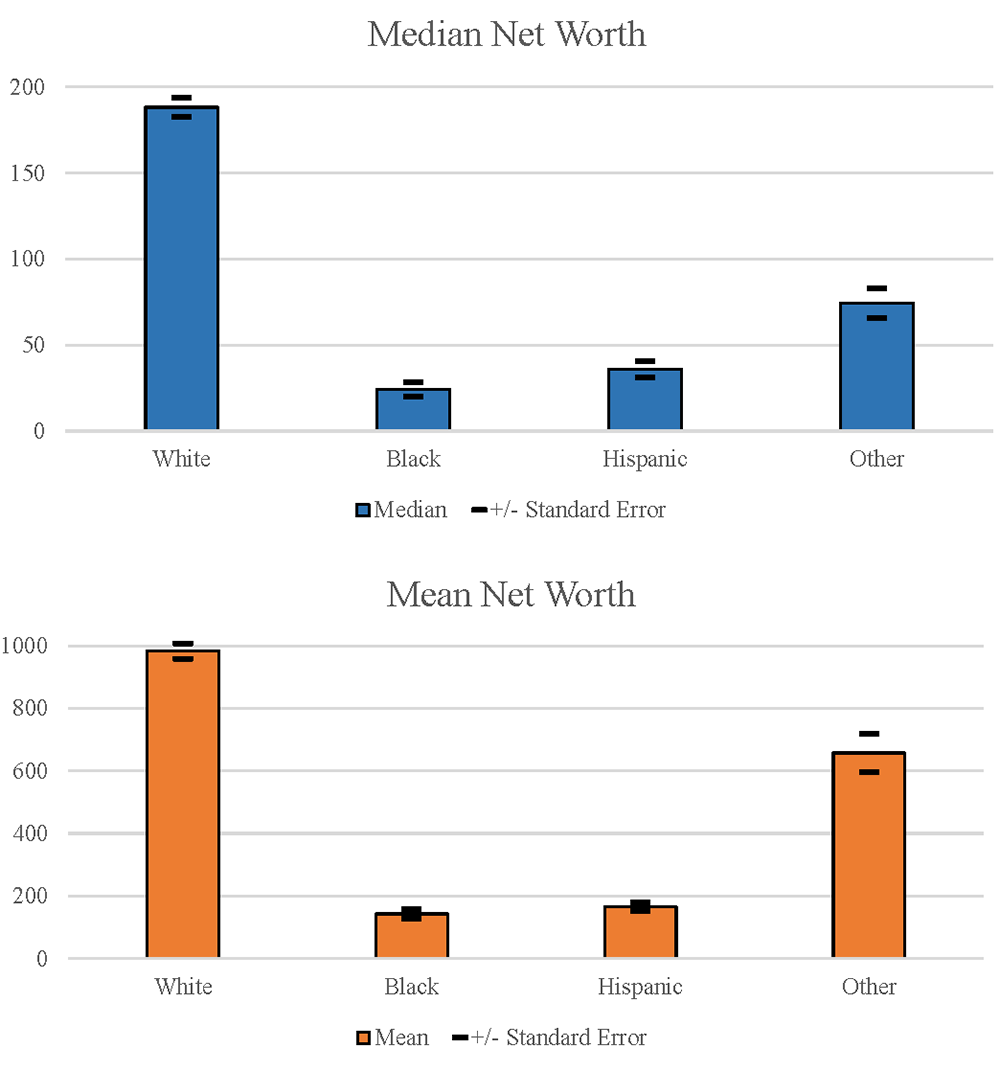
Source: Federal Reserve Board, 2019 Survey of Consumer Finances.
Notes: Figures displays median (top panel) and mean (bottom panel) wealth by race and ethnicity, expressed in thousands of 2019 dollars.
The SCF data provide a snapshot of families' wealth at a point in time. This point-in-time observation is a result of many complex societal, governmental, and individual factors that play out over the life cycle and even across generations. Among other factors, inter-generational transfers, homeownership opportunities, access to tax-sheltered savings plans, and individuals' savings and investment decisions contribute to wealth accumulation and families' financial security.4 In the remainder of this note, we use the SCF to shed light on how these factors differ by race and ethnicity and how patterns in wealth-holding have changed since the Great Recession.5 Before we move on, we note that families were primarily interviewed for the 2019 SCF before the onset of the COVID-19 pandemic and associated changes to the economy.6 Therefore, we urge readers to exercise caution in making any inferences based on the patterns described in this Note about how US families are faring in 2020.
Recent trends in wealth-holding
Between 2016 and 2019, median wealth rose for all race and ethnicity groups (Figure 2). Growth rates for the 2016–19 period were faster for Black and Hispanic families, rising 33 and 65 percent, respectively, compared to White families, whose wealth rose 3 percent, and other families, whose wealth rose 8 percent. That said, the faster growth in wealth for Black and Hispanic families only resulted in modest changes in the gaps in wealth between these families and White families. The White-Black gap in median wealth was little changed, from $163,700 in 2016 to $164,100 in 2019, and the White-Hispanic gap fell modestly from $160,000 in 2016 to $152,100 in 2019.
Figure 2. Black and Hispanic families experienced faster growth in wealth over the last two surveys after experiencing larger declines in wealth caused by the Great Recession.
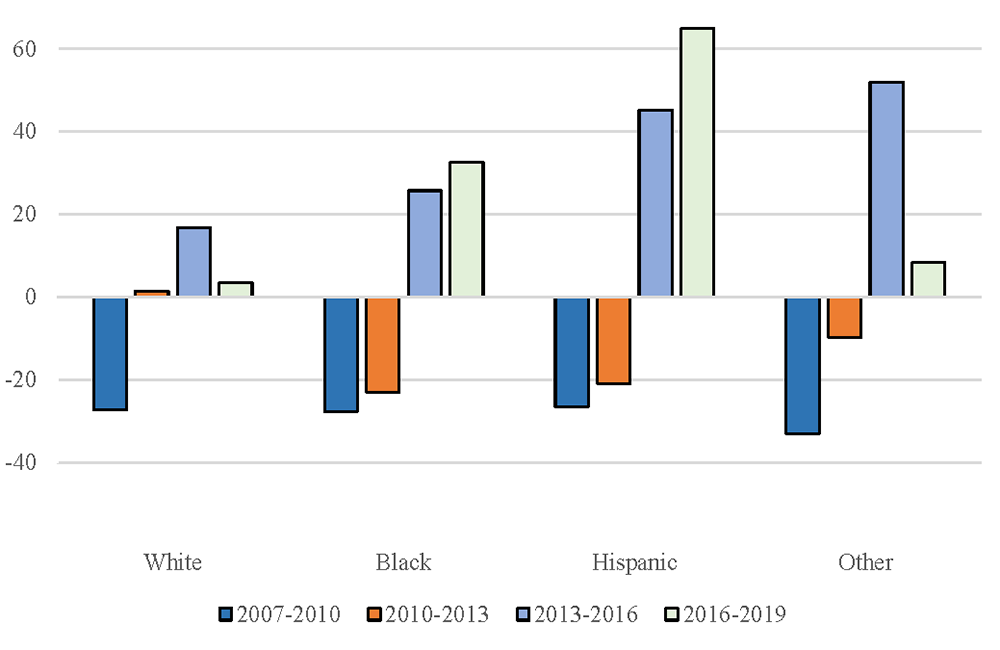
Source: Federal Reserve Board, Survey of Consumer Finances.
Notes: Figure displays percent changes in median wealth by race and ethnicity between the 2007 and 2019 Surveys. Survey years are displayed in order from left to right.
The patterns for the 2016-2019 period follow variation across groups in experiences in the Great Recession (2007 to 2010), the immediate aftermath (2010 to 2013), and the continued economic expansion (2013-2019). Median wealth fell about 30 percent for all groups during the Great Recession. However, Black and Hispanic families' wealth continued to fall an additional 20 percent from 2010 to 2013, while White families' wealth was essentially unchanged, and other families' wealth fell a more modest 10 percent. After 2013, median wealth rose for all groups, with faster growth for Black, Hispanic, and other families.
Despite growth over the last two surveys, the typical White family and the typical Black family have yet to recover to their pre-Great Recession levels of wealth. Over the entire 2007-2019 period, wealth fell by 11 percent for the typical White family and by 7 percent for the typical Black family. Only the typical Hispanic family has seen an increase in wealth relative to before the Great Recession, rising by about 39 percent, while the typical other family's wealth is about unchanged since before the Great Recession.
While these cumulative changes in wealth from 2007-2019 may seem striking, there are two important issues related to the interpretation of changes over time in the SCF from Figure 2, particularly over the full time period.
First, the SCF interviews a different random sample of US families every three years. The same family does not appear in consecutive SCFs. Therefore, the appropriate interpretation of the survey-to-survey changes for a particular group, or cumulative changes over multiple surveys for a particular group, is about the typical (or average) family within that group. The inappropriate interpretation is changes for a specific family over time.
Second, the types and number of families that make up each race or ethnicity group change over time as the underlying population of US families changes. Among other factors, population aging, changes to immigration flows, and the evolution of self-identification patterns alter the composition of each race or ethnicity group between surveys. For example, in the 2016 survey, the other or multiple race group was composed of 50 percent reporting more than one racial identification and 30 percent reporting Asian, whereas in 2019 these figures changed to 69 percent and 23 percent, respectively. Therefore, appropriately interpreting changes in a group's wealth, especially over longer time periods, requires acknowledging compositional shifts within each group. In particular, the robust growth in Hispanic wealth over the last two surveys and the marked slowdown of growth for other families in 2019 are at least partially attributable to compositional shifts in the types of families that make up these groups.
Wealth over the life-cycle
Wealth accumulation generally follows a predictable life-cycle arc, wherein families generally accumulate wealth during their working years, in preparation for retirement. Table 1 displays median wealth by age category based on the age of the reference person, separately, for White, Black, Hispanic, and other families.7 Following the expected life-cycle savings patterns, within each race or ethnicity group median wealth is sharply higher for middle-aged families (35 to 54) compared to young families (under 35) and is highest among older families (55 and over).
Table 1: Wealth rises with age for all families, but substantial wealth gaps between White and non-White families persist throughout the life-cycle.
| White | Black | Hispanic | Other | |
|---|---|---|---|---|
| Under 35 | 25.4 | 0.6 | 11.2 | 13.5 |
| 35-54 | 185.0 | 40.1 | 46.1 | 154.5 |
| Over 55 | 315.0 | 53.8 | 111.5 | 213.2 |
Source: Federal Reserve Board, 2019 Survey of Consumer Finances.
Notes: Table displays median wealth by age group and by race and ethnicity in thousands of 2019 dollars.
Within each age group, the SCF data indicate large differences in wealth across racial and ethnic groups. Even among young families who have had relatively little time to accumulate wealth, there are sizeable differences in wealth by race and ethnicity, most starkly between young Black and young White families. The median young Black family has almost no wealth ($600). In contrast, the median young White family has a wealth of $25,400. Young Hispanic and other families fall in between, with $11,200 and $13,500 in median wealth, respectively. Differences in parental resources may contribute to these early life cycle gaps, which we will discuss in the next section.
In absolute terms, the gaps in median wealth between White and non-White families widen considerably at older ages. For example, amongst families under 35, White families have between $11,900 and $24,800 more in median wealth than Black, Hispanic, or other families. For families over age 55, the gaps widen to between $101,700 and $261,100. In proportional terms, however, the gaps are relatively stable or diminish with age. With respect to the Black-White gap at middle and older ages, the median wealth of White families is four to six times greater than the median wealth of Black families. These within-age ratios are somewhat lower than the Black-White ratio of nearly eight for all families combined (implied by Figure 1).
Inheritances and other family support
Wealth-holding can differ across groups due to the intergenerational transmission of wealth. There are numerous ways families can transmit wealth and resources across generations. Families can directly transfer their wealth to the next generation in the form of a bequest. They can also provide the next generation with inter vivos transfers (gifts), for example, providing down payment support to enable a home purchase or a substantial wedding gift. By some estimates bequests and transfers account for at least half of aggregate wealth (Gale and Scholz 1994), have recently averaged 3 percent of total household disposable personal income (Feiveson and Sabelhaus 2018), and account for more of the racial wealth gap than any other demographic or socioeconomic indicator (Hamilton and Darrity 2010).8 In addition to direct transfers or gifts, families can make investments in their children that indirectly increase their wealth. For example, families can invest in their children's educational success by paying for college or private schools, which can in turn increase their children's ability to accumulate wealth. For these reasons, wealth (or a lack thereof) can persist across generations and reflect, among other factors, a legacy of discrimination or unequal treatment in housing, education, and labor markets.9
One reason wealth-holding is relatively high among White families is they are considerably more likely to have received an inheritance or gift. Another reason is White families report other indicators associated with higher levels of family support (Table 2). For example, nearly 30 percent of White families report having received an inheritance or gift, compared to about 10 percent of Black families, 7 percent of Hispanic families, and 18 percent of other families. Conditional upon receiving an inheritance or gift, White families also tend to receive larger inheritances.
Table 2: White families are substantially more likely to receive inheritances, gifts and other family support than Black and Hispanic families
| White | Black | Hispanic | Other | |
|---|---|---|---|---|
| Recieved an Inheritance (Percent) | 29.9 | 10.1 | 7.2 | 17.8 |
| Conditional Median Inheritance (Thousands of 2019 dollars) | 88.5 | 85.8 | 52.2 | 59.4 |
| Expect an Inheritance (Percent) | 17.1 | 6.0 | 4.2 | 14.7 |
| Conditional Median Expected Inheritance (Thousands of 2019 dollars) | 195.5 | 100.0 | 150.0 | 100.0 |
| Could get $3,000 from family or friends (Percent) | 71.9 | 40.9 | 57.8 | 63.4 |
| Parent(s) have a College Degree (Percent) | 34.4 | 24.8 | 15.2 | 40.0 |
Source: Federal Reserve Board, 2019 Survey of Consumer Finances.
Notes: Table displays inheritances and gifts received, expected inheritances, and other indicators of family support, by race and ethnicity, expressed in either Percent or Thousands of 2019 dollars. Parent(s) with a college degree refers to the parents of the reference person.
Some families may not yet have received an inheritance (for example, if their parents are still alive), but expect to receive one in the future. White families are both more likely to have received an inheritance and are also more likely to expect to receive an inheritance: about 17 percent of White families expect an inheritance, compared to 6 percent of Black families, 4 percent of Hispanic families, and 15 percent of other families. Similarly, conditional upon expecting to receive an inheritance in the future, White families expect to receive relatively larger inheritances.
White and other families are more likely to report other indicators associated with higher levels of family support. For example, White and other families are considerably more likely to report being able to obtain $3,000 from a family member or friend in a financial emergency than Black or Hispanic families. They are also more likely to have a parent with a college degree. Since higher levels of education are associated with higher levels of wealth (see, for example, the Bulletin article), this association suggests White and other families are likely to have wealthier parents than Black or Hispanic families.
Homeownership
For many families, housing is the biggest component of wealth. The relationship between housing and family wealth is complex. On the one hand, the ability to purchase a home is a reflection of wealth a family already has (or their parents' wealth, as noted earlier), as significant funds are generally required for a down payment and closing costs. On the other hand, homeownership has also been found to yield strong financial returns on average and to be a key channel through which families build wealth (Goodman and Mayer 2018).10
Life-cycle patterns of homeownership by age and by race and ethnicity are similar to the patterns of wealth (Figure 3). Homeownership rises sharply from young to middle-age regardless of race or ethnicity. At the same time, within each age group there are significant gaps in homeownership between White and non-White families, with the biggest gaps between White and Black families. Among young families, about 46 percent of White families own their home, compared to just 17 percent of Black families. This gap may partially reflect differences in parental wealth, as previous research has found that Black families are far less likely to receive down payment assistance from their parents, delaying transitions into homeownership (Charles and Hurst 2002).11
Figure 3. Homeownership rises with age regardless of race or ethnicity, though there are significant differences in homeownership between White and non-White families throughout the life-cycle.
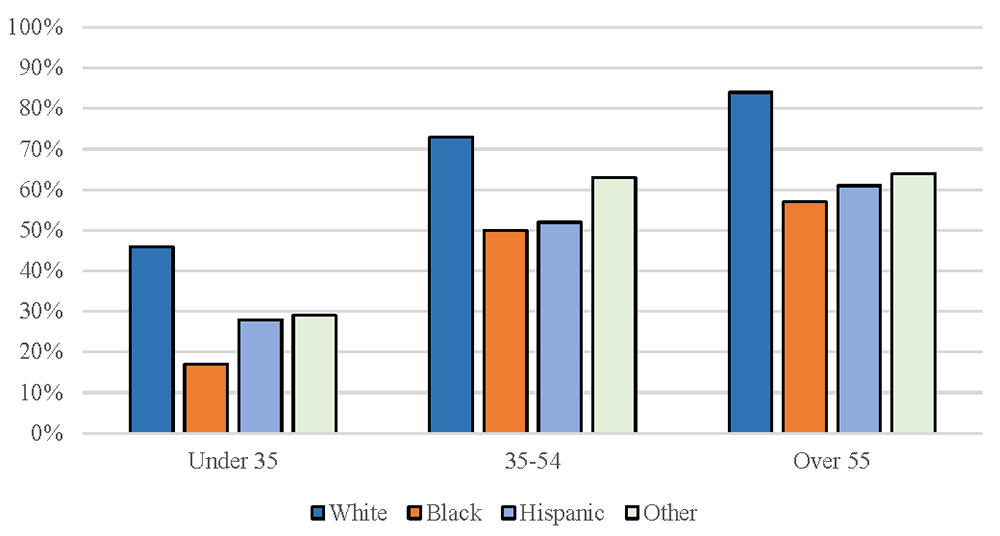
Source: Federal Reserve Board, 2019 Survey of Consumer Finances.
Notes: Figure displays homeownership rates by age group and by race and ethnicity. Race categories are displayed in order from left to right.
This Black-White gap of nearly 30 percentage points narrows somewhat among middle-aged and older families. For example, 73 percent of middle-aged White families own their home compared to about 51 percent of middle-aged Black families. Meanwhile, the gap in the homeownership rate between young White families and young Hispanic families is about 18 percentage points. In contrast to the White-Black gap, the White-Hispanic homeownership gap expands somewhat among middle-aged and older families.
In addition to gaps in homeownership, there are also significant gaps in home values among homeowners by race and ethnicity. For homeowners, the typical White families' home value is $230,000 and the typical other families' home value is $310,000. The typical Black and Hispanic families' home values are lower, at $150,000 and $200,000, respectively. Gaps in home values are caused both by gaps in purchase prices and housing appreciation, which are a reflection of a combination of factors including resource gaps (e.g., income and down payments), residential segregation, and age of entry into homeownership.12
Retirement accounts and plan participation
Participation in retirement accounts and retirement plans is another important channel through which families build wealth, and they provide financial security in retirement. These assets include individual retirement accounts (IRAs), which typically are not dependent on a family's employer, and two types of employer-sponsored plans: defined contribution plans (DC), which are account-type job pensions such as 401(k)s, and traditional pensions (defined benefit plans, DB). Assets held in IRA and DC account plans are subject to preferential tax treatment, and DB plans guarantee a stream of income in retirement.
Ownership of IRA and DC retirement accounts rises among middle-aged families and then falls among older families (Figure 4). In all age groups, Black and Hispanic families are far less likely to have such retirement accounts. For example, among middle-aged families –who have the highest rates of account ownership— 65 percent of White families have at least one retirement account, compared to 44 percent of Black families, and just 28 percent of Hispanic families.
Figure 4. Retirement account ownership peaks at middle age, though ownership is less likely for Black and Hispanic families at all ages.
Source: Federal Reserve Board, 2019 Survey of Consumer Finances.
Notes: Figure displays the percent of families that own a retirement account (IRA or DC plan) with a net positive balance by age group and by race and ethnicity. Race categories are displayed in order from left to right.
One reason for gaps in participation in retirement accounts is that not all families are eligible to participate in an employer-sponsored retirement plan. Families may not be eligible for an employer plan because their employer does not offer plans at all or they are offered but the employee is not eligible (for example, because the employee works part time or the employee has insufficient tenure at the company). Families who lack access to employer-sponsored plans miss out on a common added benefit: many employers contribute to these plans, either by matching some or all of the employee's contributions to the plan in the case of DC plans or by providing employees a guaranteed income stream in retirement for DB plans.
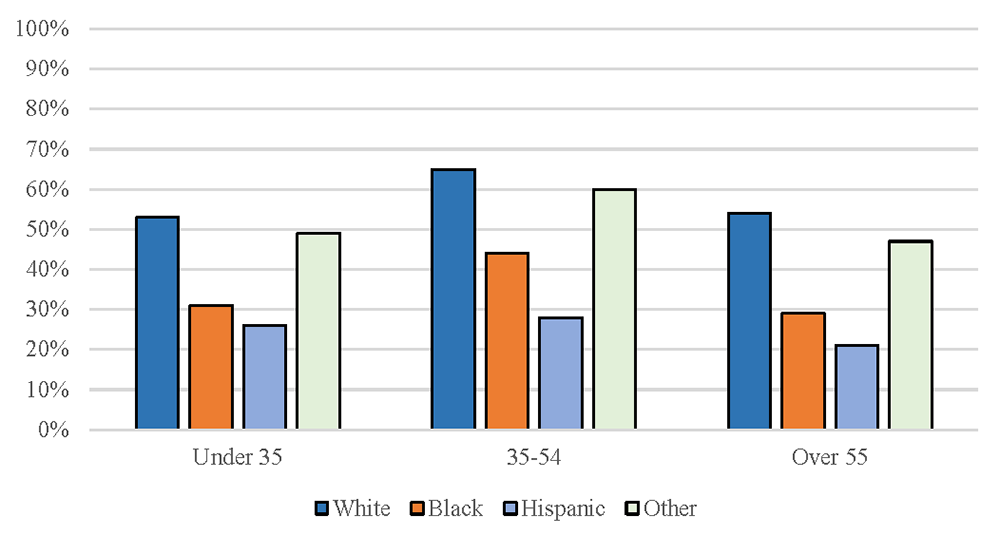
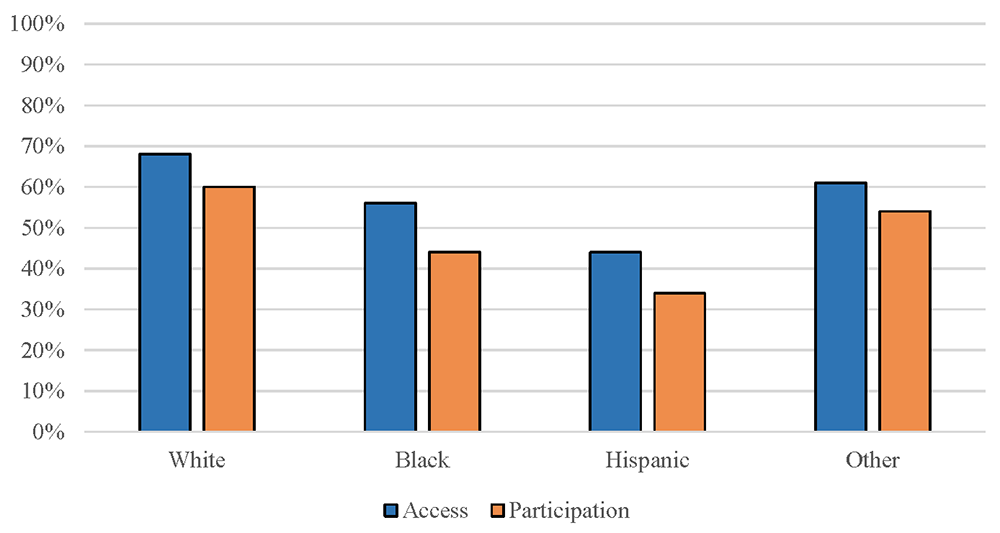
Among working-age families (those under age 55), White families and – to a lesser extent other families – have more widespread access to employer-sponsored retirement plans than Black or Hispanic families (Figure 5, blue bars).13 The disproportionate access for White families relative to Hispanic families is the most stark – for every three White families that can access an employer-sponsored retirement plan only two Hispanic families have access.
Figure 5. White and other or multiple race families have broader access and participate more in employer-sponsored retirement plans.
Source: Federal Reserve Board, 2019 Survey of Consumer Finances.
Notes: Figures displays the percent of families with access to employer-sponsored retirement plans (DC or DB plans, blue bars) and the percent of families that participate in an employer-sponsored retirement plan (orange bars) among families under 55 years old, by race or ethnicity. Key identifies bar chart in order left to right.
Even for those families with access to an employer-sponsored plan, not all families opt to participate in a plan. For working-age families, participation rates are lower than access rates (Figure 5, orange bars). About 60 percent of White and 54 percent of other families participate in a retirement plan, compared to 45 percent of Black families and 34 percent of Hispanic families. The share of each group that participates among those with access –also known as the "take-up" rate—also varies across groups. In addition to having higher rates of access, take-up rates are higher amongst White and other families than Black or Hispanic families. While about 90 percent of White and other families with access to a plan participate, about 80 percent of Black families and about 75 percent of Hispanic families with access to a plan participate (implied by Figure 5). These differences in participation may be caused by a variety of factors, including whether or not a family has sufficient income to enable saving in this manner, the types of funds offered by employer-sponsored plans, whether participation is by default or not, and financial literacy.
IRA and DC plans can only provide financial security in retirement if families accrue sufficient balances in the plans through investment contributions and subsequent returns on those contributions. Among working-age families, balances in retirement accounts also vary by race and ethnicity, and balances are larger amongst groups with higher rates of access and participation. For working-age families that have balances in such accounts, the typical White family has about $50,000 saved, which is two and a half times the amount saved as the typical Black or Hispanic family, who have about $20,000 saved in retirement accounts. The median balances for other families falls in between White and Black or Hispanic families, at about $34,000. Difference in balances likely reflect a combination of factors including differences in returns from the funds that contributions are invested in, differences families' lifetime contributions to retirement accounts, and differences in employer matching to DC plans. For example, the differences in access to employer-sponsored plans (Figure 5) imply that fewer Black or Hispanic families are eligible for a plan with an employer match.
Overall, these gaps in retirement plan access, participation, and account balances suggest non-White families will be less financially secure in retirement than White families. But our discussion ignores Social Security benefits and the net present value of DB plans, which are key components of many families' retirement planning. These benefits are hard to account for because they involve assumptions about families' future earnings and years of work. Still, research suggests that accounting for these benefits can reduce overall inequality in retirement resources (Bricker, Goodman, Moore, and Volz, 2020; Sabelhaus and Volz, forthcoming).14
Emergency Savings
Families often aim to build up easily-accessible savings to help deal with unexpected expenses and disruptions to their income. Although interest rates on highly-liquid transaction accounts are generally quite low and, as a result, these highly-liquid accounts are less important for long-term wealth-building than higher-return assets like housing or retirement accounts, savings can help families avoid costly borrowing or missed payments when unexpected events arise.
Nearly all families have some type of highly-liquid asset, such as a checking account, savings account, or pre-paid card (Table 3). Conditional upon having a liquid asset, however, the typical White family has considerably more liquid savings than the typical Black, Hispanic, or other family. While the typical Black or Hispanic family has $2,000 or less in liquid savings, the typical White family has more than four times that amount. Other families fall somewhere in the middle, with the typical family holding $5,000 in liquid savings.
Table 3: White families have more emergency savings than Black or Hispanic families.
| White | Black | Hispanic | Other | |
|---|---|---|---|---|
| Has Liquid Assets (Percent) | 98.8 | 96.8 | 95.5 | 98.8 |
| Conditional Mean Liquid Assets (Thousands of 2019 dollars) | 8.1 | 1.5 | 2.0 | 5.0 |
| Has Direct or Indirect Equity (Percent) | 60.8 | 33.5 | 24.2 | 53.8 |
| Conditional Median of Equities (Thousands of 2019 dollars) | 50.6 | 14.4 | 14.9 | 28.8 |
Source: Federal Reserve Board, 2019 Survey of Consumer Finances.
Notes: Liquid assets and equities by race and ethnicity, expressed in either Percent or Thousands of 2019 dollars.
Families may also choose to tap into higher-return assets in a financial emergency, such as money stored in directly or indirectly-held equities. These assets include directly-held stocks and mutual funds, which can be sold, and equities held in quasi-liquid accounts (such as retirement accounts), which can be liquidated or borrowed against if a financial emergency were to occur.
There are substantial disparities in ownership of equities across families grouped by their race and ethnicity. While more than half of White and other families have equities, just over 24 percent of Hispanic families and just under 34 percent of Black families have any equities. Conditional on having equities, there are also substantial gaps in amounts held. For example, the typical White family has $50,600 in equities they could tap into in an emergency, compared to just $14,400 for the typical Black family and $14,900 for the typical Hispanic family.
These gaps in emergency savings are particularly relevant in light of the COVID-19 pandemic and associated job losses. Because the 2019 SCF data were collected just before the onset of the pandemic, these gaps in savings suggest large disparities in families' ability to weather the pandemic. Indeed, Bhutta, Blair, Dettling, and Moore (2020) find that without the substantial cash assistance included in the Coronavirus Aid, Relief, and Economic Security (CARES) Act, there would be large disparities by race and ethnicity in the share of families who could cover their normal, recurring expenses if they were to lose their job for six months or more.15 They find that just 10 percent of Hispanic families and 14 percent of Black families have enough savings to cover six months of expenses, compared to 36 percent of White families and 27 percent of other families. But with the cash assistance in the CARES Act (i.e., unemployment insurance and direct stimulus payments), over 90 percent of all family-groups could cover their expenses for six months. Still, much of the CARES Act has expired or will expire in the coming months. If job losses persist, then unequal levels of savings could lead to disparities by race or ethnicity in financial distress during the pandemic. Furthermore, growing evidence suggests Black, Hispanic, and Native American communities are being disproportionally affected by the health and economic effects of COVID-19.16
1. Division of Research and Statistics, Board of Governors of the Federal Reserve System. The analysis and conclusions set forth are those of the authors and do not reflect the views of the Board of Governors or the Federal Reserve staff. Bhutta: [email protected], Chang: [email protected], ORCID 0000-0002-9769-789X, Dettling: [email protected], Hsu: [email protected], ORCID 0000-0002-0715-6230. Return to text
2. For more on the race and ethnicity classifications used in this FEDS Note, see the appendix to Neil Bhutta, Jesse Bricker, Andrew C. Chang, Lisa J. Dettling, Sarena Goodman, Joanne W. Hsu, Kevin B. Moore, Sarah Reber, Alice Henriques Volz, and Richard A. Windle. 2020. "Changes in U.S. Family Finances from 2016 to 2019: Evidence from the Survey of Consumer Finances (PDF)," Federal Reserve Bulletin 106(5) (henceforth, the Bulletin article). The other or multiple race group consists of a very racially/ethnically diverse set of families, including those identifying as Asian, American Indian, Alaska Native, Native Hawaiian, Pacific Islander, other race, and all respondents reporting more than one racial identification. Because of small sample sizes, we do not have statistical power to further disaggregate this group of families. In 2019, families reporting more than one racial identification were the largest subgroup of the other or multiple race group (about 69 percent of families), followed by Asian families (about 23 percent of families). Because of the varied composition of the other group and changes in its composition over time, readers should exercise caution when making inferences. Return to text
3. Our concept of wealth is equivalent to the net worth concept defined in the Bulletin article. See the appendix to the Bulletin article for more details on components of wealth or net worth. Except for received inheritances, dollar values are adjusted to 2019 dollars using the "current methods" version of the consumer price index for all urban consumers (CPI-U-RS), which is available since 1977. Received inheritances are adjusted to 2019 dollars using the consumer price index for all urban consumers (CPI-U) to account for inheritances received prior to 1977. Return to text
4. For a recent discussion of the Black-White wealth gap, see Kriston McIntosh, Emily Moss, Ryan Nunn, and Jay Shambaugh. 2020. "Examining the Black-white wealth gap." Brookings Institution, February 27, 2020. Return to text
5. For more information on how other components of wealth and socio-demographic characteristics vary by race and ethnicity –which were, in general, little changed since the 2016 survey—see Lisa J. Dettling, Joanne W. Hsu, Lindsay Jacobs, Kevin B. Moore, and Jeffrey P. Thompson. 2017. "Recent Trends in Wealth-Holding by Race and Ethnicity: Evidence from the Survey of Consumer Finances," FEDS Notes. Washington: Board of Governors of the Federal Reserve System, September 27, 2017. Return to text
6. See the appendix to the Bulletin article for more information on the timing of interviews. Return to text
7. See the appendix to the Bulletin article for the definition of the reference person. Return to text
8. William Gale and John Karl Scholz. 1994. "Intergenerational Transfers and the Accumulation of Wealth." Journal of Economic Perspectives, 8(4): 145-160. Laura Feiveson and John Sabelhaus. 2018. "How Does Intergenerational Wealth Transmission Affect Wealth Concentration?" FEDS Notes. Washington: Board of Governors of the Federal Reserve System, June 1, 2018. Darrick Hamilton and William Darity. 2010. "Can 'Baby Bonds' Eliminate the Racial Wealth Gap in Putative Post-Racial America?" The Review of Black Political Economy 37(3–4): 207–16. Return to text
9. For a more detailed discussion of discrimination and institutional barriers in housing markets, see, for example, The Color of Law (2017) by Richard Rothstein or Race for Profit (2019) by Keeanga-Yamahtta Taylor. For more on inequities in educational opportunities, see, for example, Ivy Morgan and Ary Amerikaner (2018) "Funding Gaps: An Analysis of School Funding Equity Across the U.S. and within Each State" or Children of the Dream (2019) by Rucker C. Johnson. For more on labor market outcomes, see, for example, Devah Pager (2007) "The Use of Field Experiments for Studies of Employment Discrimination: Contributions, Critiques, and Directions for the Future" Annals of the American Academy of Political and Social Sciences 609 (January): 104-133, or Raj Chetty, Nathaniel Hendren, Maggie R. Jones, and Sonya R. Porter (2020) "Race and Economic Opportunity in the United States: an Intergenerational Perspective" The Quarterly Journal of Economics 135(2); 711–783. Return to text
10. Laurie S. Goodman and Christopher Mayer. 2018. "Homeownership and the American Dream." Journal of Economic Perspectives 32(1): 31-58. Return to text
11. Kerwin Kofi Charles and Erik Hurst. 2002. "The Transition to Home Ownership and the Black-White Wealth Gap." The Review of Economics and Statistics 84(2): 281–297. Return to text
12. A previous FEDS Note on this topic has additional information on income and other resource gaps by race and ethnicity (Dettling, Hsu, Jacobs, Moore, and Thompson 2017). The Color of Law (2017) by Richard Rothstein provides a detailed discussion on the lasting effects of residential segregation. Return to text
13. We count families as having access to an employer-sponsored plan if either the reference person or the spouse/partner of the reference person is eligible to participate in a DC or a DB plan provided by a current employer plus all families that participate in DC or a DB plan, which are those families that have a retirement account with a balance from a previous employer, have the rights to a future pension from a previous employer, or are self-employed at a business that offers a pension, retirement, or tax-deferred savings plan. Return to text
14. Jesse Bricker, Sarena Goodman, Kevin Moore, and Alice Henriques Volz. 2020. "Wealth and Income Concentration in the SCF: 1989-2019," FEDS Notes. John Sabelhaus and Alice Henriques Volz (forthcoming). "Social Security Wealth, Inequality, and Lifecycle Saving," in Measuring and Understanding the Distribution and Intra/Inter-Generational Mobility of Income and Wealth. NBER Book Series Studies in Income and Wealth. The University of Chicago Press. Return to text
15. Neil Bhutta, Jacqueline Blair, Lisa Dettling, and Kevin Moore. 2020. "COVID-19, the CARES Act, and Families' Financial Security" National Tax Journal 73(3): 645-672. Return to text
16. For health effects, see, for example, "The COVID Racial Data Tracker". For economic effects, see, for example, Steven Brown (2020) "How COVID-19 is Affecting Black and Latino Families' Employment and Financial Well-Being" Urban Institute, May 6, 2020. Return to text
Bhutta, Neil, Andrew C. Chang, Lisa J. Dettling, and Joanne W. Hsu (2020). "Disparities in Wealth by Race and Ethnicity in the 2019 Survey of Consumer Finances," FEDS Notes. Washington: Board of Governors of the Federal Reserve System, September 28, 2020, https://doi.org/10.17016/2380-7172.2797.
Disclaimer: FEDS Notes are articles in which Board staff offer their own views and present analysis on a range of topics in economics and finance. These articles are shorter and less technically oriented than FEDS Working Papers and IFDP papers.