FEDS Notes
July 28, 2023
Empirical assessment of SR/CA small-dollar lending letter impact
Daniel Gorin, Sarah Gosky, and Michael Suher
Guidance is used by bank regulators to communicate supervisory expectations to both examiners and banks. In March 2020, in response to pandemic shut-downs, financial regulators issued a joint statement encouraging small-dollar lending to meet temporary cash-flow imbalances, unexpected expenses, or income short-falls. The letter further highlighted that offering short-term, unsecured credit products to creditworthy borrowers would be considered favorably for Community Reinvestment Act (CRA) purposes. A follow-up letter was issued on May 20th elucidating lending principles for responsible small-dollar loans.
This guidance was atypical in that it encouraged an activity whereas past guidance tended to highlight areas of concern. Expectations for their real-world impact were low, with the rapid interagency agreement and issuance in the face of the looming pandemic-induced recession seen as a success in itself. Our empirical assessment suggests that the letters did drive some discernable increases in lending in the small-dollar space. Our most plausibly causal estimate suggests that lending in this area was on average at least 3% higher at banks by the end of 2021 than in the absence of the letters.
Delving into the mechanisms mediating the success of the guidance at influencing bank behavior, a few key lessons emerged. Direct federal regulator contact, that may have raised the salience of or helped with understanding the new guidance, was critical. Promised CRA credit was not a meaningful incentive for the bulk of firms who were already rated compliant. The most community-oriented lenders though, a small subset of banks with top CRA ratings, did dramatically increase lending in this space. Finally, the relative conservatism of some banks' business models places a ceiling on how impactful encouraging guidance can be.
Most earlier instances of supervisory guidance tended to caution about certain activities like deposit advance products or set specific expectations as in the LIBOR transition.1 These past instances have proved to have a material effect on bank behavior. Bassett and Marsh (2017) study the 2006 guidance on commercial real estate (CRE) lending which set concentration thresholds above which supervisory scrutiny of risk-management processes would be heightened. They find that the guidance induced slower growth of CRE portfolios at banks above the thresholds. Calem, Correa, and Lee (2016) assess the 2013 Interagency Guidance on Leveraged Lending which set out expectations for risk management of leveraged lending activities. They find that originations of speculative-grade syndicated loans declined notably after the issuance of follow-on FAQs in 2014. More broadly, Phillips (2022) spells out the support for supervisory guidance within the administrative law framework and highlights its utility in ensuring a uniform regulatory system for banks.
Empirically measuring the response or lack thereof to these letters is challenging given the complex shock of the onset of the pandemic. Supply of newly underwritten credit shifted in as uncertainty and banks' expected losses increased. Available funding for new loans was directly reduced by an increase in loss allowances and rapid precautionary draws of existing corporate credit lines. At the same time demand for small-dollar consumer loans was presumably increased for some households though quickly drastically reduced for most others. This large drop in demand stemmed from the extensive stimulus measures in the Coronavirus Aid, Relief, and Economic Security (CARES) Act including direct payments, enhanced and extended unemployment insurance, moratoriums on evictions, forbearance on government backed student loans, and encouraged forbearance on mortgages.
Aggregate statistics on personal savings bear out the impact on household balance sheets. The top left panel of Figure 1 shows personal saving rates from the Bureau of Economic Analysis (BEA). This rate, that averaged between 7 and 8% pre-pandemic, reached above 25% in the second quarter of 2020. It did not return to pre-pandemic levels until Q4 2021. Further, research from the JPMorgan Chase Institute (2021) documents that checking account balances grew the most in percentage terms for households in the bottom-income quartile. Reponses to the Fed's Senior Loan Officer Opinion Survey on Bank Lending Practices (SLOOS) further corroborate the pull-back in loan demand. The top right panel shows that the net percent of respondents reporting stronger demand for other consumer loans dropped below negative 40% in the quarter immediately following the first SR/CA letter issuance. The same survey also captures the drastic pull-back in lending appetite occurring alongside the reduction in loan demand. The bottom two panels of Figure 1 show that most banks were tightening standards for other consumer loans and exhibiting a decreased willingness to make consumer installment loans.
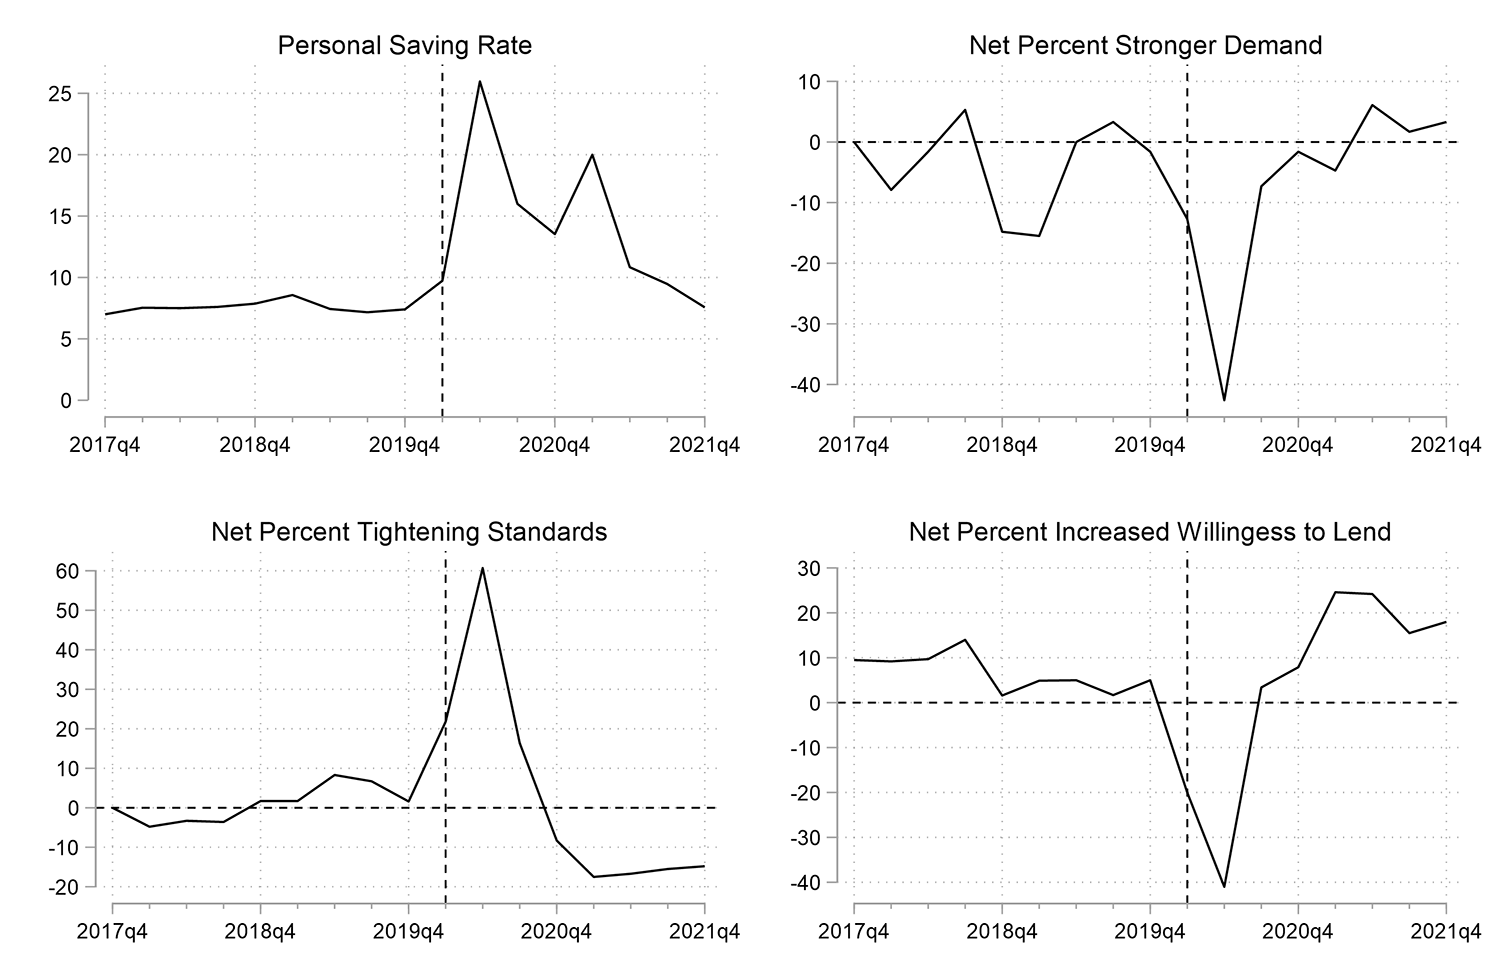
Note: "Net Percent" refers to the fraction of banks that reported having stronger demand/tightened/increased willingness to lend minus the fraction of banks that reported having weaker demand/loosened/decreased willingness to lend. In all 4 panels is a vertical dashed line marked at 2020Q1.
Source: BEA for personal savings rate and SLOOS for lending conditions.
In this environment, attributing any increase in small-dollar lending post letter issuance to its effectiveness, or lack of an increase to its ineffectiveness, is fraught. To deal with this empirical challenge we rely on cross-sectional comparisons between banks, facing, on average, arguably similar changes in supply and demand of these loans, but whose experience was otherwise different in some way. This can help identify whether some banks did react to the letters and perhaps illuminate why more did not.
We will look at three possible channels whereby the letters could have differentially impacted bank behavior: communication, incentives, and risk tolerance. Though the small-dollar lending guidance sought to encourage new activity, this encouragement was complicated by parallel exhortations to remain consistent with safe and sound banking practices and applicable laws, including consumer protection laws. In addition, bank attention was understandably gripped by pandemic related financial market stress and uncertainty. In this environment, closer contact with the federal regulators who issued the letters could have raised the salience of the new guidance or aided firms in understanding its strictures in a way that boosted the letters' impact on lending behavior. The first letter also telegraphs that small-dollar lending in response to customer needs from the pandemic shock would count favorably for CRA assessments. This suggests that banks with imminent CRA exams or low CRA ratings entering the pandemic might be more inclined to expand small-dollar offerings. Finally, an individual bank's risk tolerance might differentiate how receptive a bank was to the new guidance. This could be due to a long-standing conservative business model. Alternatively, with defaults across many portfolios expected to rise, banks with thinner capital cushions might be more hesitant to launch or expand small-dollar offerings potentially viewed as low profit and high risk.
Data
Another challenge in measuring the impact of the SR\CA letters on bank lending activities is a lack of data granularity in this space. While more detailed data on originations and unsecured consumer lending is collected for the largest banks in the Y14 report, for the vast majority of banks, the lending encouraged by the letters is part of the "Other Consumer Loans" balance sheet item in the Call report. This category encompasses "loans to individuals for household, family, and other personal expenditures" excluding auto loans and credit cards. In addition to the small-dollar activity we are trying to track, this loan category also contains student loans. Some firms do provide student loan balances separately on Schedule RC-O of the Call report. For banks reporting student loan balances in all periods, these are subtracted from "Other Consumer Loans" while firms with positive student loan balances reported in some but not all quarters are removed from the sample. Because this will not remove all student loan balances from the data, we will rely on cross-sectional comparisons between groups of banks divided along dimensions that should be orthogonal to trends in student lending. The analysis will focus on trends in this student-loan adjusted series for 4,169 commercial banks.
Figure 2 plots this adjusted Other Consumer series aggregated across the sample of banks and as a share of aggregate lending. By year end 2021, there was $300 billion in outstanding balances accounting for around 3.1% of overall lending. While activity in this space is increasing overall, and as a share of lending, post-letter issuance (denoted by the vertical dashed line), this appears to be a continuation of pre-pandemic trends. This suggests we will need to rely on the cross-sectional comparisons laid out above to say more definitively whether the letters had a discernable impact.
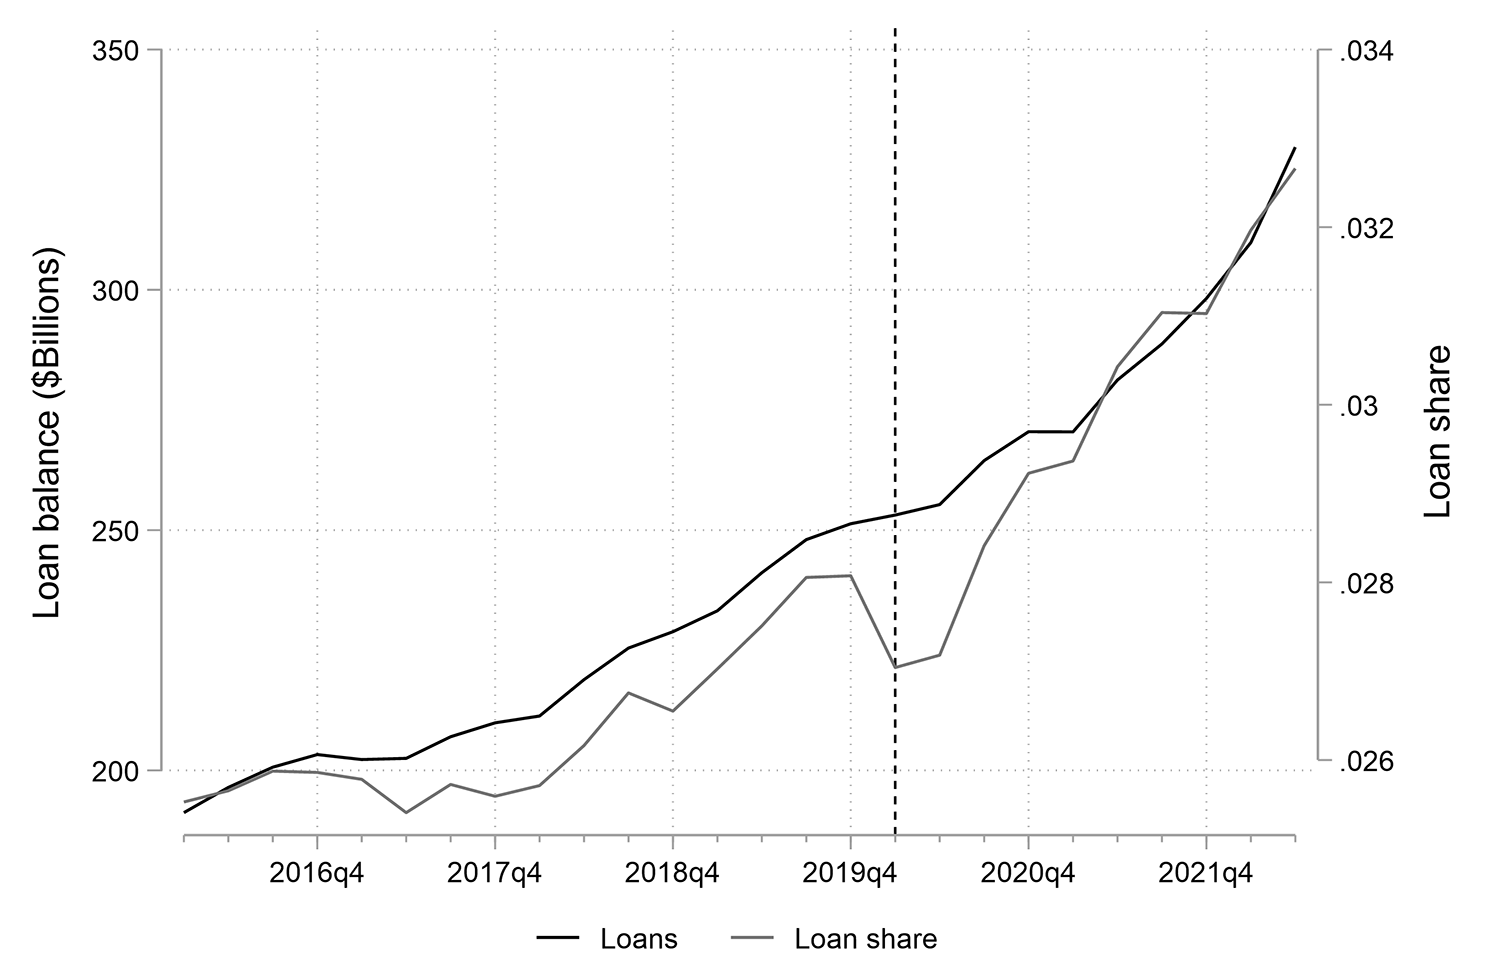
Note: "Other Consumer Loans" are loans to individuals for household, family, and other personal expenditures excluding auto loans and credit cards. Student loan balances are removed when reported separately. Loan balance comprises aggregate outstanding other consumer loans balances across all commercial banks, and loan share is this amount divided by total loan balances in all categories at these banks. Vertical dashed line marked at 2020Q1.
Source: Call Reports
Communications
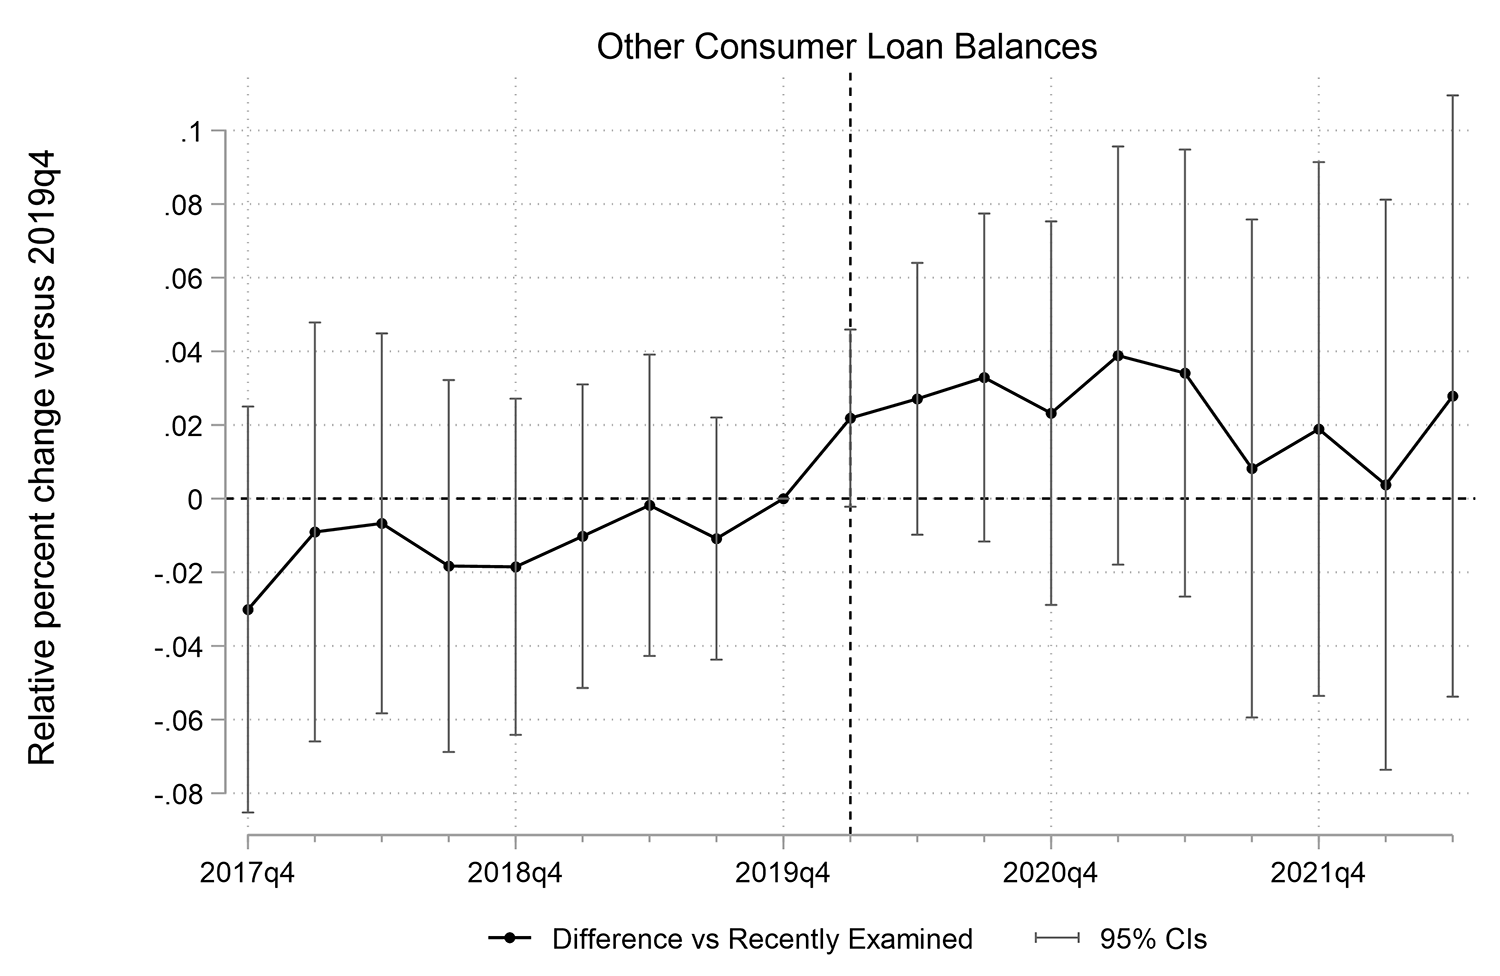
Figure 3 plots the evolution of "other consumer" lending relative to year-end 2019, averaged across banks. While Figure 2 shows aggregate figures, effectively weighting by bank size, here all banks' quarterly loan growth rates are weighted equally, so as to highlight any changes in bank behavior rather than aggregate changes in the availability of small dollar loans.
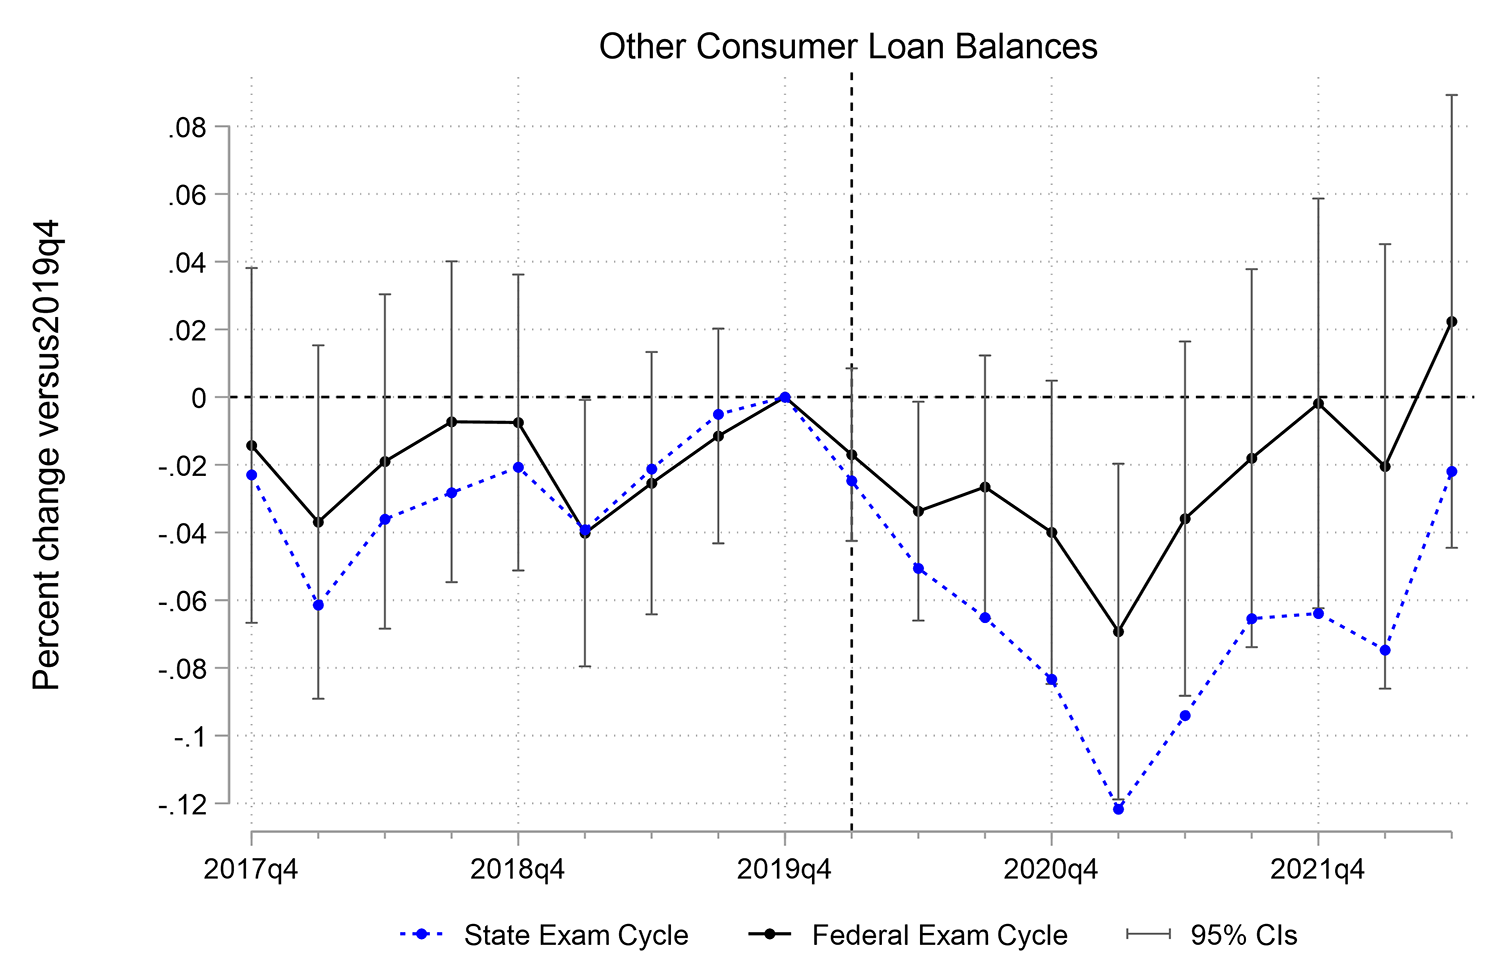
Note: Exam cycle refers to whether in March 2020 a bank had their next routine safety and soundness exam rotation with their federal (FDIC or Fed) or state examiners. Vertical dashed line marked at 2020Q1.
Source: Authors' calculations using Call Report and Safety and Soundness Examinations data.
Under the communications channel hypothesis, the "salience" of the SR/CA letters would be higher for banks who were in closer contact with the federal regulatory agencies when or shortly after those same agencies jointly issued the small dollar guidance. Such "salience" might stem from federal supervisors being more likely than state regulators to simply highlight the existence of the new guidance or to aide banks in better understanding the guidance.
Agarwal, Lucca, Seru, and Trebbi (2014) describe and exploit the alternate examination program (AEP) design, whereby statute, federal and state regulators alternate on-site exams to reduce compliance burdens, to study the toughness of federal relative to state supervisory oversight. Using the fact that a bank's examiner rotation is on a set cycle unrelated to a bank's financial condition allows them to show that federal regulators are systematically tougher. More recently, Beyhaghi and Gerlach (2021) use the AEP design to investigate the link between Fed supervisory ratings downgrades and discount window borrowing.
When the letter was issued at the end of March, the banks labelled "federal" had their current or next routine safety and soundness exam rotation with the FDIC or Fed.2 These will be the "treatment" banks to be compared to the "control" banks who were on their state examiner rotation. The sample is roughly evenly split between the groups. The plotted coefficients are the average change in balances relative to 2019q4, with all banks equally weighted.3 Prior to the letter issuance, denoted by the vertical line in 2020q1, balances should not be evolving differentially between these groups, and that is confirmed by the graph. Post letter issuance, balances in this lending category fall on average at all banks. The "Federal" exam rotation banks though show less reduction and by 2021q4 are higher than they were when the letter was issued. In contrast, the "State" exam rotation banks are well below that level. By year end 2021, the "Federal" bank lending in this category had shrunk by 6% less than at "State" banks. While the difference is only marginally statistically significant as seen from the 95% confidence interval bars, the economic magnitude of the difference is material. Interestingly, over the first half of 2022 there is some indication of catch-up from the "State" banks, who by then had gone through their next federal examiner rotation.
Because the guidance also touched on the favorability of responsible small-dollar lending for CRA assessments, contact with CRA examiners could also raise the salience of the letters for a bank. To investigate this angle, we compare banks who had a CRA exam anytime between when the first letter was issued on March 30 through the second quarter of 2020 to all other banks. The results are in Figure 4 where the difference in lending growth between the two groups is plotted. In this comparison "treated" firms comprise fewer than 6% of banks, rendering the series fairly noisy as evidenced by the large confidence intervals in Figure 4. That said, the evidence is also somewhat suggestive of a salience channel with CRA exam rotation firms increasing their other consumer lending relative to control firms by the end of 2020 and sitting nearly 8% above these control firms by the end of 2021.
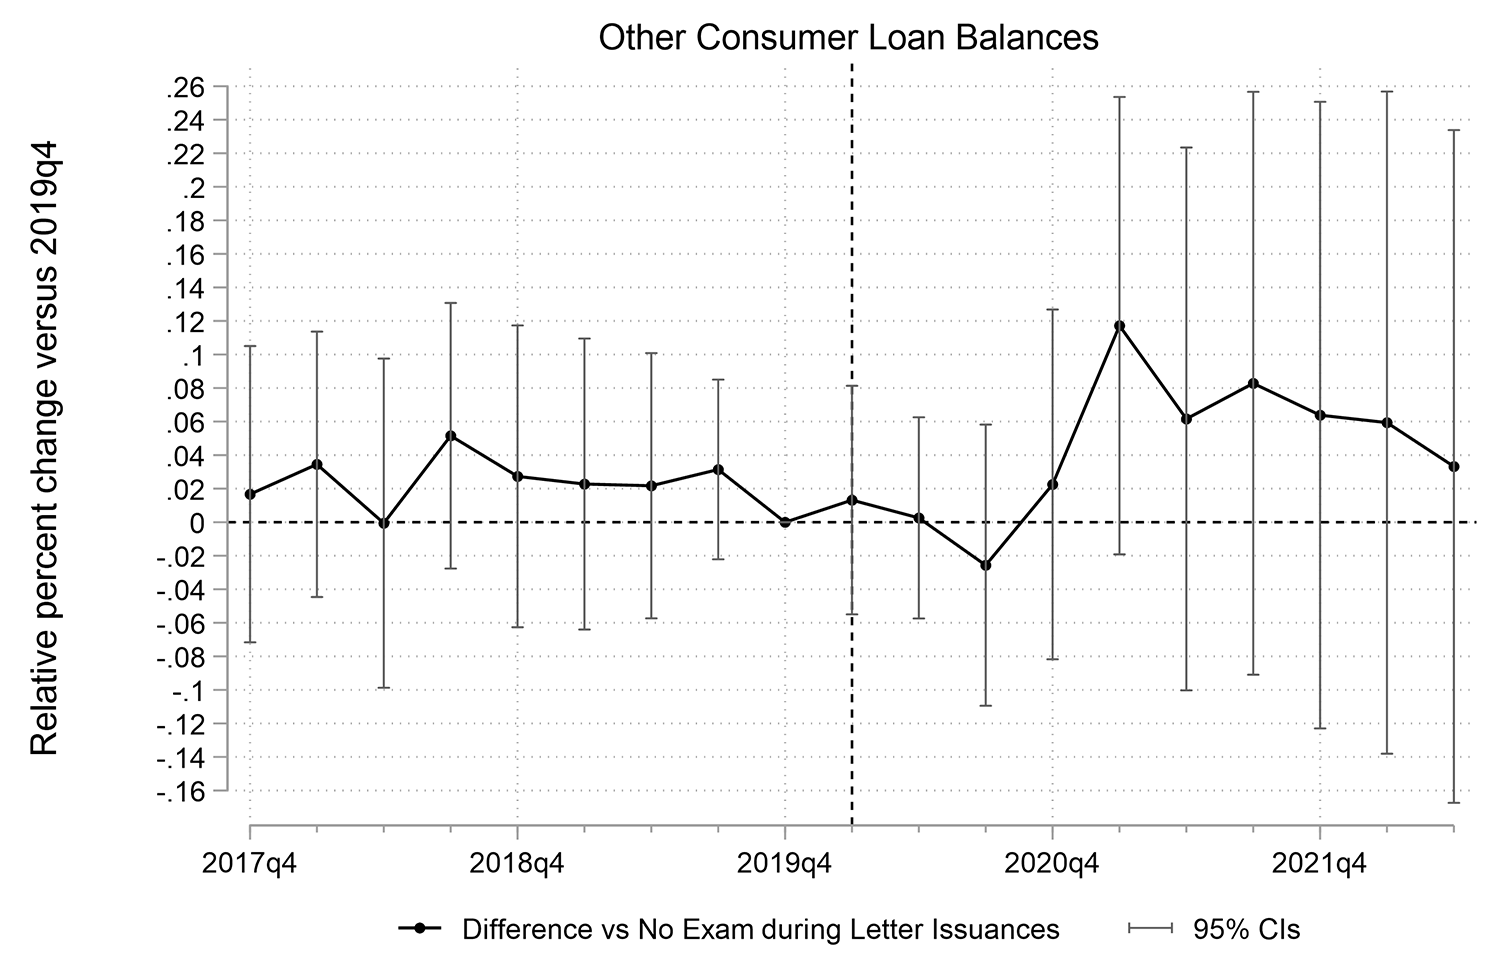
Note: Banks who underwent a CRA exam during the second quarter of 2020, the letter issuance period, are compared to all other banks. Vertical dashed line marked at 2020Q1.
Source: Authors' calculations using Call Report and Specialty Examinations data.
Incentives
As mentioned above, the SR/CA letters encouraged small-dollar lending in part by reaffirming their consideration for CRA assessments. Prior research by Agarwal, Benmelech, Bergman, and Seru (2012) find that banks increase CRA mortgage lending in the period surrounding CRA exams and that these loans are riskier. Mazur (2021) also finds that banks with upcoming CRA exams increase lending to borrowers in Low-to-moderate income (LMI) areas.
In this vein, we look at whether banks with impending CRA exams after letter issuance (in late 2020 or 2021) increase their lending in the other consumer space relative to banks who were examined in 2019 or early 2020, just prior to the letters. The banks with CRA exams during the letter issuance period analyzed in the Communications section above are dropped from the sample. Figure 5 plots the differential evolution of lending for these two groups which are roughly equivalent in size. There is no discernible difference in behavior due to the timing of these CRA exams.
Note: Banks with impending CRA exams after letter issuance (in late 2020 or 2021) are compared to those who were examined in 2019 or early 2020, just prior to the letter issuances. Banks with CRA exams during the letter issuance period, the second quarter of 2020, are dropped from the sample. Vertical dashed line marked at 2020Q1.
Source: Authors' calculations using Call Report and Specialty Examinations data.
One possible reason for the lack of a response along this dimension is that many banks are already largely compliant with their CRA obligations and so do not need to adjust their behavior. To test this, we separate banks based on their pre-pandemic CRA rating. The roughly 9% of banks with a lending rating of "Outstanding" are labelled "High" while those with a "Satisfactory", "Needs to Improve", or "Substantial Noncompliance" are labelled "Satisfactory or Low". Figure 6 plots other consumer lending growth for both groups separately as the absolute trends are also of interest. While all banks initially reduce lending in this area by about 5% with the onset of the pandemic, contrary to the hypothesis, lending by lower rated firms in this space stays depressed. Interestingly, lending by the highest rated firms rebounded to pre-pandemic levels by the end of 2020 and kept growing, running nearly 16% above lower-rated firms by mid-2022. This is an unusual group of banks who engage in significant whole community lending efforts to merit an "Outstanding" rating despite it conferring no regulatory benefit over the 90% of firms who receive a "Satisfactory" grade. While we cannot distinguish if this was a response to the guidance or instead reflected a general orientation of these banks towards meeting consumer needs in a stressful period, it does suggest this segment of banks will be more receptive to future encouraging guidance.
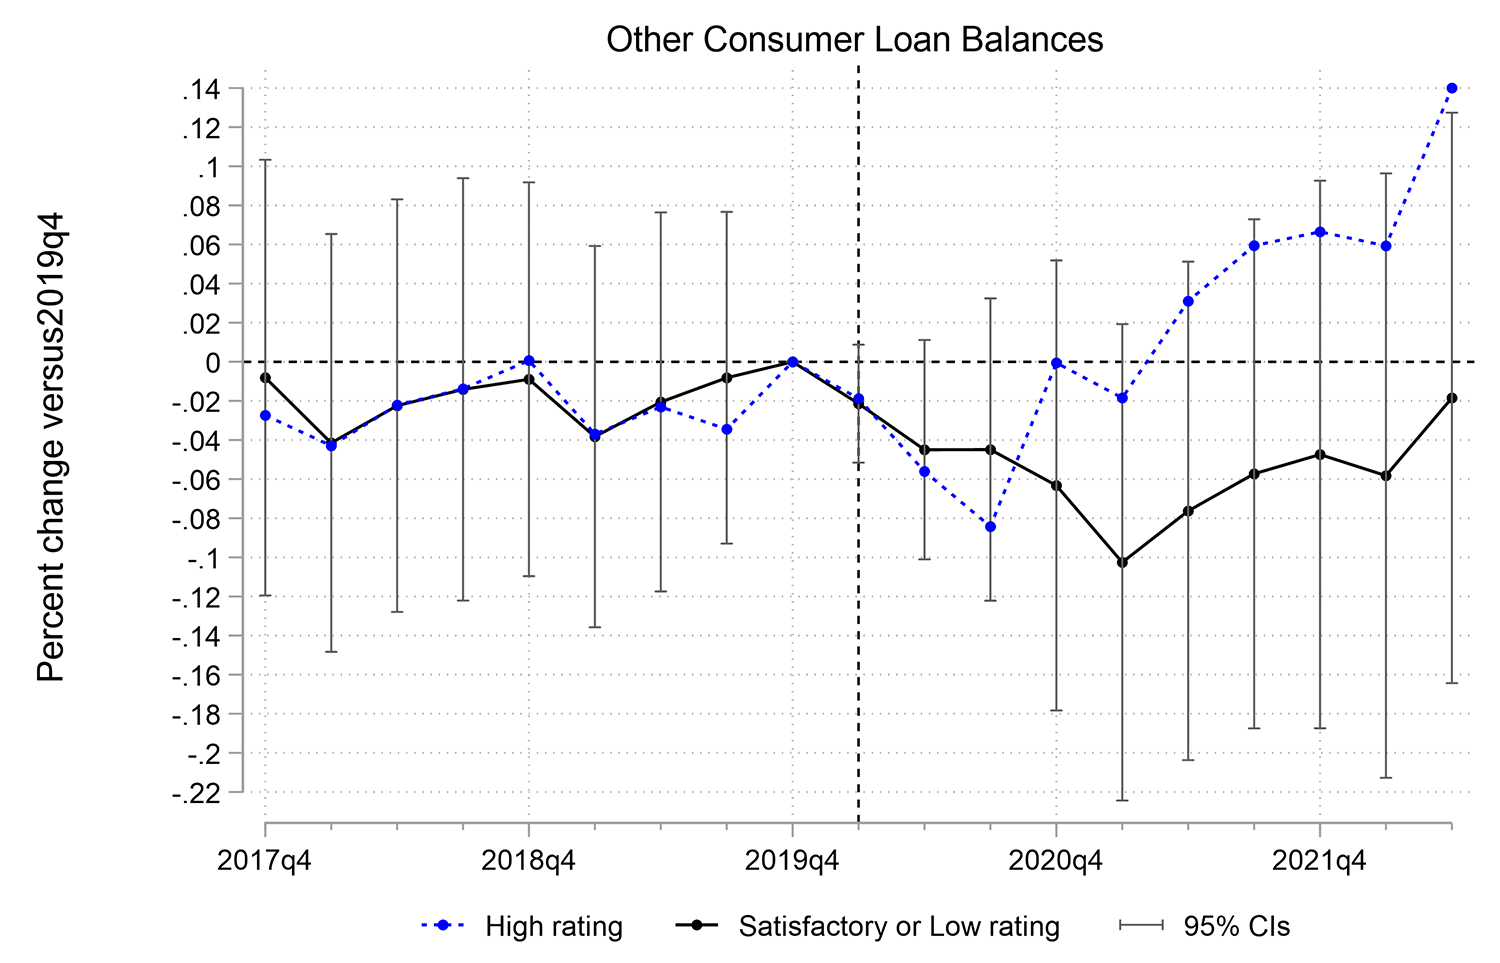
Note: "High" banks have a CRA lending rating of "Outstanding" while "Satisfactory or Low" banks have a rating of "Satisfactory", "Needs to Improve", or "Substantial Noncompliance". Vertical dashed line marked at 2020Q1.
Source: Authors' calculations using Call Report and Specialty Examinations data.
Risk
Presumably, a bank with a conservative business model would be less inclined to enter or expand lending in the higher risk small-dollar space, regardless of any supervisory green light. We use two measures to proxy for risk tolerance. One is RWA density, the ratio of risk-weighted assets to total assets, captures the extent to which a bank tends to lend in areas where default rates are higher and recovery rates lower. The other is the sizing of management buffers of capital above regulatory minimums.
Specifically, to proxy for conservativeness of business model, we split the sample in half by RWA density at year-end 2019, when the median density was about 72%. Figure 7 plots average other consumer loan growth at less conservative relative to more conservative banks. Conservative banks had no growth in other consumer lending through 2017 and 2018, whereas less conservative banks grew their balances by 6% on average. This pre-letter differential growth trend appears to be re-emerging in 2021 but this would suggest it is unrelated to the early 2020 guidance. This is consistent with more conservative lenders being uninterested in expanding in this space and so naturally capping the impact such guidance can have.
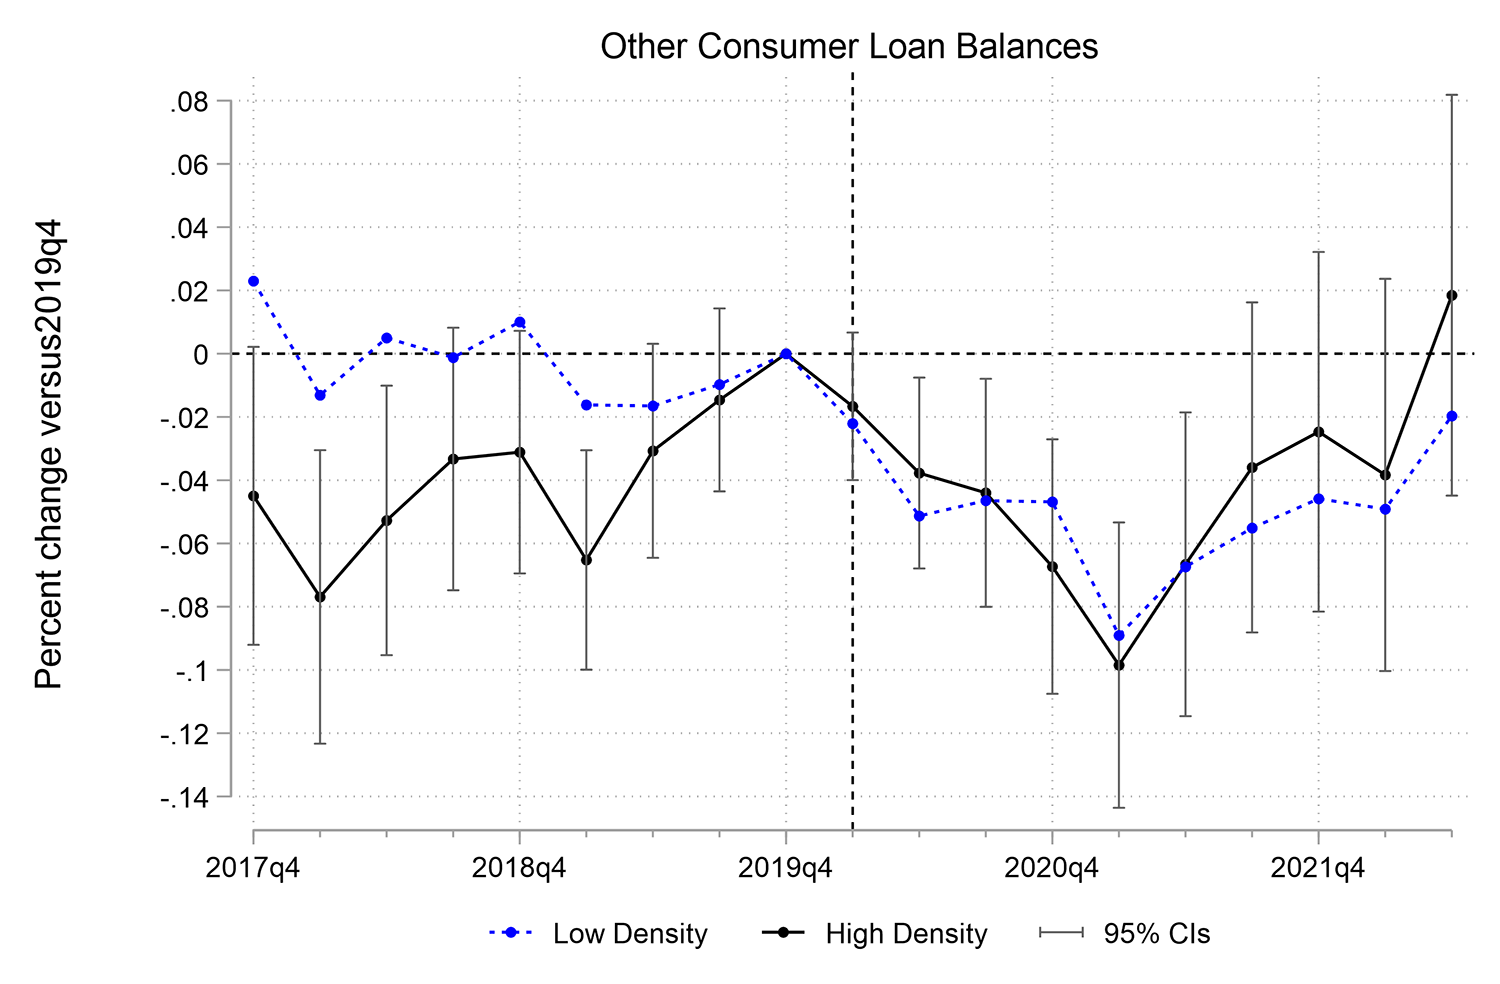
Note: RWA density is the ratio of risk-weighted assets to total assets. "High density" and "Low density" labels banks at year-end 2019 relative to the median RWA density of 72%. Vertical dashed line marked at 2020Q1.
Source: Authors' calculations using Call Report data.
Figure 8 tells a similar story. Here we proxy for conservativeness by segmenting banks based on capital above requirements relative to assets. We label as low buffer banks those in the lowest quartile by this measure, which corresponds to those with 2.5% of assets or less of an excess capital buffer at the end of 2019. Low buffer – ostensibly less conservative banks – were already growing their other consumer portfolios pre-letter, while high buffer banks showed no growth on average. Post-letter, low buffer banks first reduced other consumer portfolios less and by the end of 2021 had resumed lending growth in this area, while high buffer banks other loan portfolios remain below pre-pandemic levels. In summary, by either measure, the more "risk-tolerant" banks were already expanding lending in the other consumer space relative to more "conservative" banks in the years prior to the letter issuance, and this trend continues post-letter at a similar pace. This suggests that the early 2020 guidance did not alter "risk-tolerant" bank plans. It does though highlight that there is a ceiling on how much impact encouraging guidance can have given that a significant subset of banks choose not to engage in certain types of lending independently of supervisory go aheads.
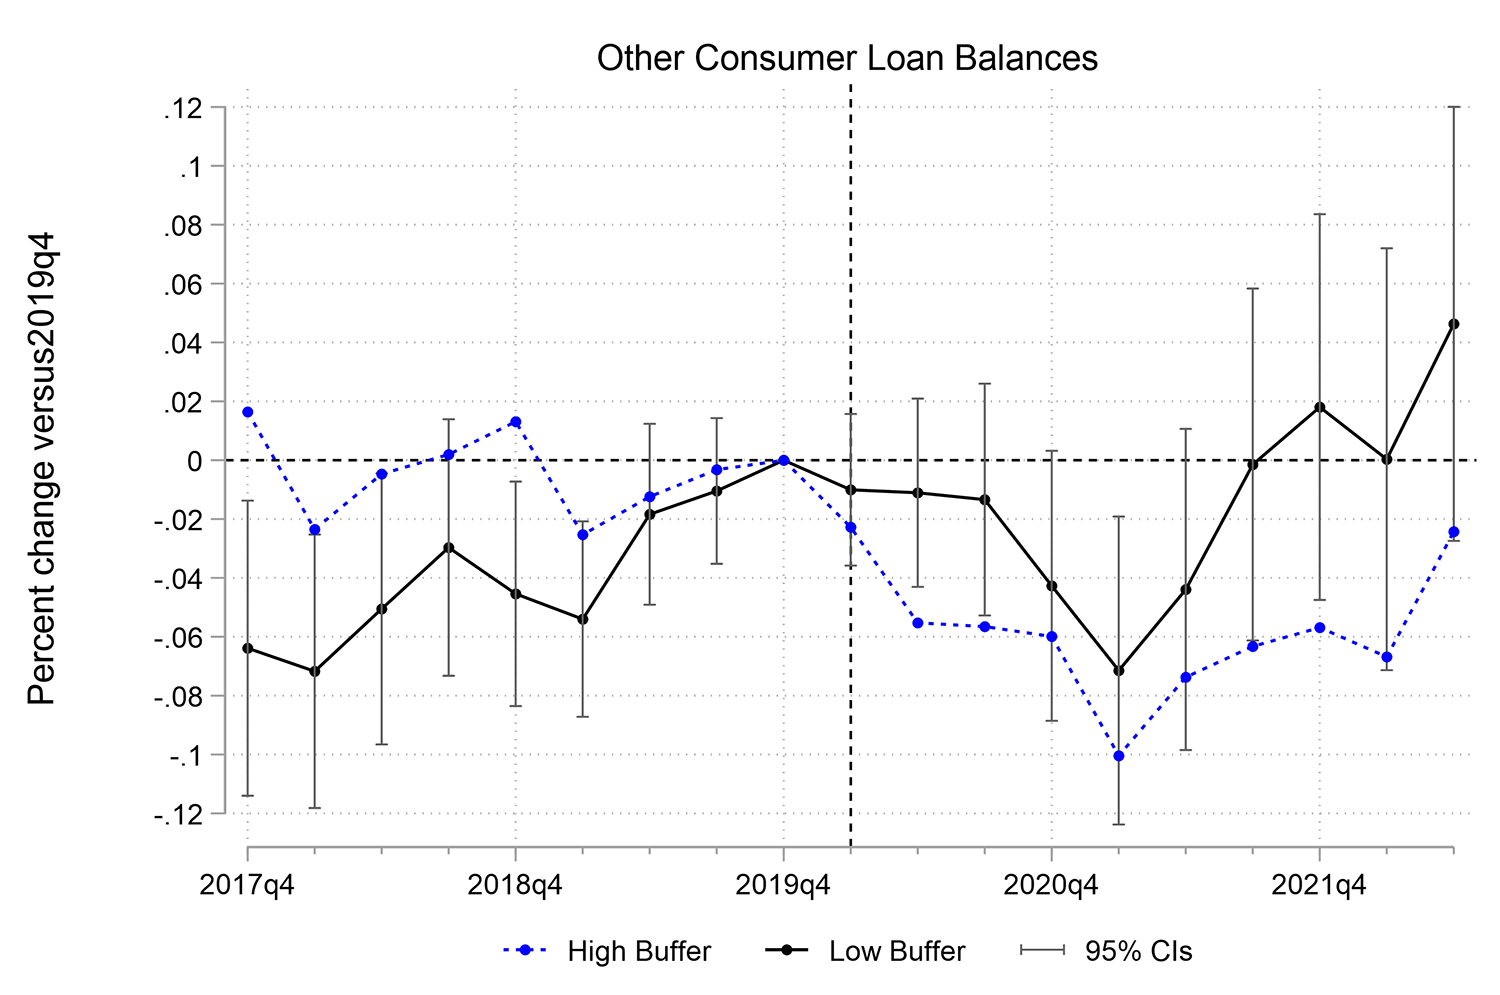
Note: "Capital Buffers" measures capital above the most binding requirement at a given bank relative to assets. "Low Buffer" banks are in the lowest quartile by this measure, which corresponds to those with 2.5% of assets or less of an excess capital buffer at the end of 2019. Vertical dashed line marked at 2020Q1.
Source: Authors' calculations using Call Report data.
Discussion
Unsurprisingly, encouraging activities is more challenging for regulators and supervisors than discouraging them. The lessons of the small-dollar guidance do suggest that SR/CA letters can be effective at the former, though expectations should be limited. This note presents three efforts to evaluate the effectiveness of the guidance in expanding small dollar credit while noting how difficult it would be to measure effects. Not included in these measurement efforts is tracking of public statements by market participants regarding credit expansion.
This tracking might seem suspect by relying on anecdotes, but it can provide more certainty about intentionality. In the 12 months after these two interagency statements, just one major bank entered this market which had consisted of only US Bank and its Simple Loan product which was launched in September 2018.4 That bank was Bank of America with its October 2020 announcement of Balance Assist, a new small-dollar liquidity product.5 Bank of America, however, had regulatory certainty at that time in the form of a "no action letter" from the CFPB.6 Huntington Bank introduced its Standby Cash product in June 2021. Three other large banks – Truist, Regions and Wells Fargo – announced small dollar products in 2022. As of March 2023, there are now six large banks with either a small-dollar installment loan or a line of credit aimed at more than just prime borrowers. The Pew Charitable Trusts notes that these six large banks combine to operate nearly 17,000 branches or 23 percent of all bank branches in the U.S. Following up on its extensive outreach to banks, Pew had this to say about the guidance:
The new loans were made possible in part by the regulatory certainty stemming from careful, forward-thinking joint guidance in May 2020 from the Office of the Comptroller of the Currency, FDIC, Federal Reserve Board of Governors, and National Credit Union Administration. The guidance welcomed automation and low-cost, flexible loan underwriting criteria while prioritizing affordability and consumer well-being. Now, the households that need the most help are starting to get it.7
Pew has also followed up with fintechs that assist community banks with small-dollar credit products and has identified several fintechs with bank and credit union partners. In the large scheme of things, lending from these new small-dollar loan programs is still very small.
Focusing on raising the salience of the letters, potentially in conjunction with other tools like Governor speeches, can amplify impact. Further work in the small dollar space should concentrate on identifying what types of consumers are benefitting from these products and following up with firms regarding the rate of "graduation" of customers into more mainstream loan products. Future guidance initiatives would benefit from pre-planned empirical follow-up, including metrics of success and tailored data collection.
Bank Small-Dollar products and announcement (and some launches) dates
- US Bank, Simple Loan,(https://www.usbank.com/about-us-bank/company-blog/article-library/us-bank-launches-simple-loan-to-meet-customers-short-term-cash-needs.html) announced - Sept. 7, 2018
- Bank of America, Balance Assist, (https://ibsintelligence.com/ibsi-news/bank-of-america-launches-balance-assist-a-new-short-term-low-cost-loan) announced Oct. 8, 2020 (launch in 2021)
- Huntington Bank, Standby Cash, (https://www.huntington.com/About-Us/Media-Center/huntington-in-news/2021-releases/2021-06-01) announced June 1, 2021
- Truist Bank, Cash Reserve, (https://ir.truist.com/2022-01-18-Truist-announces-purpose-driven-approach-to-checking-account-experience) announced Jan. 18, 2022 (launched in the Fall)
- Regions Bank, Cash Reserves LOC, (https://ir.regions.com/news-and-events/press-releases/2022/09-13-2022-140036100) announced Sept. 13, 2022
- Wells Fargo Bank, Flex Loan, (https://newsroom.wf.com/English/news-releases/news-release-details/2022/Wells-Fargo-Introduces-Flex-Loan-to-Give-Customers-More-Options/default.aspx) announced Nov. 16, 2022
References
Agarwal, Sumit, Efraim Benmelech, Nittai Bergman, and Amit Seru. 2012. "Did the Community Reinvestment Act (CRA) Lead to Risky Lending?" NBER Working Paper Series #18609. December 2012.
Agarwal, Sumit, David Lucca, Amit Seru, and Francesco Trebbi. 2014. "Inconsistent Regulators: Evidence from Banking." The Quarterly Journal of Economics. 889-938.
Bassett, William F. and W. Blake Marsh. 2017. "Assessing Targeted Macroprudential Financial Regulation: The Case of the 2006 Commercial Real Estate Guidance for Banks." Journal of Financial Stability, 30, 209-228.
Beyhaghi, Mehdi and Jeffrey R. Gerlach. 2021. Borrowing at the Discount Window: What Explains the Stigma Post-2003 Reforms?" Working Paper. November 15, 2021.
Calem, Paul, Ricardo Correa and Seung Jung Lee (2016). Prudential policies and their impact on credit in the United States. International Finance Discussion Papers 1186.
Greig, Fiona, Erica Deadman, and Tanya Sonthalia. 2021. "Household Finances Pulse: Cash Balances during COVID-19." JPMorgan Chase Institute. September 2021. (https://www.jpmorganchase.com/institute/research/household-income-spending/household-finances-pulse-cash-balances-during-COVID-19)
Mazur, Laurel. 2021. "Are the Voices of Customers Louder When They Are Seen? Evidence from CFPB complaints." Working paper. November 2021.
Phillips, T., 2022. In Support of Supervisory Guidance. Corp. & Bus. LJ, 3, p.344.
1. Examples include 2013 guidance regarding Deposit Advance Products (DAP), focused on consumer compliance (Fed) and safety and soundness concerns (OCC and FDIC). In 2020 and 2021, the Fed individually, or with banking regulators jointly, issued six SR (or joint SR/CA) letters regarding the transition away from LIBOR-referenced contracts, including variable-rate consumer loans. These statements identified the date after which regulators would consider LIBOR-referenced contracts to pose safety and soundness risk and the expectations of regulators as banks transitioned away from the use of LIBOR as a reference rate. In 2019, regulators issued the Interagency Statement on the Use of Alternative Data in Credit Underwriting (CA19-11). This statement noted – in a relatively neutral way – that the use of alternative data could improve the underwriting process while helping banks to safely extend credit to consumers who are underserved by the mainstream credit system. Return to text
2. The national banks regulated by the OCC do not have state examiner rotations and so are removed from the sample. Return to text
3. The coefficients come from a regression of the natural log of other consumer loan balances on a set of bank fixed effects, quarter fixed effects and an interaction between the quarter fixed effects and in indicator for a federal exam rotation following the March 30, 2020 letter issuance. The changes in log balances are nearly identical to percentage changes at these scales. Due to the use of repeat observations for each bank across the quarters and serial correlation in loan balances, standard errors are clustered by bank. Return to text
4. See https://www.usbank.com/about-us-bank/company-blog/article-library/us-bank-launches-simple-loan-to-meet-customers-short-term-cash-needs.html. Return to text
5. See https://promotions.bankofamerica.com/deposits/balance-assist. Return to text
6. A No Action letter generally grants a company special treatment where an agency agrees to not take action for unintentional violations of law. With this November 2020 letter, the CFPB agreed to not bring a supervisory or enforcement action against Bank of America under its authority to prevent unfair, deceptive, or abusive acts or practices. See link (PDF). Return to text
7. See Alex Horowitz and Gabriel Kravitz, Pew Charitable Trusts, Six of the Eight Largest Banks Now Offer Affordable Small Loans, January 24, 2023 (link). Return to text
Gorin, Daniel, Sarah Gosky, and Michael Suher (2023). "Empirical assessment of SR/CA small-dollar lending letter impact," FEDS Notes. Washington: Board of Governors of the Federal Reserve System, July 28, 2023, https://doi.org/10.17016/2380-7172.3329.
Disclaimer: FEDS Notes are articles in which Board staff offer their own views and present analysis on a range of topics in economics and finance. These articles are shorter and less technically oriented than FEDS Working Papers and IFDP papers.