FEDS Notes
March 24, 2023
From-Whom-to-Whom Relationships in the Financial Accounts of the United States: A New Methodology and Some Early Results
Michael Batty, Elizabeth Holmquist, Robert Kurtzman
The Financial Accounts of the United States (the Accounts or FAUS) provide data on the financial assets and liabilities of major sectors of the United States economy, disaggregated by financial instrument. The Accounts can thus serve many purposes, such as sizing sectors and instruments, analyzing changes in credit flows, and assessing the net worth of households.1 However, they are not designed to reveal and analyze the detailed linkages between sectors that provide and utilize funding, which we call "From-Whom-to-Whom" (FWTW) relationships, such as the value of U.S. corporate bonds held by U.S. mutual funds. Identifying FWTW relationships can be useful for studying, for example, how financial shocks could propagate throughout the economy or assessing cross-sector exposures via a given financial instrument. This note introduces a new project that estimates these relationships.
Our method utilizes available detail on FWTW relationships within the Accounts and estimates the remaining relationships where the relevant data are not yet available. As with the Accounts more generally, improving our FWTW estimates will be a perpetual work-in-progress, as the economy continues to innovate new financial instruments and organizational structures evolve, and as we continue to incorporate additional data sources and improved methods. We introduce this project now to provide the valuable information about linkages between sectors of the economy available in these current FWTW estimates, as well as to solicit feedback for how our methods and source data can be improved.
In the first section of the note, we describe how we construct comprehensive FWTW data that are consistent with sector totals in the Accounts. In brief, we supplement known FWTW relationships implied by underlying detail of the Accounts and outside knowledge of market structure with the broad assumption that all remaining holders of an instrument lend in proportion to the remaining outstanding issuance of that instrument.2 Of course, these assumptions can be improved upon with evidence and should play a smaller role in the future as we obtain more detailed data and improve our institutional knowledge.3 We document the current known relationships for each financial instrument in template files that can be downloaded along with this note. Appendix A walks through the algorithm that translates an example template into FWTW data.
In the second section of the note, we highlight two ways in which FWTW data can answer questions of interest to the public. First, we show how FWTW data are used to construct an estimate of U.S. corporate bonds held by U.S. mutual funds. Second, we discuss the role of nonbank financial intermediaries (shadow banks) in driving household credit growth before, during, and after the Global Financial Crisis (GFC) of 2007‒09. These are two early uses of these data, but we envision many other potential applications, particularly as the coverage of known relationships grows.
Section 1: Methodology and Assumptions
Before discussing the FWTW data, it is useful to provide a brief overview of the Accounts. The Accounts break the economy into institutional sectors, which hold and issue financial instruments.4 The sectors include households and nonprofit organizations, different types of governments, nonfinancial businesses, various financial firms such as banks and insurance providers, and the rest of the world. The instruments include a variety of debt and equity securities, as well as other types of assets or liabilities. For each sector, the Accounts' publication tables show total holdings and total issuance of each financial instrument but generally do not reveal which sectors issue the instruments held by that sector. For example, the Accounts currently show the mutual fund sector's total holdings of corporate and foreign bonds, but not which sectors issue those bonds. The FWTW data, however, provide those direct relationships between sectors for each financial instrument.
Table 1 provides an abstract representation of an instrument table in the Accounts. The rows are the holders of the instrument (sectors A, B, and C), while the columns are the issuers of the instrument (sectors D, E, and F). The bottom row and rightmost column contain the sector totals that would be shown on the Accounts' publication tables. Generating FWTW data for a given financial instrument amounts to populating the center of the table such that the rows and columns sum to the Accounts' totals.
Table 1: Table Exemplifying What is and What is not in the Accounts (FAUS)
| Issuing Sectors | FAUS Assets | ||||
|---|---|---|---|---|---|
| D | E | F | |||
| Holding Sectors | A | 100 | |||
| B | 400 | ||||
| C | 200 | ||||
| FAUS Liabilities/Equity | 50 | 300 | 350 | 700 | |
To fill in these cells, we begin with Accounts data (including available detail underlying the published series) for which both the holder and issuer are identified ("known relationships"). Additionally, we set cells to zero where a particular holder and issuer for that instrument do not directly interact. An example of such an "exclusion restriction" is that the rest of the world (ROW) does not lend to itself, as these transactions would fall outside the scope of the Accounts.5 Next, we subtract the amounts derived from the "known relationships" from the issuing sectors' liabilities or equity and the holding sectors' assets and assign the remaining holdings proportionally. That is, we assume that all remaining holders lend to the remaining borrowers in proportion to the remaining overall issuance outstanding for that instrument.6 The FWTW data are then obtained by adding the amounts determined through known relationships to the amounts assigned based upon proportionality assumptions and exclusion restrictions. Appendix A shows an example of these calculations in practice.
The structure of the FWTW data is consistent with the Accounts. Financial instruments and sectors are defined identically and are fully covered in the FWTW data, except for the corporate equities instrument, which is currently excluded from the FWTW due to data limitations in the Accounts.7 Summing the FWTW data across instruments, holders, and issuers reproduces the relevant published totals from the Accounts.
In the Accounts, total holdings of an instrument do not always sum to total issuance of that instrument because of discrepancies. Discrepancies occur because of differences in valuation bases (that is, market value for assets versus book value for liabilities) or differences in source data, methodology, or timing. To make the FWTW sector totals consistent with the Accounts, the FWTW data include a "discrepancy" sector, which accounts for the discrepancies present the Accounts.8
Our dependence on proportionality assumptions to derive FWTW data varies a lot between financial instruments. In certain cases, the known relationships from the Accounts fully specify FWTW data. For example, there is only one issuer of Treasury securities (the Federal Government), so Accounts data are FWTW data. For many other instruments, known relationships provide only partial information. For example, underlying detail in the Accounts specify foreign versus domestic bonds for certain holders of corporate bonds, but not others. However, even when proportionality assumptions are used, there are cases when an instrument is dominated by a single holding or issuing sector, so there is little margin to skew the distribution of sectors to which the large sector lends or from which it borrows. The results for the remaining sectors may be inaccurate, but their smaller size limits the significance of potential errors. In other cases, when few relationships are known and there is no dominant sector, the results depend more heavily on proportionality assumptions and might thus be skewed if such assumptions do not hold.
Table 2 summarizes the FWTW data's current reliance upon proportionality assumptions for each financial instrument. The top part of the table shows the instruments for which known relationships and exclusion restrictions fully specify FWTW data. The bottom part of the table shows all the other instruments, classified based on how many relationships are known rather than estimated and on whether there is a dominant sector. Eighteen of the 30 instruments, accounting for around two-thirds of assets, are fully specified, while under one-fourth of the remaining assets rely entirely upon assumptions that could substantially alter the results.9
Table 2: Grouping Financial Instruments by Degree of Proportionality Assumptions
| Known relationships and exclusion restrictions fully specify FWTW data ($171.6 trillion as of 2022:Q4): | ||
|---|---|---|
|
||
| At least one of FAUS assets or FAUS liabilities/equity is dominated by a single sector: | Both FAUS assets and FAUS liabilities/equity are relatively balanced across more than one sector: | |
| The FWTW data are constructed from a mixture of known relationships, exclusion restrictions, and proportionality assumptions: |
($19.4 trillion as of 2022:Q4)
|
($33 trillion as of 2022:Q4)
|
| The FWTW data are constructed entirely from proportionality assumptions: |
($15.3 trillion as of 2022:Q4)
|
($19.4 trillion as of 2022:Q4)
|
Note: Corporate Equities are not yet included in the FWTW data because of limitations in the Accounts' breakdown of total issuance outstanding by sector. All other financial instruments from the Accounts are included.
Corporate equities are an important source of financing for different sectors of the economy, totaling $64.5 trillion in 2022:Q4, or about 25 percent of the approximately $258.6 trillion in assets across the 30 instruments currently included in the FWTW project. Excluding this instrument is a substantial gap in our work and a priority area for future development.
While there is clearly room for improvement, a key advantage of our approach is that we can incorporate known relationships and exclusion restrictions on a piecemeal basis as we process new data for individual sectors and instruments. Thus, we can make use of the substantial amount of information that is available now, even when a complete accounting of FWTW relationships is not feasible.
Section 2: Example FWTW Use Cases
The FWTW data provide an array of information about how different sectors are linked and allow easy aggregation of instruments and sectors. For example, with the FWTW data, one sees that about 35 percent of household sector home mortgages and consumer credit is held by private depository institutions as of 2022:Q4 and about 48 percent by government-sponsored enterprises (GSE) and agency- and GSE- backed mortgage pools. Such exercises can also provide useful insights into how shocks to one sector could affect other sectors. In this section, we describe one way in which the FWTW data are currently being used in Board publications.10 We also provide an example of how these data could be used to monitor and analyze counterparty trends in borrowing by households.
Section 2.1 Mutual Fund Holdings of Corporate Bonds in the Financial Stability Report
Understanding how much of a sector's financing comes from another sector provides valuable insight into potential sources of financial stability risk. For example, certain mutual funds hold large amounts of relatively illiquid corporate bonds but provide their investors the option to redeem shares on a daily basis. This liquidity mismatch makes these funds more vulnerable to runs, which could force the rapid liquidation of bonds at firesale prices and potentially disrupt the functioning of corporate bond markets. To monitor this risk, we use the FWTW data to estimate the amount of U.S. corporate bonds held by mutual funds, which is included as figure 4.5 in the November 2022 Financial Stability Report.11 According to our estimates, U.S. mutual funds' holdings of corporate bonds grew rapidly in recent years before falling in the latest quarters on a mark-to-market basis, and stood at about $1.2 trillion (nominal U.S. dollars) in 2022:Q4, which is about 11 percent of total U.S. corporate bonds issued.
Section 2.2 Example: Sources of Household Borrowing
Before the GFC of 2007‒09, a substantial amount of household debt growth occurred outside of the traditional banking sector, where entities tended to be less regulated, more susceptible to runs, and were lending on riskier terms. Figure 1 shows household and nonprofit organization sector borrowing by lending sector since 1995 (through 2022:Q4), with many financial institutions outside the traditional banking sector grouped into a "shadow banks" sector.12 This presentation reveals not only the rapid rise and subsequent fall in household debt, but also that much of it can be attributed to nonbank sources, such as shadow banks. In the most recent years, household borrowing from GSEs and the federal government has increased, with the two sectors holding a combined total of 51 percent in 2022:Q4. This latest year saw the largest share of household borrowing from sectors with explicit or implicit government support since the FWTW data began in 1951:Q4.
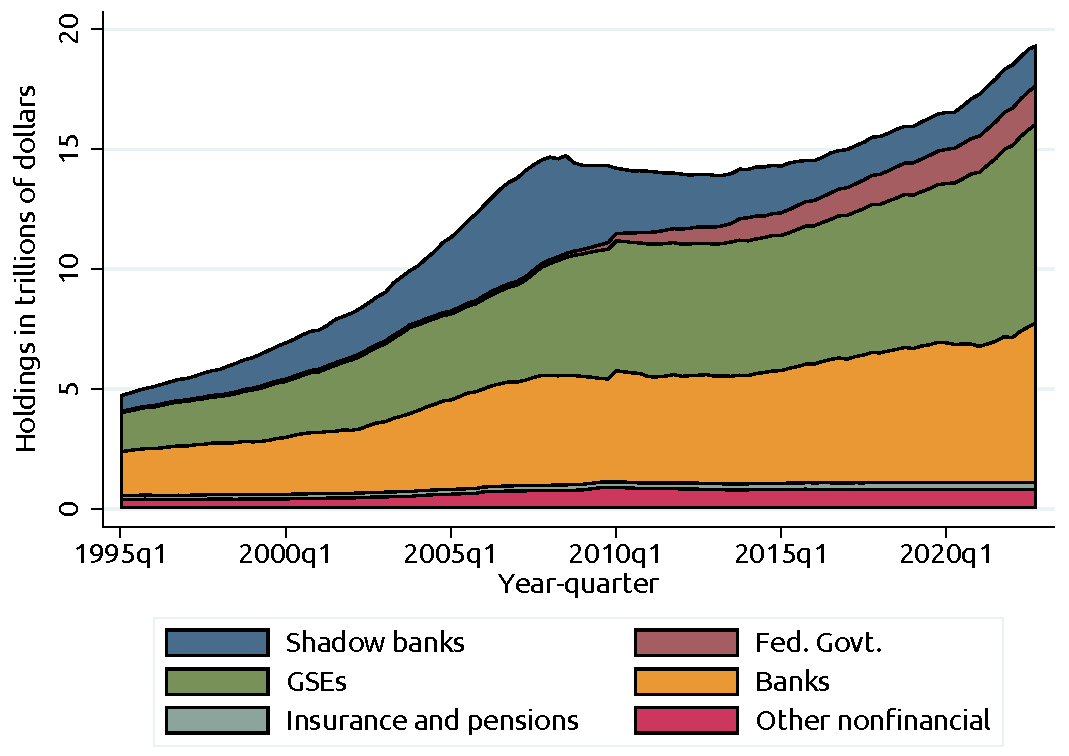
Notes: Legend identifies area segments from left to right for each period. The figure is a stacked area plot with holdings (in trillions of dollars) of household and nonprofit organization liabilities by sector categorization. The data are calculated as described in Section 1. Instruments include all instruments (as listed in Table 2) except corporate equities. Issuers are households and nonprofit organizations. Holders include the following sectors of the Accounts, aggregated as follows: the "Shadow Banks" sector is defined following footnote 11; "Banks" include holding companies and all private depository institutions, which is composed of U.S.-chartered depository institutions, foreign banking offices in the United States, banks in U.S.-affiliated areas, and credit unions; "Fed. Govt." is the federal government sector; "GSEs" include government-sponsored enterprises and agency- and GSE- backed mortgage pools; "Insurance and pensions" are property-casualty insurance companies, life insurance companies (which includes their general and separate accounts), and private and public pension funds (which includes the defined benefit and defined contribution plans for private funds, federal government employee retirement funds, and state and local government employee retirement funds); "Other nonfinancial" includes households and nonprofit organizations, state and local governments, and corporate and noncorporate businesses. We exclude the "Monetary Authority" sector and the "Rest of the World" sectors from the figure, though they have nonzero (albeit small) holdings, as their holdings were not visible on the chart. We also exclude the discrepancy sector from these calculations.
Source: Authors' calculations using the FWTW data set derived from the Financial Accounts of the United States, March 9, 2023.
Conclusion:
This note describes the new beta release of an Enhanced Financial Accounts project that provides estimates of sectors' holdings of financial instruments by counterparty sector, which we call "From-Whom-to-Whom" data. In the note, we demonstrate a few of the use cases for the data.
These data and the template files used to create the data will be produced quarterly as an Enhanced Financial Accounts project.13 In providing the data and methods for constructing the data to the public, we hope to receive feedback on ways to improve the data.
References:
Mian, Atif, Ludwig Straub, and Amir Sufi (2020). "The Saving Glut of the Rich," NBER Working Paper Series 26941. Cambridge, Mass.: National Bureau of Economic Research, April (revised February 2021), https://www.nber.org/papers/w26941.
Appendix A: Stylized Example of FWTW Calculations and Other Data Creation Details
In this appendix, we present a stylized example of how we perform the FWTW calculations.
Stylized Example of FWTW Calculations
In principle, our approach to generating FWTW data is straightforward: aside from all the information we know about the relationships between issuers and holders for a given financial instrument, we assume the assets for each holder are divided across issuers in proportion to the distribution of FAUS liabilities/equity. In practice, the requirement that FWTW data sum to Financial Accounts of the United States (FAUS) totals, combined with the nature of "exclusion restrictions" that certain sectors do not interact for the instrument in question, requires us to construct FWTW data through an iterative procedure. This appendix provides a stylized example of that procedure.
Suppose for a particular instrument in the FAUS there are three holders and three issuers. The FAUS levels for a given period are shown in the bottom row and rightmost column. Issuing sectors are the columns and holding sectors are the rows.
Appendix Table 1
| Issuing Sectors | FAUS Assets | ||||
|---|---|---|---|---|---|
| D | E | F | |||
| Holding Sectors | A | 100 | |||
| B | 400 | ||||
| C | 200 | ||||
| FAUS Liabilities/Equity | 50 | 300 | 350 | 700 | |
Creating FWTW data for this instrument and period amounts to populating the cells in the center of the table with values that sum across rows and columns to the FAUS totals. In most cases, we have information from existing FAUS data or outside knowledge of the structure of the market to partially populate these cells. In the example below, we have FAUS data that show sector A lends at least 15 (and possibly more) to sector D, that 20 is the exact amount sector A lends to sector E, and that sector C does not fund sector F at all (an x signifies that no relationship exists beyond any known relationship specified in that cell) in this period.
Appendix Table 2
| Issuing Sectors | FAUS Assets | ||||
|---|---|---|---|---|---|
| D | E | F | |||
| Holding Sectors | A | 15 | 20 x | 100 | |
| B | 400 | ||||
| C | x | 200 | |||
| FAUS Liabilities/Equity | 50 | 300 | 350 | 700 | |
1) We begin by setting aside the "known relationships" from the FAUS totals, reducing the FAUS assets of sector A and FAUS liabilities/equity of sector E to be distributed through the remainder of the algorithm.
Appendix Table 3
| Issuing Sectors | FAUS Assets | ||||
|---|---|---|---|---|---|
| D | E | F | |||
| Holding Sectors | A | x | 100-15-20=65 | ||
| B | 400 | ||||
| C | x | 200 | |||
| FAUS Liabilities/Equity | 50-15=35 | 280 | 350 | 665 | |
2) Next, we assume the FAUS assets in each row are split across columns in proportion to FAUS liabilities/equity. This initial distribution places weight on the two cells that we previously specified should be zero, and thus their values need to be redistributed.
Appendix Table 4
| Issuing Sectors | FAUS Assets | ||||
|---|---|---|---|---|---|
| D | E | F | |||
| Holding Sectors | A | 65*35/665=3.4 | 27.4 | 34.2 | 65 |
| B | 21.1 | 168.4 | 210.5 | 400 | |
| C | 10.5 | 84.2 | 105.3 | 200 | |
| FAUS Liabilities/Equity | 35 | 280 | 350 | 665 | |
3) As noted in (2), we now have nonzero amounts in two cells with exclusion restrictions. We spread these offending amounts across the other two cells in each row in proportion to FAUS liabilities/equity. The redistribution based upon exclusion restrictions results in mismatches between FWTW liabilities/equity and FAUS liabilities/equity (Excess FWTW row).
Appendix Table 5
| Issuing Sectors | FAUS Assets | Excess FWTW | ||||
|---|---|---|---|---|---|---|
| D | E | F | ||||
| Holding Sectors | A | 3.4+27.4*35/(35+350)=5.9 | 0 | 34.2+27.4*350/(35+350)=59.1 | 65 | 0 |
| B | 21.1 | 168.4 | 210.5 | 400 | 0 | |
| C | 10.5+105.3*35/(35+280)=22.2 | 84.2+105.3*280/(35+280)=177.8 | 0 | 200 | 0 | |
| FAUS Liabilities/Equity | 35 | 280 | 350 | 665 | ||
| Excess FWTW | 5.9+21.1+22.2-35=14.2 | 66.2 | -80.4 | |||
4) To remove the mismatch between FWTW liabilities/equity and FAUS liabilities/equity generated in step (3), we subtract the excess FWTW liabilities/equity in each column and spread it across rows in that column in proportion to FAUS assets while also respecting the exclusion restrictions.
Appendix Table 6
| Issuing Sectors | FAUS Assets | Excess FWTW | ||||
|---|---|---|---|---|---|---|
| D | E | F | ||||
| Holding Sectors | A | 5.9-14.2*65/665=4.5 | 0 | 59.1-80.4*65/(65+400)=70.3 | 65 | 4.5+70.3-65=9.8 |
| B | 21.1-14.2*400/665=12.6 | 168.4-66.2*400/(400+200)=124.3 | 210.5-80.4*400/(65+400)=279.7 | 400 | 12.6+124.3+279.7-400=16.6 | |
| C | 22.2-14.2*200/665=17.9 | 177.8-66.2*200/(400+200)=155.7 | 0 | 200 | 17.9+155.7-200=-26.4 | |
| FAUS Liabilities/Equity | 35 | 280 | 350 | 665 | ||
| Excess FWTW | 0 | 0 | 0 | |||
5) This resolves the liability/equity mismatches but creates differences between FWTW and FAUS assets. In a manner analogous to what is done in step (4), we subtract the asset mismatches from each row and spread them across column in proportion to FAUS liabilities/equity, again respecting the exclusion restrictions.
6) Step (5) resolves the holdings mismatches but reintroduces smaller liability/equity mismatches. We repeat steps (4) and (5) iteratively until the differences between FWTW and FAUS totals converge to zero (within a small tolerance).
Appendix Table 7
| Issuing Sectors | FAUS Assets | Excess FWTW | ||||
|---|---|---|---|---|---|---|
| D | E | F | ||||
| Holding Sectors | A | 3.2 | - | 61.8 | 65 | - |
| B | 10.6 | 101.4 | 288 | 400 | - | |
| C | 21.2 | 178.8 | - | 200 | - | |
| FAUS Liabilities/Equity | 35 | 280 | 350 | 665 | ||
| Excess FWTW | 0 | 0.2 | (0.2) | |||
7) After converging, we add back in the known relationships set aside in step (1) to produce the FWTW data for this instrument and time period.
Appendix Table 8
| Issuing Sectors | FAUS Assets | Excess FWTW | ||||
|---|---|---|---|---|---|---|
| D | E | F | ||||
| Holding Sectors | A | 18.2 | 20 | 61.8 | 100 | - |
| B | 10.6 | 101.4 | 288 | 400 | - | |
| C | 21.2 | 178.8 | - | 200 | - | |
| FAUS Liabilities/Equity | 50 | 300 | 350 | 665 | ||
| Excess FWTW | 0 | 0.2 | (0.2) | |||
1. Complete balance sheets, including nonfinancial assets, are available for nonfinancial business sectors and the household and nonprofit organizations sector in the Accounts. Return to text
2. "Known" relationships are taken as described or understood from the Accounts. However, the Accounts are themselves subject to errors and omissions. Return to text
3. As known relationships account for a greater proportion of total holdings and issuance in a given instrument, the remaining amount that must be proportionally assigned to other sectors will shrink, reducing the role of assumptions in our methodology. Return to text
4. For a complete description of the sectors and instruments included in the Accounts, see the "Financial Accounts Guide," webpage, https://www.federalreserve.gov/apps/fof/Default.aspx?ck=d. Table 2 includes the entire list of instruments in the Accounts, except for corporate equities. Return to text
5. The presence of exclusion restrictions often require these calculations to step through an iterative procedure, which is explained in Appendix A. Return to text
6. The proportionality assumption is similar in spirit to the assumption made in the exercise of Mian, Straub, and Sufi (2021). The authors "unveil" the financial sector and demonstrate what claims which households have on household and government debt. Our algorithm includes more detail on what is known regarding the relationship between given sectors for a given instrument. Furthermore, our approach constructs the entire FWTW data set for nearly all financial instruments. That said, we do not speak to distributional questions or perform an unveiling exercise as they do. Return to text
7. The Accounts displays data for some subsectors that are not currently shown separately in the FWTW data. For example, the Accounts tables 111 through 114 show the four subsectors that constitute the FAUS banking industry (Private Depository Institutions, table 110). The FWTW data contain Private Depository Institutions among the holding and issuing sectors but do not currently break out the four subsectors. Return to text
8. See the Financial Accounts of the United States Guide (see note 4) for details about how these instruments and sectors are defined. Return to text
9. Note that some sectors that are "fully specified" would currently rely on some proportionality assumptions when the private depository institutions sector is not aggregated (see note 7 for details on private depository institutions sector aggregation). Return to text
10. The FWTW data are also used in some of the Board's data submissions to international organizations. The Board regularly submits data to the International Monetary Fund, the Bank for International Settlements, and the Organisation for Economic Co-operation and Development as part of the Financial Accounts of the United States International Submissions. These data sets are meant to provide relevant, internationally comparable data that support the monitoring and analysis of different aspects of the economy. Since the GFC of 2007‒09, the international statistical community has placed greater emphasis on the development and collection of more granular data on financial markets and sectors, including FWTW data particularly for securities. These submissions are available here: https://www.federalreserve.gov/apps/fof/InternationalData.aspx. Return to text
11. See Board of Governors of the Federal Reserve System (2022), Financial Stability Report (Washington: Board of Governors, November), p. 47, https://www.federalreserve.gov/publications/files/financial-stability-report-20221104.pdf. Note that the data is inflation-adjusted in the figure. Return to text
12. The shadow banking sector is an aggregation of the following: money market funds, mutual funds, closed-end funds, exchange-traded funds, issuers of asset-backed securities, equity real estate investment trusts, mortgage real estate investment trusts, finance companies, security brokers and dealers, and other financial business. Return to text
13. See Board of Governors of the Federal Reserve System (2023), "Enhanced Financial Accounts," webpage, https://www.federalreserve.gov/releases/efa/enhanced-financial-accounts.htm. Return to text
Michael M. Batty, Elizabeth Holmquist, Robert J. Kurtzman (2023). "From-Whom-to-Whom Relationships in the Financial Accounts of the United States: A New Methodology and Some Early Results," FEDS Notes. Washington: Board of Governors of the Federal Reserve System, March, 24, 2023, https://doi.org/10.17016/2380-7172.3273.
Disclaimer: FEDS Notes are articles in which Board staff offer their own views and present analysis on a range of topics in economics and finance. These articles are shorter and less technically oriented than FEDS Working Papers and IFDP papers.