FEDS Notes
October 18, 2023
Greater Wealth, Greater Uncertainty: Changes in Racial Inequality in the Survey of Consumer Finances
Aditya Aladangady, Andrew C. Chang, and Jacob Krimmel with assistance from Eva Ma1
We document racial disparities in financial well-being in the 2022 Survey of Consumer Finances. The typical White family had about six times as much wealth as the typical Black family, and five times as much as the typical Hispanic family. These wealth ratios narrowed since 2019, as non-White home, stock, and business ownership all increased relatively more than for White families. However, differences in incomes widened slightly, as Black and Hispanic families' real wages stagnated. While we find most families of all races and ethnicities had sufficient income to cover their required payments, non-White families in particular have become more uncertain and pessimistic about their financial futures.
Wealth by Race in 2022
This note explores patterns in families' wealth, income, and financial well-being across race and ethnicity using new data from the 2022 Survey of Consumer Finances (SCF).2 We first document continued large and persistent differences in wealth across race and ethnicity, with particular attention to how such differences changed between the 2019 and 2022 surveys. We then turn to analyzing other metrics of financial well-being, including income, ability to meet payments on recurring monthly expenses, and families' expectations and attitudes about their financial situations.
Figure 1 shows large disparities in real wealth—the difference between assets and liabilities—across families of different races in 2022.3,4 Median wealth (the amount held by a typical family, shown in the top panel) among White families was $285,000 in 2022. By comparison, the typical Asian family—who we can split out for the first time in 2022 because of an oversample of certain non-White groups—held $536,000, nearly twice that of the typical White family.5 Meanwhile, the wealth of the typical Black family ($44,900) was only about 15 percent of the typical White family. The typical Hispanic family similarly held only about 20 percent of the wealth of the typical White family (about $61,600). The remaining families—a diverse group that includes those identifying as American Indian, Alaska Native, Native Hawaiian, Pacific Islander, other race, and all respondents reporting more than one racial identification—had median wealth similar to the typical Black or Hispanic family, rather than the typical White or Asian family. Notably, mean wealth (the average within each group, shown in the bottom panel; note the different vertical axis scale) was much higher than medians, particularly for White and Asian families. This reflects the fact that mean wealth is influenced significantly by a small number of very rich families, which tend to be comprised disproportionately of White and Asian families.
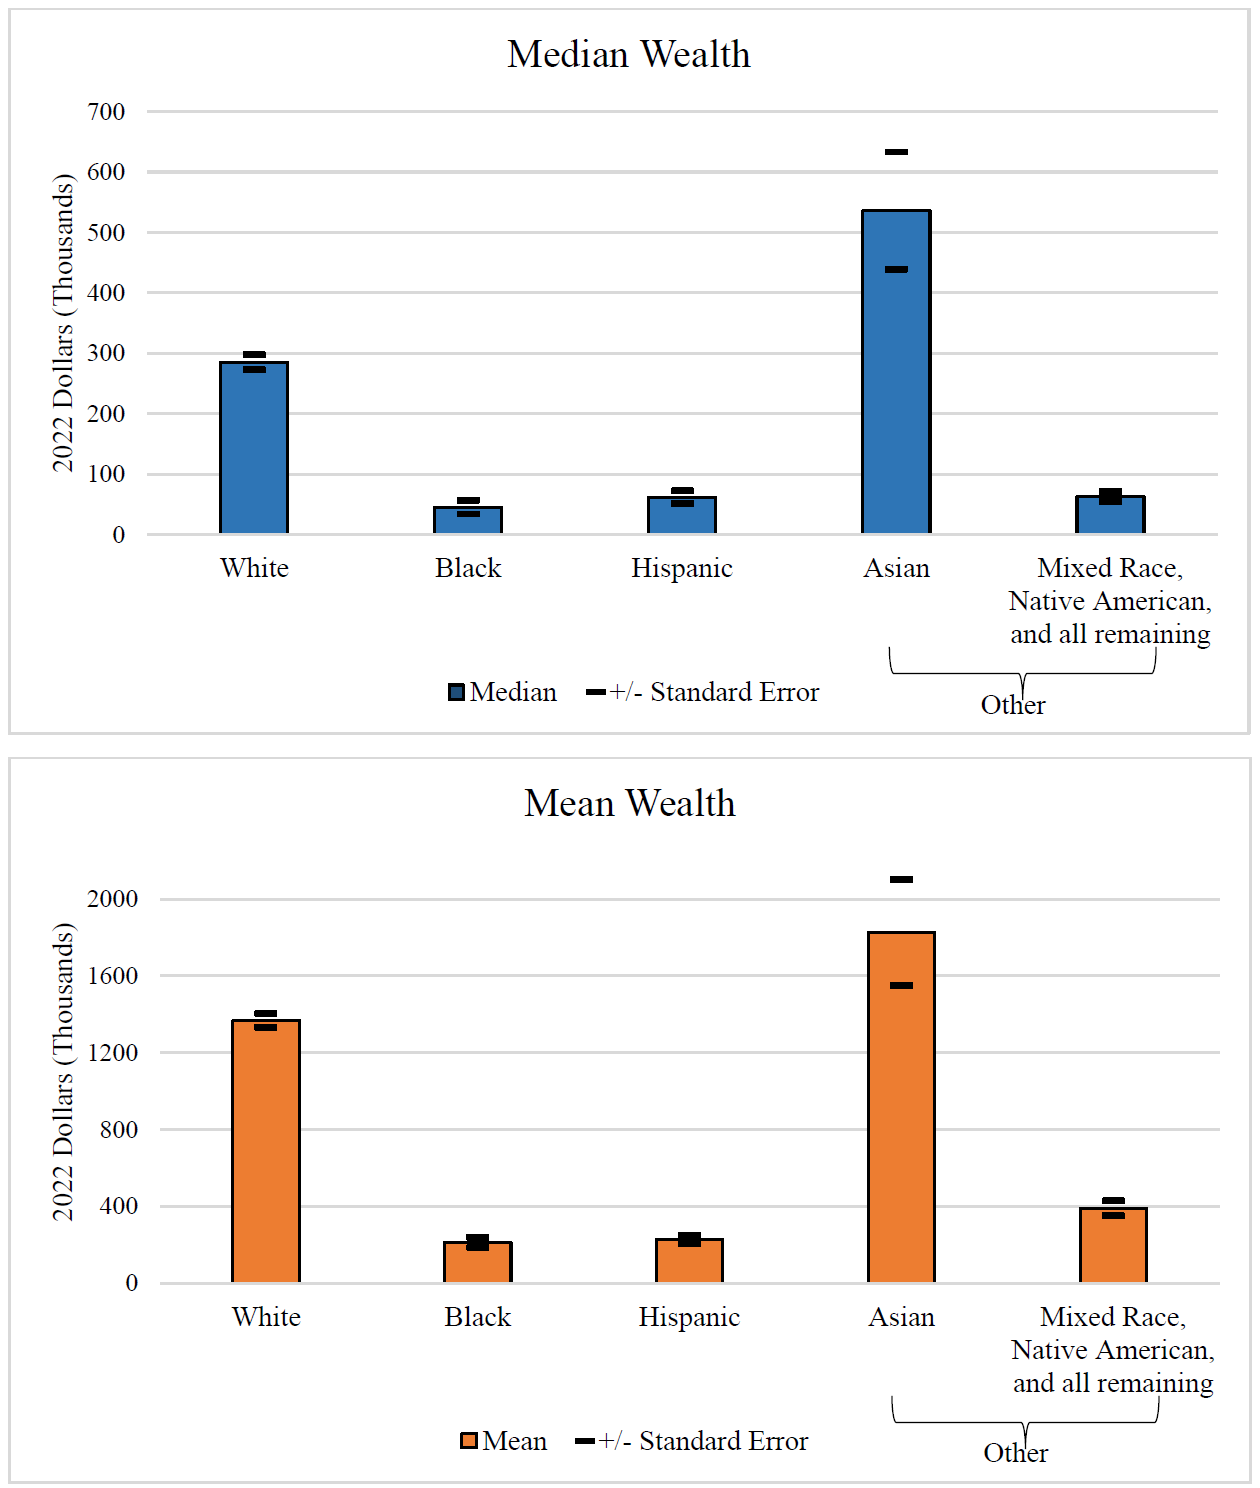
Notes: Figure displays median (top panel) and mean (bottom panel) wealth by race and ethnicity, expressed in thousands of 2022 dollars. Due to an oversample of Asian families, the 2022 SCF can separate Asian families from non-Asian families for the first time (Moore and Pence, 2021). Standard errors use Pence (2015), with 999 bootstrap replicates.
Source: Board of Governors of the Federal Reserve System (2023).
The 2022 SCF provides a look at families' finances at one point in time. We now turn to how families' finances have changed over recent history and factors that contributed to these changes, with particular focus on how things have evolved since the previous survey in 2019.
An Update on Racial Wealth Gaps
To look at how families' finances have changed over time, for the remainder of this note we define an "other" race category that combines Asian families (about 30 percent of "other") with all remaining families (about 70 percent).
As shown in Figure 2, present-day racial wealth gaps—the difference in wealth between two groups—stem from sizable and persistent differences in wealth.6 Between 2019 and 2022, wealth for the typical Black family rose 61 percent and for the typical Hispanic family it rose 47 percent, continuing substantial gains for both groups since the 2013 SCF, while the typical White family saw a 31 percent increase. However, despite faster growth in wealth for the typical Black and Hispanic family, the absolute dollar-value differences in wealth between the typical White and the typical Black and Hispanic family grew in 2022 because the typical Black and Hispanic family had less wealth in 2019. Both the White-Black and the White-Hispanic median wealth gaps increased by around $50,000 between 2019 and 2022, with each gap reaching over $220,000 in 2022. Other race families—a combination of relatively wealthy Asian families and the remaining race groups whose wealth is similar to Black and Hispanic families (as shown in Figure 1)—have mean and median wealth levels between those of White families and Black and Hispanic families. Other families also saw faster growth in median wealth than White families; however, the White-other wealth gap increased as well. Because means are more sensitive to extreme values than medians, mean gaps in wealth increased by more than median gaps for all races and ethnicities.
Figure 2. Wealth Gaps Persisted and Widened Slightly in 2022, Despite Faster Growth in Wealth for Black and Hispanic Families
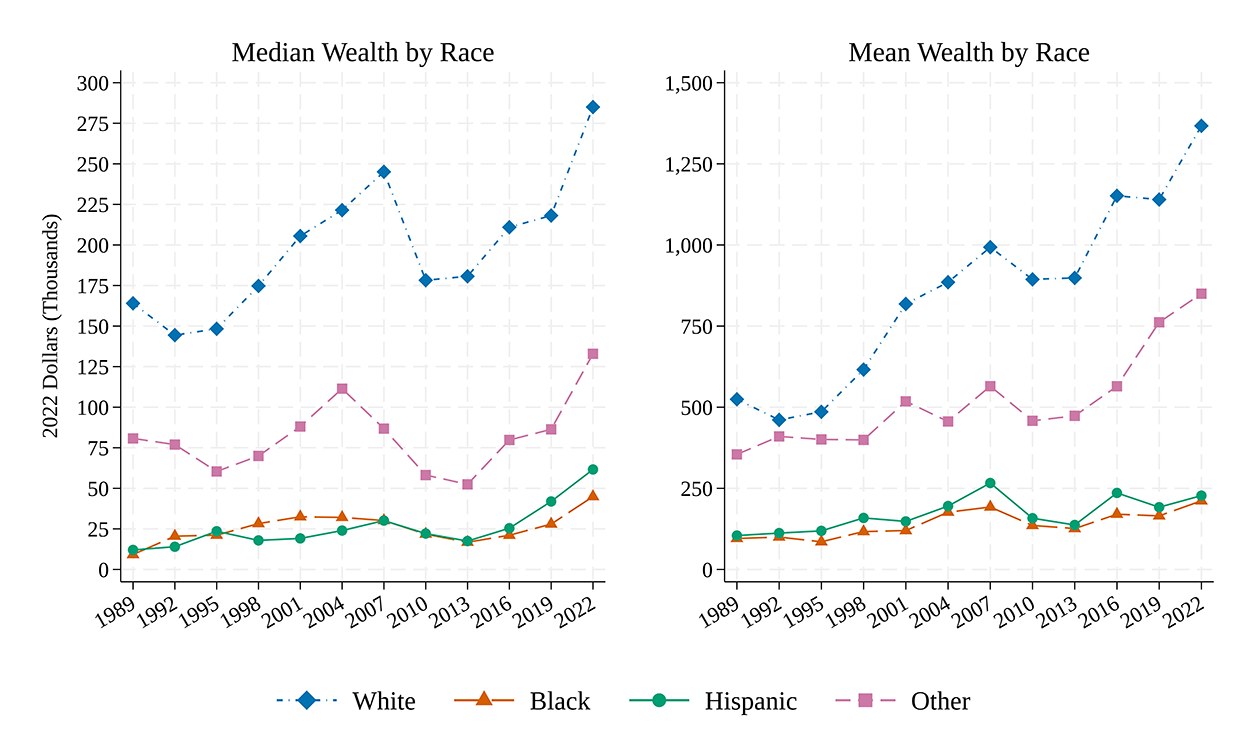
Notes: Figures displays median (left panel) and mean (right panel) wealth by race and ethnicity, expressed in thousands of 2022 dollars, over the history of the SCF.
Source: Board of Governors of the Federal Reserve System (2023).
Another way to measure racial wealth inequality is to compute the ratio of a typical non-White family's wealth to that of a typical White family (Derenoncourt, Kim, Kuhn, and Schularick, forthcoming). Despite strong growth in wealth for non-White families over the past two surveys, we remain far from racial equality, reflecting the large differences in wealth that have persisted for decades. Taking a slightly longer-run view, since the Great Recession the typical Black and Hispanic family has had between about $10 to $15 of wealth for every $100 held by the typical White family (Figure 3). This ratio has closed only modestly in the past two surveys. The typical Black family went from having about $9 in wealth for every $100 held by the typical White family in 2013 to around $16 in 2022; the typical Hispanic family went from having about $10 in wealth for every $100 held by the typical White family in 2013 to around $22 in 2022. The typical other family has hovered between about $30 to $40 for every $100 held by the typical White family. This ratio has closed somewhat more substantially over the past three surveys, but the typical other race family continues to have less than half the wealth of the typical White family.
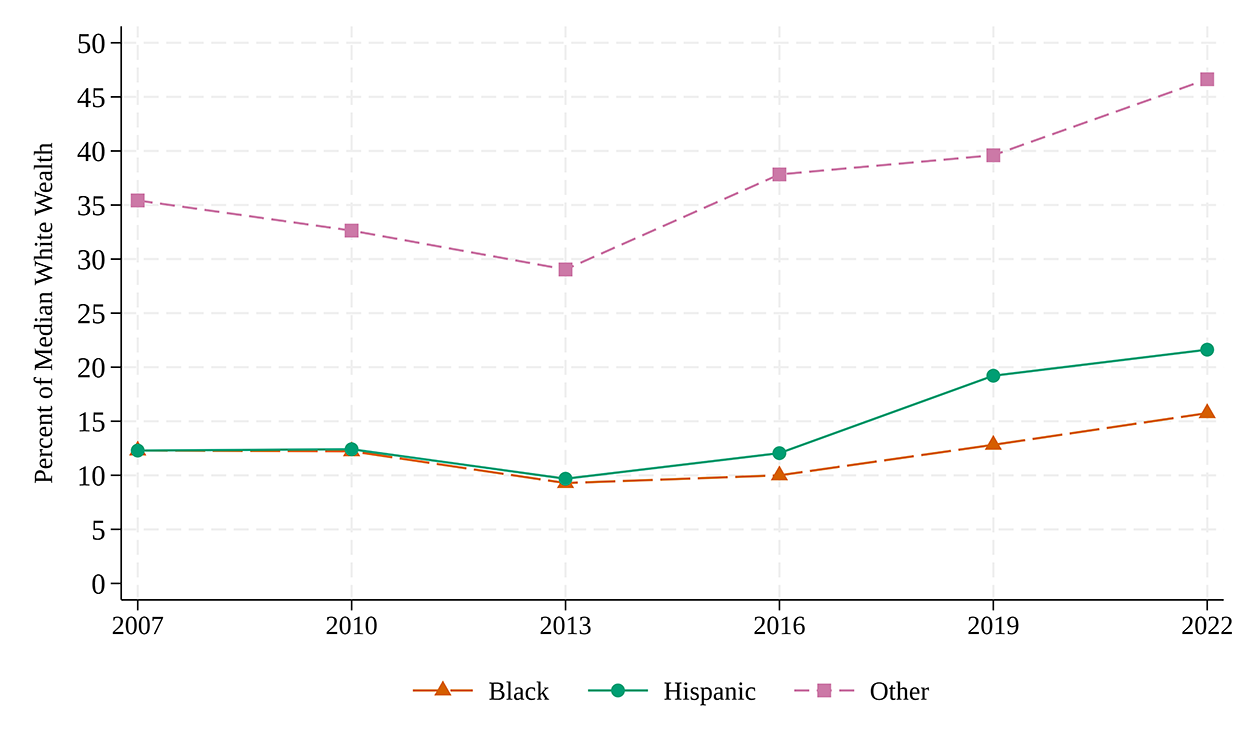
Notes: Figure displays wealth that the typical Black, Hispanic, and other race family had as a percent of the wealth of the typical White family.
Source: Board of Governors of the Federal Reserve System (2023).
Which Assets Contributed to Wealth Growth by Race and Ethnicity?
In this section, we take a closer look at what contributed to changes in wealth by race and ethnicity between 2019 and 2022.
On net, asset values—from houses to stocks—rose dramatically amid the monumental economic changes wrought by COVID-19.7 However, the large and persistent differences in asset ownership across race and ethnicity may dramatically change how asset price increases affect families' financial situations.
Figure 4 decomposes the growth in mean wealth between 2019 and 2022 for each race and ethnicity into contributions from different assets.8 The stacked bars indicate how much total wealth growth was increased (bars above zero) or decreased (bars below zero) by each asset, with total wealth growth for each race noted by the dots. Most notable is the increase in net housing wealth (yellow)—the market value of a family's home minus any outstanding loans secured by the home—among all groups, but particularly for Black and Hispanic families. In part, the larger increase for Black and Hispanic families reflects the fact that these families tend to have higher leverage ratios, which amplifies the effect of rising prices on wealth, though it also reflects an increase in homeownership rates among these families—a fact we will return to momentarily. Net business equity (orange) also rose, particularly among non-Hispanic families. Stock wealth (green) also contributed significantly for White and other race families, although low initial holding led to only modest wealth changes due to stock price increases for Black and Hispanic families.9
Figure 4. Increases in Net Housing Wealth Drove Wealth Growth, Especially for Black and Hispanic Families
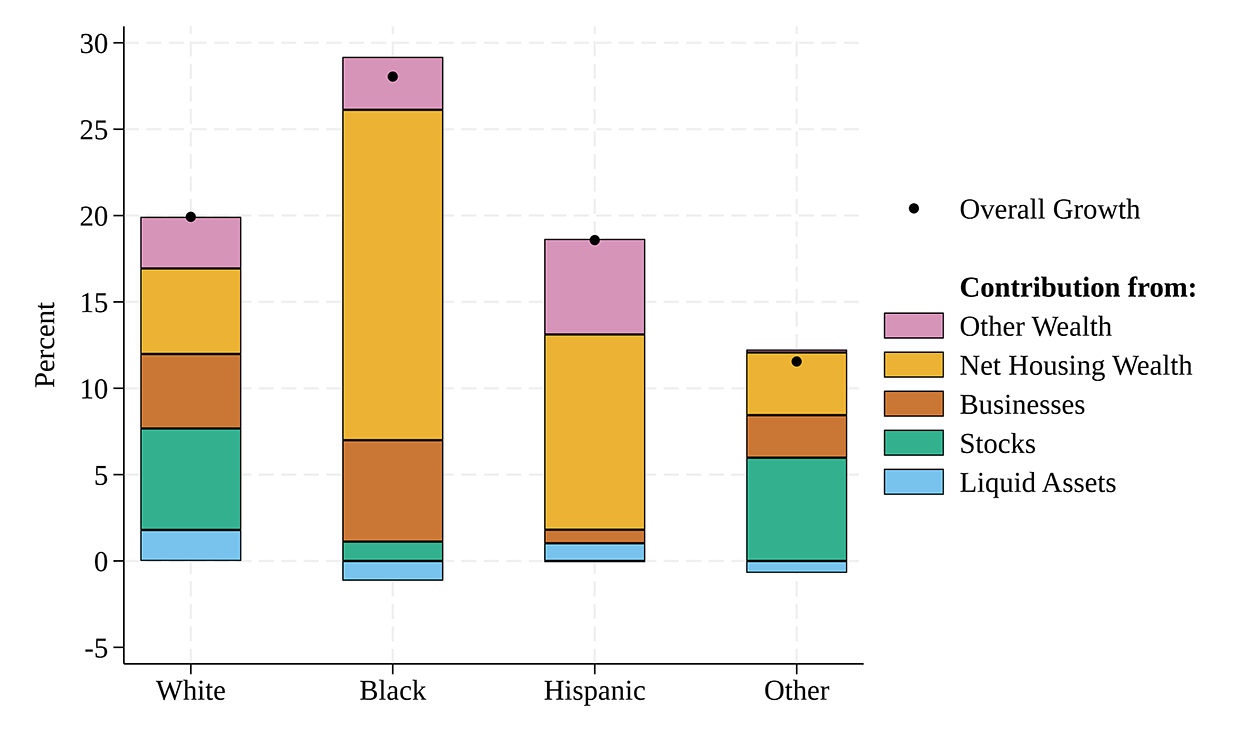
Notes: Figure displays the contributions to growth in average wealth between 2019 and 2022 from various types of assets by race and ethnicity. Bars above zero indicate holdings of the asset increased, while bars below zero show holdings of the asset declined. Average total wealth growth for each race and ethnicity is denoted by the dots. Except for Hispanic families, contribution bars appear in the order in which they appear in the legend, though the other wealth contribution for other race families is small. The stock wealth contribution for Hispanic families is a small negative and appears below zero.
Source: Board of Governors of the Federal Reserve System (2023).
The three panels of Figure 5 show the fraction of families of each race and ethnicity that own a home, stock, or a business.10 Over recent history, White families have owned all three of these assets at higher rates than non-White families. But from 2019 to 2022 the ownership rates between White and non-White families converged somewhat.
Beginning with the left panel of Figure 5, homeownership rates among non-White families increased between 2019 and 2022, closing some of the large gaps that previously existed. Even so, only about 45 percent of Black families and half of Hispanic families owned their home. Stock market participation (center panel) increased rather sharply across all races, though particularly for Black families. This increase continued an upward trend in stock ownership since 2010 across each race and ethnicity at nearly every usual income level.11 The gaps in business ownership (right panel) closed even more significantly, as ownership rates among White and other race families remained roughly flat while Black and Hispanic business ownership grew markedly over this period. Our findings complement recent studies that document a surge in new business formations.12
Figure 5. Ownership Rates for Homes, Stock, and Businesses Increased for non-White Families Between 2019 and 2022
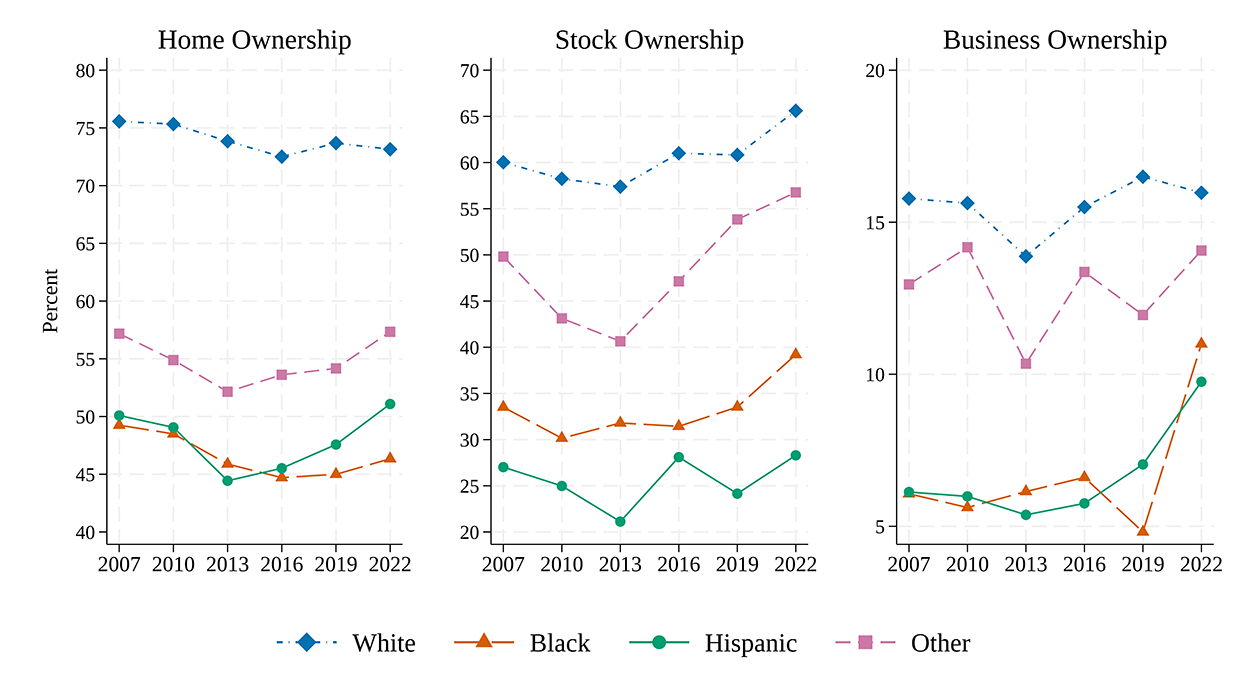
Notes: Figure displays the ownership rate for primary residences (left panel), stock (center panel), and businesses (right panel) by race and ethnicity.
Source: Board of Governors of the Federal Reserve System (2023).
Amid rising house prices, home equity for homeowners moved up sharply for families of all races and ethnicities, as shown in the left panel of Figure 6. While more non-White families became stock or business owners, the value of these assets among new owners is often modest, bringing down the value of stocks or businesses for the typical family that owned these assets, as shown in the other panels. Nonetheless, the increases in participation signal a shift toward wealth-building assets that may facilitate Black and Hispanic families better keeping pace with White families when asset prices rise.
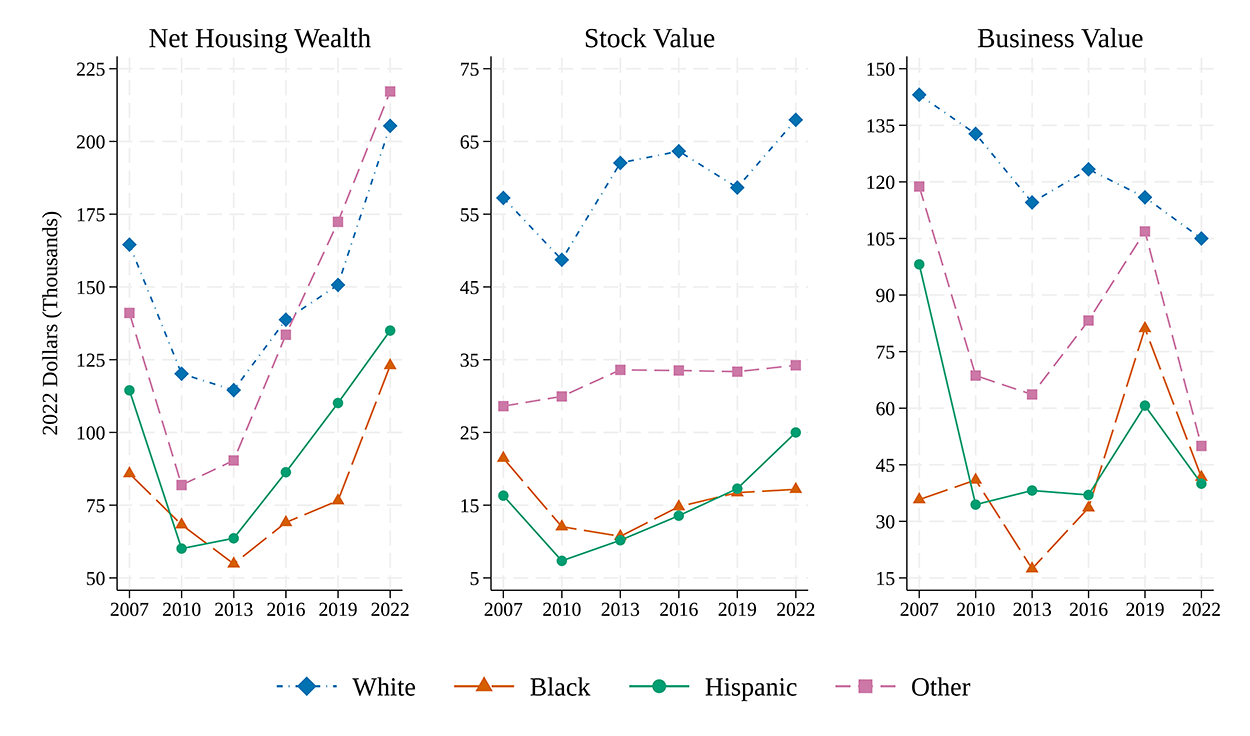
Notes: Figure displays the value for the typical family of the primary residence net of all housing-secured debt (left panel), stocks (center panel), and businesses (right panel) among families that owned the respective assets, by race and ethnicity.
Source: Board of Governors of the Federal Reserve System (2023).
Sources of Income Growth Were Different across Race and Ethnicity
Between the 2019 and 2022 surveys, families' incomes did not grow nearly as robustly as their wealth. Adjusted for inflation, incomes for the typical family across race and ethnicity were roughly stagnant (Table 1, left panel).13 Income increased 1 percent for the typical White family and 6 percent for the typical other race family; the typical Black and Hispanic family's income fell by 2 and 1 percent, respectively. All races and ethnicities saw their mean incomes improve, but the gain was largest for White families (Table 1, right panel).
Table 1: Median and Mean Income, by Race and Ethnicity
| Median | Mean | |||||
|---|---|---|---|---|---|---|
| 2019 | 2022 | Percent Change | 2019 | 2022 | Percent Change | |
| White | 80.0 | 81.1 | 1.3 | 142.4 | 165.2 | 16.1 |
| Black | 46.7 | 46.0 | -1.6 | 69.1 | 71.0 | 2.8 |
| Hispanic | 47.2 | 46.7 | -1.1 | 67.8 | 71.5 | 5.5 |
| Other | 64.6 | 68.3 | 5.7 | 129.8 | 135.1 | 4.1 |
Notes: Thousands of 2022 dollars.
Source: Board of Governors of the Federal Reserve System (2023).
Diving a bit deeper, families of different races and ethnicities experienced very different types of income growth (Figure 7).14 On average, wage and salary income (light blue) was almost flat for Black and Hispanic families, while it grew considerably for White and other families. However, Black and Hispanic families saw a larger increase in income due to non-retirement government transfer programs (yellow), such as unemployment insurance (UI) or food stamps (SNAP). Compared to wage income, these sources are likely to be less available in the future given the unprecedented pandemic-era fiscal support that has already ended or will end.15 Notably, investment income (including interest, dividends, and capital gains, shown in orange) was a significant contributor to growth for White families, but far less for non-White families who hold far fewer of these assets. While some investment income is likely to be relatively transitory, families who benefit from investment income are likely to be wealthier.
Overall, Figure 7 suggests average incomes generally rose, albeit more for White families. Notably, persistent components of income, such as real wages and salaries, disproportionately grew for White and other families. Wages and salaries were about unchanged for Black and Hispanic families, who instead benefited more from government support, including extraordinary pandemic-era programs that have likely ended.
Figure 7. Wages and Salaries Drove Income Growth for White and Other Families, while Non-Retirement Government Programs Supported Growth for Black and Hispanic Families
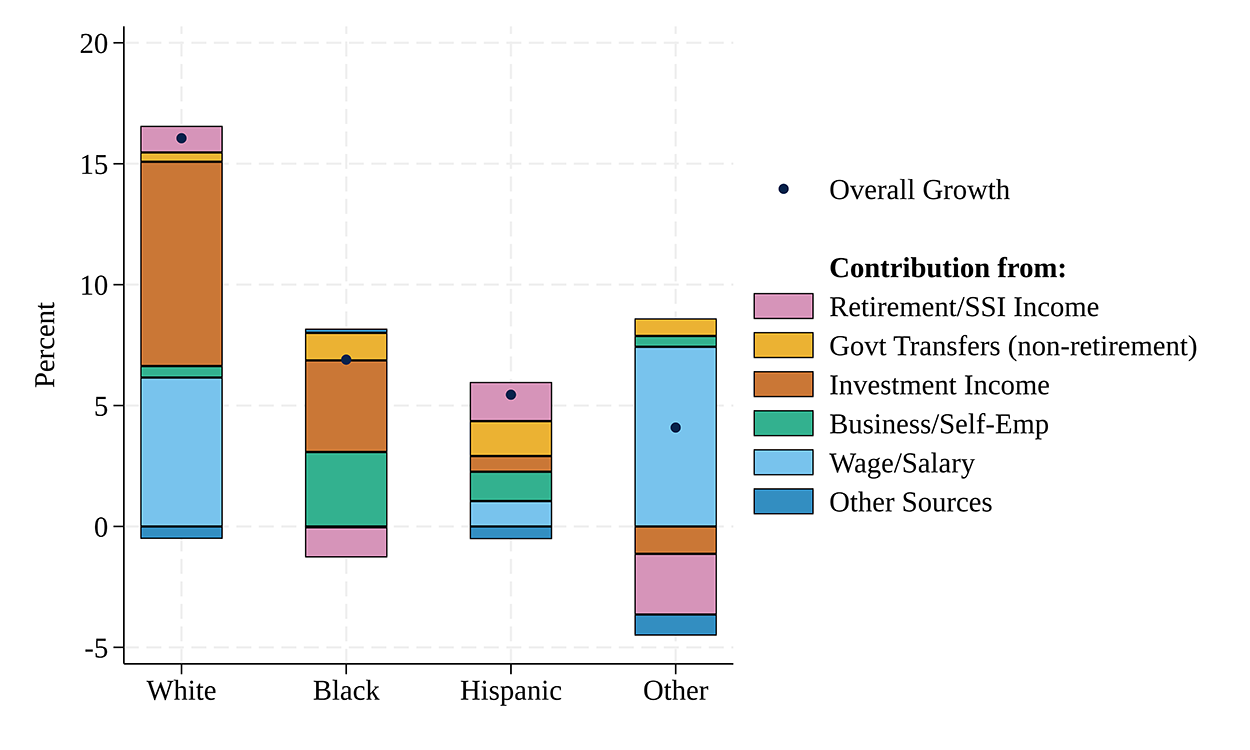
Notes: Figure displays the contributions to growth in average income between 2019 and 2022 from various income sources by race and ethnicity. Bars above zero indicate the income source grew, while bars below zero show the income source shrank. Average total income growth for each race and ethnicity is denoted by the dots. SSI is Supplemental Security Income. The figure excludes one Black family from the 2019 survey with the highest Retirement and SSI.* Contributions bars appear in the order listed in the legend except for the following: Retirement income appears below zero and other sources appears at the top for Black families. Investment income, retirement income, and other sources appear in this order descending from zero for other race families.
*This sentence was added on October 23, 2023. Return to text
Source: Board of Governors of the Federal Reserve System (2023).
Families Were Able to Meet Required Payments. But Families, Especially Non-White Families, Reported More Economic Uncertainty
Given the unusual composition of income growth in the past three years, and the dissonance between rising wealth and wage growth between races and ethnicities, a natural question is how families, broadly speaking, are faring financially. Are families able to use their income to meet required payments? How do families perceive their current financial situation? And what do they expect for their financial futures? The SCF is well-positioned to answer these questions compared with other surveys, as it asks families both about their actual current financial health—such as debt payments, income, and wealth—along with their perceptions and expectations of their current and future financial health.16
We begin by looking at a measure of whether families could cover debt and housing expenses with their income. In particular, we use the SCF to construct the share of pre-tax income families used to make required payments on loans, rent, and other fees, which we refer to as the "required payment to income ratio" or RPIR.17 The RPIR gives us both a sense of whether families were able to use their income to meet these required payments, and how much income they had left to spend in a more discretionary fashion or to save in order to build wealth. Figure 8 shows the RPIR for the typical family has continued to tick down for all races and ethnicities even as rents have risen.18 The decline is similar across race and ethnicity, although it's a bit sharper for the typical other family. Altogether, the fall in RPIR suggests a modest improvement in families' abilities to meet their financial obligations without depleting their liquid savings, and more financial stability in the household sector than we saw in the 2008 recession.19
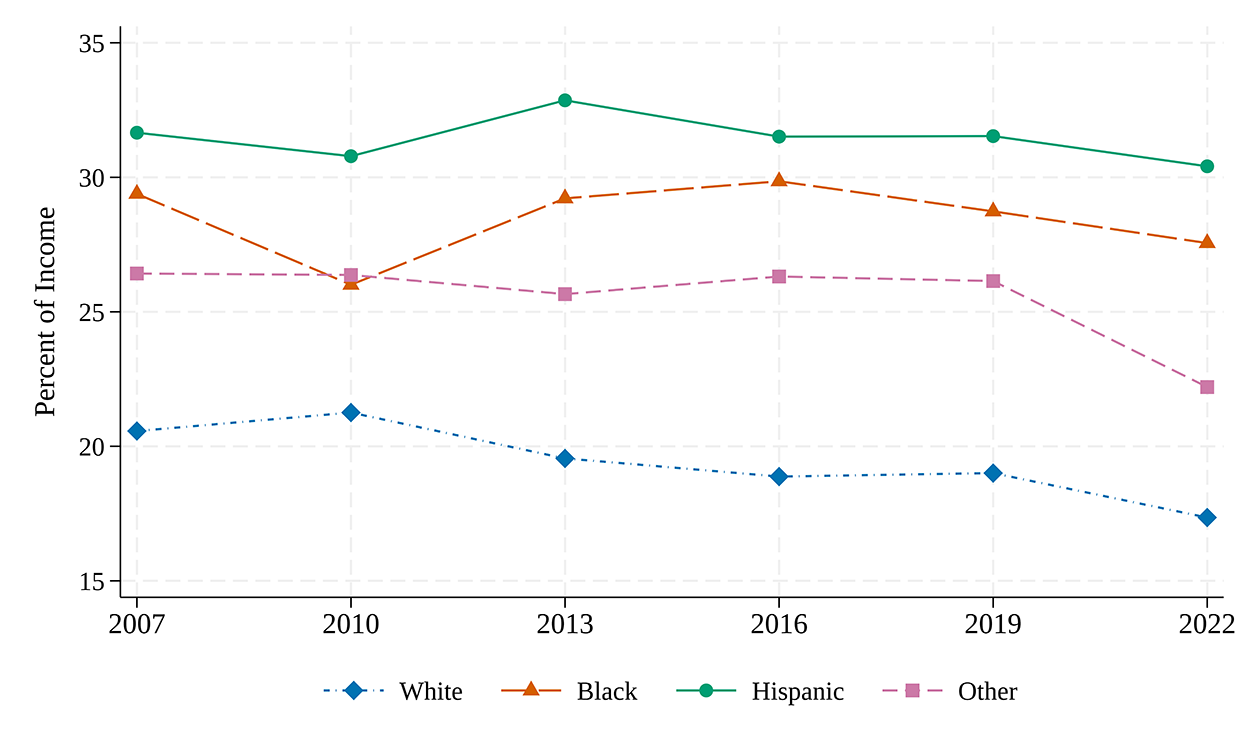
Notes: Figure displays the median share of pre-tax income families used to make required payments on loans, rent, and other fees by race and ethnicity, using the "rent-inclusive payment-to-income ratio" from Chang, Hsu, Pack, and Palumbo (2018). We look at families with positive income. Higher numbers indicate more income went to these required payments, and so higher numbers imply families had less income to otherwise spend or save.
Source: Board of Governors of the Federal Reserve System (2023).
Overall, families were wealthier in 2022 than in 2019 and appear to have had sufficient income to cover their recurring expenses, but some of their ability to cover their expenses with income may have been due to transitory factors that temporarily buoyed incomes in 2021. While families can also cover expenses using wealth, particularly for Black and Hispanic families the gains in wealth were concentrated in housing, which is somewhat illiquid and may not be as useful as liquid wealth for covering recurring expenses. As shown in Figure 4, real average liquid wealth, which includes assets such as cash, checking, and savings accounts, did not grow much for Hispanic families and fell for Black families.
To get a better sense of how families thought about this mixture of indicators of financial well-being, we turn to a series of SCF questions that provide insight into families' own views about their current and future income, as well as the economy more broadly. First, we look at changes in the fraction of families who reported their income deviated from what the SCF calls usual income, which is the income the family would expect to earn in a "normal" year. Figure 9 shows the share of families, by race and ethnicity, that reported their income was unusually low (top panel) or high (bottom panel). Between the 2019 and 2022 surveys, the share of White families that said their income was lower than usual went up by 2.1 percentage points, and the share that said it was higher than usual went up by the same amount, perhaps indicating a bit more income volatility for White families. At the same time, the share of non-White families that said their income was unusually low went up by much more—ranging from an increase of 6.3 percentage points for other families to 9.0 percentage points for Black families. There is also no correspondingly large increase in the share of non-White families that said their income was unusually high.
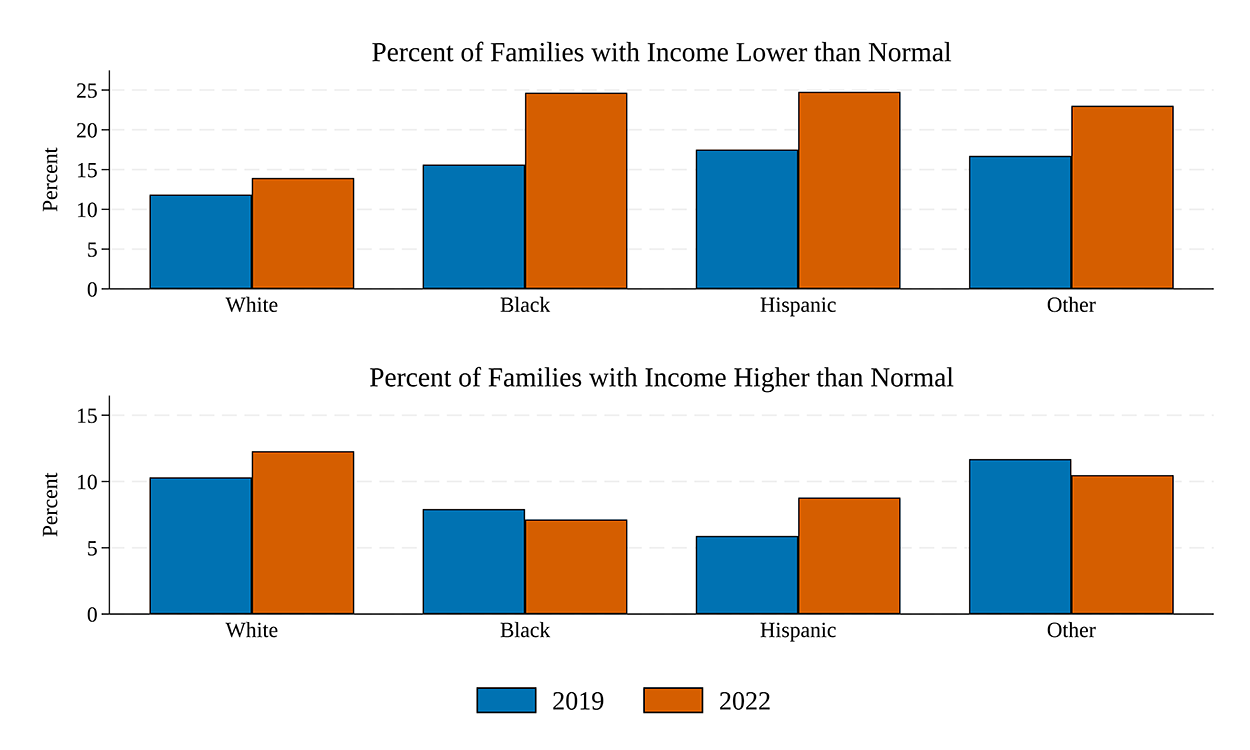
Notes: Figure displays the percent of families that said their income was lower (top panel) or higher (bottom panel) than a "normal" year, by race and ethnicity. The key identifies series in order from left to right.
Source: Board of Governors of the Federal Reserve System (2023).
The increase in the share of families reporting unusually low incomes is widespread across families, not just among lower-income families (not shown).20 Therefore, we see a broad-based increase in economic pessimism that was especially strong for non-White families.
In addition to usual income, the SCF also asks families about their uncertainty about their income next year.21 Figure 10 shows the share of families who reported they were uncertain about next year's income increased since 2019 for every race and ethnicity. However, the step-up in uncertainty for Black and Hispanic families was especially strong—14.2 percentage points and 10.9 percentage points more families reported uncertainty about their income next year, respectively, considerably more than the increase among White families (7.0 percentage points). Other families also reported an increase in uncertainty of 9.2 percentage points. Once again, the cross-race patterns appear consistent with transitory income sources propping up families' income that they did not expect to continue in the future, especially for non-White families.22
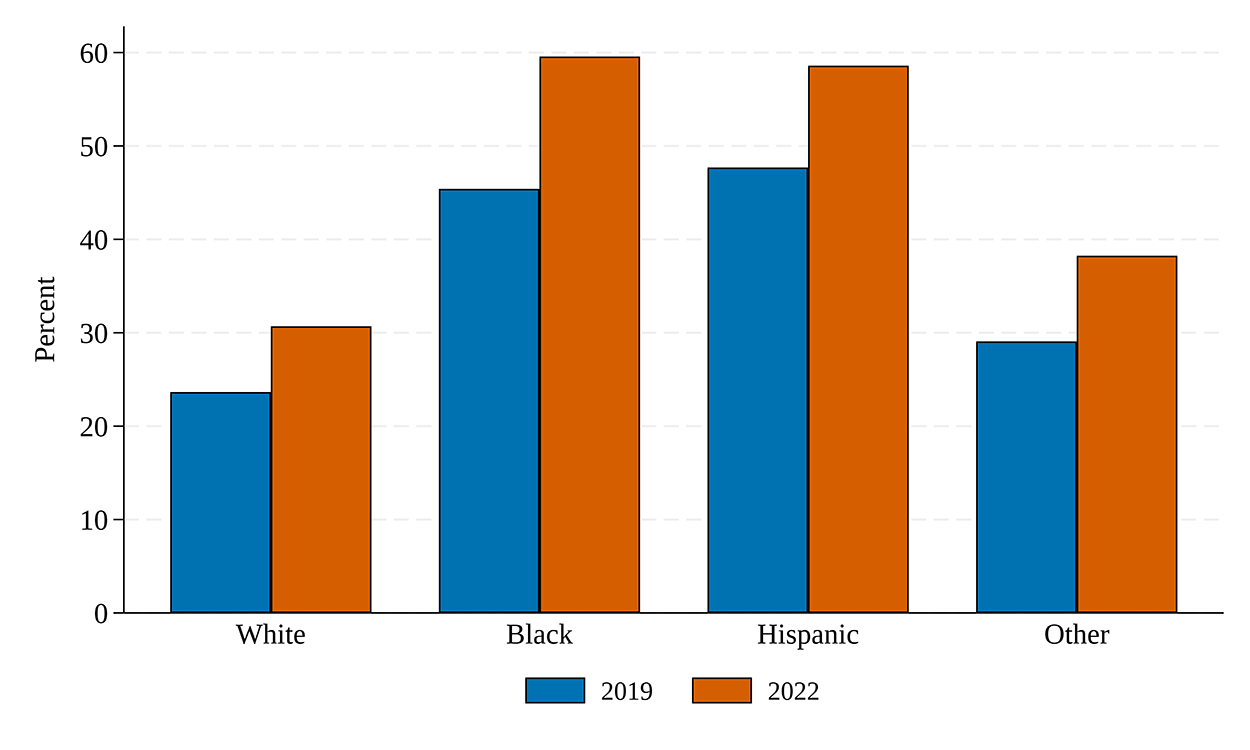
Notes: Figure displays the share of families that said they did not have a good idea of family income next year, by race and ethnicity. Non-White families were more likely than White families to be uncertain about future income. While families of all races and ethnicities were more uncertain about future income in 2022 than in 2019, the increase in uncertainty was larger for non-White families. The key identifies series in order from left to right.
Source: Board of Governors of the Federal Reserve System (2023).
Given that families had increasingly dour views of their current income and elevated uncertainty about future income, we now turn to their views of the economy more broadly. A number of other surveys suggest there has been a considerable increase in the number of families that have a pessimistic outlook about both the macroeconomy and families' individual financial situations since 2019.23
Respondents to the 2022 SCF were also more pessimistic about the economy's future than in 2019. Figure 11 shows that the percent of families saying the future economy will be worse skyrocketed in 2022 across all races and ethnicities.24 In fact, the share of families expecting a worse economy is at or near record highs for all races and ethnicities, far eclipsing the 2010 SCF, which was fielded in the aftermath of the Great Recession.
Figure 11. More Families of All Races and Ethnicities Expected a Worse Economy over the Next Five Years
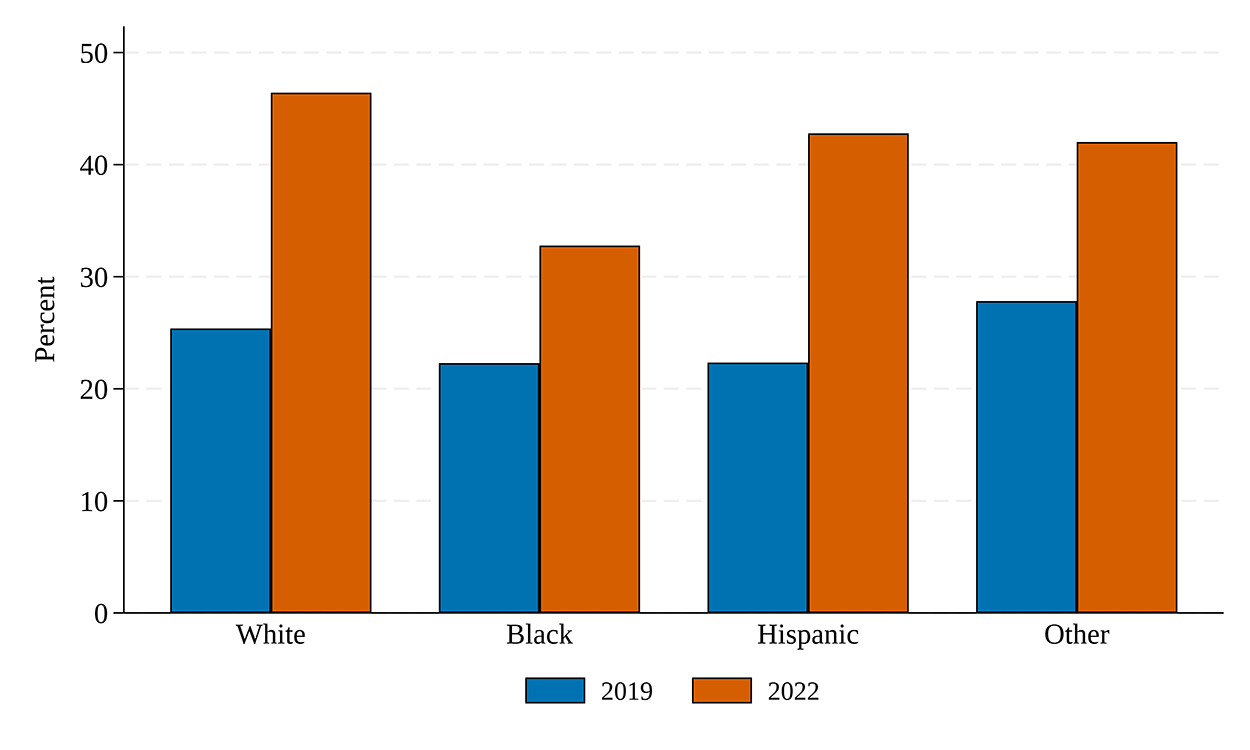
Notes: Figure displays the percent of families that said they expected the economy to perform worse over the next five years, compared to the previous five years, by race and ethnicity. A much higher share of families of each race and ethnicity displayed pessimism about the future economy in 2022 than in 2019. The key identifies series in order from left to right.
Source: Board of Governors of the Federal Reserve System (2023).
Overall, the SCF depicts a complex account of families' finances and disparities across race and ethnicity. Broad-based gains in wealth across race and ethnicity have narrowed wealth ratios somewhat over the past three years, but income ratios widened slightly. In particular, incomes for non-White families were propped up by temporary sources, like government support, that have ended, with real wages stagnant, on average, for Black and Hispanic families. While most families were able to meet their required payments, families, especially non-White families, have grown more pessimistic and uncertain about the current and future state of both their own finances and the economy. The recent improvements in wealth ratios across races is promising, but families' increased financial uncertainty suggests continued improvements may not persist in the future.
References
Aladangady, Aditya, Jesse Bricker, Andrew C. Chang, Sarena Goodman, Jacob Krimmel, Kevin B. Moore, Sarah Reber, Alice Henriques Volz, and Richard A. Windle (2023). Changes in U.S. Family Finances from 2019 to 2022: Evidence from the Survey of Consumer Finances. Washington: Board of Governors of the Federal Reserve System, October, https://doi.org/10.17016/8799
Aladangady, Aditya, and Akila Forde (2021). "Wealth Inequality and the Racial Wealth Gap," FEDS Notes. Washington: Board of Governors of the Federal Reserve System, October 22, https://doi.org/10.17016/2380-7172.2861
Bhutta, Neil, Jacqueline Blair, Lisa Dettling, and Kevin Moore (2020). "COVID-19, the CARES Act, and Families' Financial Security," National Tax Journal 73:3, pp 645-672.
Bhutta, Neil, Andrew C. Chang, Lisa J. Dettling, and Joanne W. Hsu (2020). "Disparities in Wealth by Race and Ethnicity in the 2019 Survey of Consumer Finances," FEDS Notes. Washington: Board of Governors of the Federal Reserve System, September 28, https://doi.org/10.17016/2380-7172.2797
Bricker, Jesse, Sarena Goodman, Kevin Moore, Sarah Reber, Alice Henriques Volz, and Richard Windle (2023). "U.S. Families' Experiences of the COVID-19 Pandemic: Evidence from the Survey of Consumer Finances," FEDS Notes. Washington: Board of Governors of the Federal Reserve System, October 18.
Board of Governors of the Federal Reserve System. Division of Research and Statistics, Microeconomic Surveys (2023). "Survey of Consumer Finances," https://doi.org/10.17016/datasets.001
Chang, Andrew C., Joanne W. Hsu, Sarah J. Pack, and Michael G. Palumbo (2018). "Where's the Money Going? The Importance of Accounting for Rent Payments in Measuring a Household's Financial Obligations," FEDS Notes. Washington: Board of Governors of the Federal Reserve System, June 20, https://doi.org/10.17016/2380-7172.2213
Decker, Ryan A., and John Haltiwanger (2022). "Surging Business Formation in the Pandemic: Causes and Consequences," Annual Boston Federal Reserve Conference, November 2022.
Derenoncourt, Ellora, Chi Hyun Kim, Moritz Kuhn, and Moritz Schularick (forthcoming). "Wealth of Two Nations: The U.S. Racial Wealth Gap, 1860-2020," Quarterly Journal of Economics.
Dettling, Lisa J., Joanne W. Hsu, Lindsay Jacobs, Kevin B. Moore, and Jeffrey P. Thompson (2017). "Recent Trends in Wealth-Holding by Race and Ethnicity: Evidence from the Survey of Consumer Finances," FEDS Notes. Washington: Board of Governors of the Federal Reserve System, September 27, https://doi.org/10.17016/2380-7172.2083
Haltiwanger, John C. (2022). "Entrepreneurship during the COVID-19 pandemic: Evidence from the Business Formation Statistics," Entrepreneurship and Innovation Policy and the Economy 1.1, pp 9-42.
Haughwout, Andrew, Donghoon Lee, Daniel Mangrum, Joelle Scally, and Wilbert van der Klaauw (2023). "Younger Borrowers Are Struggling with Credit Card and Auto Loan Payments," Liberty Street Economics. New York: Federal Reserve Bank of New York, February 16. http://web.archive.org/web/20230906022429/https://libertystreeteconomics.newyorkfed.org/2023/02/younger-borrowers-are-struggling-with-credit-card-and-auto-loan-payments/
McIntosh, Kriston, Emily Moss, Ryan Nunn, and Jay Shambaugh (2020). "Examining the Black-White Wealth Gap," Brookings Institution 27.
Moore, Kevin B., and Karen M. Pence (2021). "Improving the Measurement of Racial Disparities in the Survey of Consumer Finances," FEDS Notes. Washington: Board of Governors of the Federal Reserve System, June 21, https://doi.org/10.17016/2380-7172.2945
Pence, Karen (2015). "SCFCOMBO: Stata module to estimate errors using the Survey of Consumer Finances," Statistical Software Components S458017, Boston College Department of Economics, revised 04 Oct 2015.
Pew Research Center (2023). "Economic Ratings are Poor – and Getting Worse – in Most Countries Surveyed," June 15. http://web.archive.org/web/20230720163935/https://www.pewresearch.org/short-reads/2023/06/15/economic-ratings-are-poor-and-getting-worse-in-most-countries-surveyed/
Thompson, Derek (2022). "Everything Is Terrible, but I'm Fine," The Atlantic, June 1, http://web.archive.org/web/20230926141059/https://www.theatlantic.com/newsletters/archive/2022/06/american-economy-negative-perception-inflation/661149/
Thompson, Jeffrey, and Alice Henriques Volz (2021). "A New Look at Racial Disparities Using a More Comprehensive Wealth Measure," Federal Reserve Bank of Boston Current Policy Perspectives, August 16.
University of Michigan. (2023). Survey Research Center. "Surveys of Consumers," Accessed September 21, 2023. http://web.archive.org/web/20230705013817/https://data.sca.isr.umich.edu/data-archive/mine.php
1. Division of Research and Statistics, Board of Governors of the Federal Reserve System. The analysis and conclusions set forth are those of the authors and do not necessarily reflect the views of the Board of Governors or the Federal Reserve staff. Aladangady: [email protected], Chang: [email protected], ORCID 0000-0002-9769-789X, Krimmel: [email protected]. We thank Sarena F. Goodman, Shannon Luk, Kevin B. Moore, Karen M. Pence, Michael Palumbo, Sarah Reber, Alice Henriques Volz, and Lupe Zuniga for helpful comments. Return to text
2. Board of Governors of the Federal Reserve System (2023). For a general overview of the SCF see Aladangady, Bricker, Chang, Goodman, Krimmel, Moore, Reber, Henriques Volz, and Windle (2023). In this note we use the net worth, income, and other definitions from that overview. See their appendix for more details on the components of net worth, which we use as our measure of wealth. The data used in this note are derived from the final internal version of the survey information. All dollar values are adjusted to 2022 dollars using the "current methods" version of the consumer price index for all urban consumers (CPI-U-RS), which is available since 1977. The 2022 SCF collects families' income for 2021 and other information, including wealth, at the time the family is interviewed, which for most families was in mid to late 2022 though for some families was early 2023. Return to text
3. Survey respondents in the SCF are asked to self-identify a race and ethnicity for themselves and, starting in the 2022 survey, for their spouse or partner as well. For comparability across survey waves, we classify families into one of four groups (non-Hispanic White, non-Hispanic Black or African American, Hispanic or Latino, and other) based on the survey respondent's response to these questions. We refer to non-Hispanic White and Black families as "White" and "Black" respectively, and Hispanic or Latino families as "Hispanic". In 2022, an oversample of Black, Hispanic, and Asian families improves measurement of these groups and allows us to separately identify Asian families in the public data. Therefore, with the 2022 SCF we separate the "other" group into "Asian" (about 30 percent of the "other" group) and the remaining families. The remaining families consist of a very racially/ethnically diverse set of families, including those identifying as American Indian, Alaska Native, Native Hawaiian, Pacific Islander, other race, and all respondents reporting more than one racial identification—with this last group being the largest subgroup of the remaining families. Because of small sample sizes, we do not have statistical power to further disaggregate this group of families. For more on the race and ethnicity classifications used in this note, see the appendix to Aladangady, Bricker, Chang, Goodman, Krimmel, Moore, Reber, Henriques Volz, and Windle (2023). Return to text
4. Our estimates are the first measure of racial inequality in 2022 from a nationally representative survey, but display a continuation of large historical racial disparities established in existing literature, including Dettling, Hsu, Jacobs, Moore, and Thompson (2017); McIntosh, Moss, Nunn, and Shambaugh (2020); Bhutta, Chang, Dettling, and Hsu (2020); Aladangady and Forde (2021); Derenoncourt, Kim, Kuhn, and Schularick (forthcoming). Return to text
5. See Moore and Pence (2021) for details on the oversample. See also Thompson and Volz (2021) on the wealth of Asian families. Return to text
6. In historical comparisons with the SCF, we use the modern version of the SCF, which has been fielded every three years since 1989. Return to text
7. The 2022 SCF includes a set of questions intended to capture families' pandemic experiences, which are described by Bricker, Goodman, Moore, Reber, Henriques Volz, and Windle (2023). Return to text
8. Figure 4 is a decomposition of mean wealth, although our results are broadly similar in a similar decomposition of median wealth within each race and ethnicity. To decompose median wealth, we first identify a set of families of each race and ethnicity near the median (for example, between the 40th and 60th percentile) of the race-specific wealth distribution. We then apply a similar methodology as in Figure 4 to decompose growth for this group. Differences between each race and ethnicity for the median remain qualitatively similar to the decomposition of mean wealth, albeit differences are somewhat attenuated. Home equity gains contribute less to growth as fewer families near the median own homes. Stock gains contribute positively for White and other race families, but have negligible effects for near-median Black and Hispanic families. Results appear similar using narrower ranges around median (for example, families between 45th to 55th percentiles of the race-specific wealth distribution). Return to text
9. One notable component of wealth that worked against closing racial wealth gaps was liquid wealth (light blue) which, on average, rose for White families but declined for Black families, and remained fairly constant for Hispanic and other families. Return to text
10. We refer to stock as encompassing both individual shares of companies (directly held stock) and investments that are composed of stock, such as retirement accounts or mutual funds invested in stock (indirectly held stock). Return to text
11. In the SCF, families are asked about whether their actual income they reported in the survey was similar to a "normal" year. For those reporting their actual income deviated from a normal year, the SCF asks a follow-up question about what their income would be in a "normal" year—what the SCF calls "usual income". These questions are designed to assess whether temporary factors, such as an inheritance, capital gain, illness, or a temporary reduction in hours, pushed income away from what it would be in a normal year. Return to text
12. For example, Decker and Haltiwanger (2022); Haltiwanger (2022). Return to text
13. The SCF asks about income received in the year prior to the survey, so our statements about changes in income in the 2022 SCF are for income earned in 2018 to 2021. Return to text
14. As with Figure 4, Figure 7 is a decomposition of mean income, although our results are broadly similar in a similar decomposition for median income within each race and ethnicity. To decompose median income, we first identify a set of families of each race within the 40th and 60th percentile of the race-specific usual income level in each year. We then decompose contributions to growth for this subset of families. Differences between race and ethnicity for median income remain qualitatively similar to the decomposition for mean income, albeit the differences are attenuated. The median income decomposition suggests that wage income fell for White, Black, and Hispanic families, but increased for other families. Non-retirement government transfers remain a major positive contributor for Black and Hispanic families. Asset and business income are more similar across races than in the mean decomposition since these income sources are more common at the upper tail of the income distribution, particularly among White families. Return to text
15. In related work, Bhutta, Blair, Dettling, and Moore (2020) show cash assistance programs from the Coronavirus Aid, Relief, and Economic Security (CARES) Act would have allowed most families to cover normal recurring expenses in the event of job loss. While not all families would have suffered job loss over this period, their results point to the importance of unprecedented fiscal support over this period with large labor market disruptions. Return to text
16. Specifically, the SCF measures expectations of the survey respondent. We refer to families' expectations as those represented by the survey respondent. Return to text
17. This metric is the rent-inclusive payment-to-income ratio from Chang, Hsu, Pack, and Palumbo (2018), which is the ratio of all required payments on debt, rent, leased autos, and real estate taxes and fees to pre-tax income. We look at families with positive income. Return to text
18. Rents rose considerably between the 2019 and 2022 survey, but interest rates had only begun to rise in early 2022, once the SCF was already in the field. That said, many debt obligations like mortgages are fixed-rate contracts. Many homeowners refinanced in 2020 and 2021 when rates were low, and will continue to enjoy low payments even as rates have risen. Return to text
19. Consistent with our results on payment-to-income ratios, Haughwout, Lee, Mangrum, Scally, and van der Klaauw (2023) find that delinquency rates began to return to pre-pandemic levels in late 2022, after dipping due to pandemic-related relief programs. Debt and rent payments in the SCF are recorded as of the time of the interview, which was in 2022 for most families but early 2023 for some. Return to text
20. When grouping families by actual income instead of usual income a similar pattern emerges. These facts are despite an overall increase in both usual and actual income across the respective distributions. Return to text
21. Families are asked whether they have a good idea of family income in the next year, and also whether they usually have a good idea of family income in the next year. Figure 10 shows the share of families of each race and ethnicity that reported they did not have a good sense of income next year. The share of families that reported they usually did not have a good sense follows similar patterns—a small increase for White families, with larger increases for non-White families. Return to text
22. The SCF also asks whether families expect their income to go up more, less, or the same as inflation over the next year and over a five year horizon. Families of all races and ethnicities were less likely to think their income would at least keep up with inflation, though White families were particularly melancholy. The share of White families that expected their income would fall behind inflation over the next five years nearly doubled between 2019 and 2022—from 22.0 percent to 52.6 percent—a record high in the SCF. The share of Hispanic and other families that said that they did not expect their income to at least keep up also more than doubled to their own record highs. The share for Black families also rose sharply from 15.9 percent in 2019 to 27.7 percent in 2022, close to the levels seen around the Global Financial Crisis. Return to text
23. For example, see Thompson (2022); Pew Research Center (2023). The University of Michigan's Surveys of Consumers, which measures consumer sentiment, also indicated a low point for consumer sentiment in mid-2022 that had not yet recovered to earlier highs in sentiment by early-2023, which was the time period that the 2022 SCF data were collected (University of Michigan, 2023). Return to text
24. The SCF asks families whether they expect the economy next year to be better, worse, or the same as it is at the time of the interview. Analogously, the SCF also asks families whether the economy over the next five years will be better, worse, or the same as the previous five years. We show expectations over a five-year horizon in the text. Results hold at a one-year horizon as well. Return to text
Aladangady, Aditya, Andrew C. Chang, and Jacob Krimmel (2023). "Greater Wealth, Greater Uncertainty: Changes in Racial Inequality in the Survey of Consumer Finances," FEDS Notes. Washington: Board of Governors of the Federal Reserve System, October 18, 2023, https://doi.org/10.17016/2380-7172.3405.
Disclaimer: FEDS Notes are articles in which Board staff offer their own views and present analysis on a range of topics in economics and finance. These articles are shorter and less technically oriented than FEDS Working Papers and IFDP papers.