FEDS Notes
June 29, 2020
How Correlated is LIBOR with Bank Funding Costs?
David Bowman, Chiara Scotti, and Cindy M. Vojtech1
In a recent article in the BIS Quarterly Review, authors Schrimpf and Sushko (2019) provide an overview of the LIBOR transition to risk-free rates led by the FSB Official Sector Steering Group (OSSG). They also argue that rates like LIBOR may be desirable because banks "require a lending benchmark that behaves not too differently from the rates at which they raise funding."2 In this note, we examine how correlated LIBOR actually has been with available measures of bank funding costs. We show that U.S. banks' reliance on the wholesale unsecured markets that are meant to underpin LIBOR has diminished considerably, as has been noted in OSSG documents, and that these markets now represent a small fraction of overall bank funding. We find that LIBOR is not more correlated with our measures of bank funding cost than risk-free rates, even during the 2007-2009 crisis. In fact, measures of risk-free rates, like averages of overnight Treasury repo rates or forward-looking term rates imputed from fed funds futures, appear to be more correlated with banks' overall cost of funding over the pre-crisis, crisis, and post-crisis periods. Due to the limitations of our data, we can only measure average bank funding cost, and not marginal funding costs, but we argue that there are a number of potential marginal funding sources that are not, or do not need to be, tied to LIBOR. Finally, we show that several sources of balance sheet exposure could potentially be readily swapped to another interest rate such as the Secured Overnight Financing Rate (SOFR).
Did LIBOR rise in earlier recessions?
Part of the argument made by Schrimpf and Sushko for the desirability of LIBOR-like rates is that wholesale unsecured funding costs may rise relative to other money market rates in times of stress such as during the financial crisis. Spreads of LIBOR to overnight index swap (OIS) rates clearly did rise during the 2007-2009 financial crisis, with 3-month LIBOR averaging about 100 basis points higher (relative to the pre-crisis level of spreads) than OIS rates, and they rose for several weeks in March 2020 due to financial strains related to the COVID-19 pandemic.3 Of course, banks' reliance on wholesale unsecured markets to fund illiquid assets and the resulting run on funding in those markets was one of the contributing factors to the 2007-2009 financial crisis. Post-crisis regulations requiring banks to have much higher levels of capital and more stable funding profiles are designed to ensure that banks could withstand these types of crises, without needing to resort to significant amounts of short-term wholesale borrowing in order to fund longer-term and less liquid assets. The more limited and short-lived increase in LIBOR in March 2020 may have been due to these reforms. One question is whether LIBOR would necessarily rise in every downturn.4 Because available OIS data only goes back a few years prior to the 2007-2009 crisis, it has not been possible to study how the LIBOR-OIS spread behaved in earlier recessions. However, fed funds futures data goes back to the early 1990s. Using the methodology outlined in Heitfield and Park (2019), we were able to construct proxy term OIS measures and calculate a three-month LIBOR-OIS spread for a longer period of time, as shown in Figure 1. Our proxy measure of the LIBOR-OIS spread did not rise during the 2001 recession. It did rise during the 1990-91 recession, but only for a short period of time and on average 20 basis points higher relative to the level before the recession.56
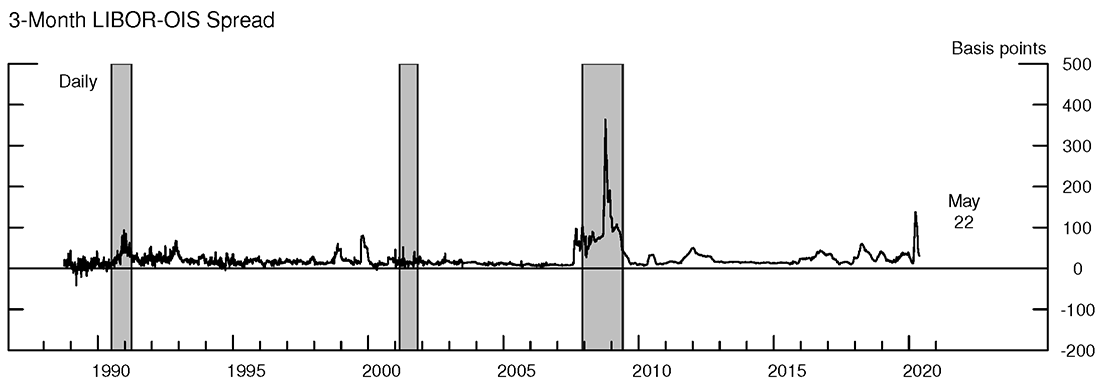
The shaded bars indicate periods of business recession as defined by the National Bureau of Economic Research: July 1990–March 1991, March 2001–November 2001, and December 2007–June 2009.
Source: Intercontinental Exchange via Haver Analytics, Refinitiv, Datascope Tick History, and authors' calculation.
Wholesale unsecured borrowing makes up an increasingly small part of U.S. banks' liabilities and, therefore, is a much smaller part of their cost of funding…
Banks and bank holding companies are required to file quarterly reports about their financial condition.7 These reports capture details about funding sources at period end. Aggregating across several different funding categories in these reports, we estimate short-term wholesale unsecured funding, the funding that LIBOR is meant to represent, as the combination of fed funds purchased, commercial paper, and large time deposits with remaining maturity of less than one year.8 This funding, as shown in Figure 2 by the orange area, has decreased since the financial crisis for both GSIB and non-GSIBs. In contrast, core deposits (in dark blue) have risen substantially; such deposits have historically been slower to react to interest rate movements.
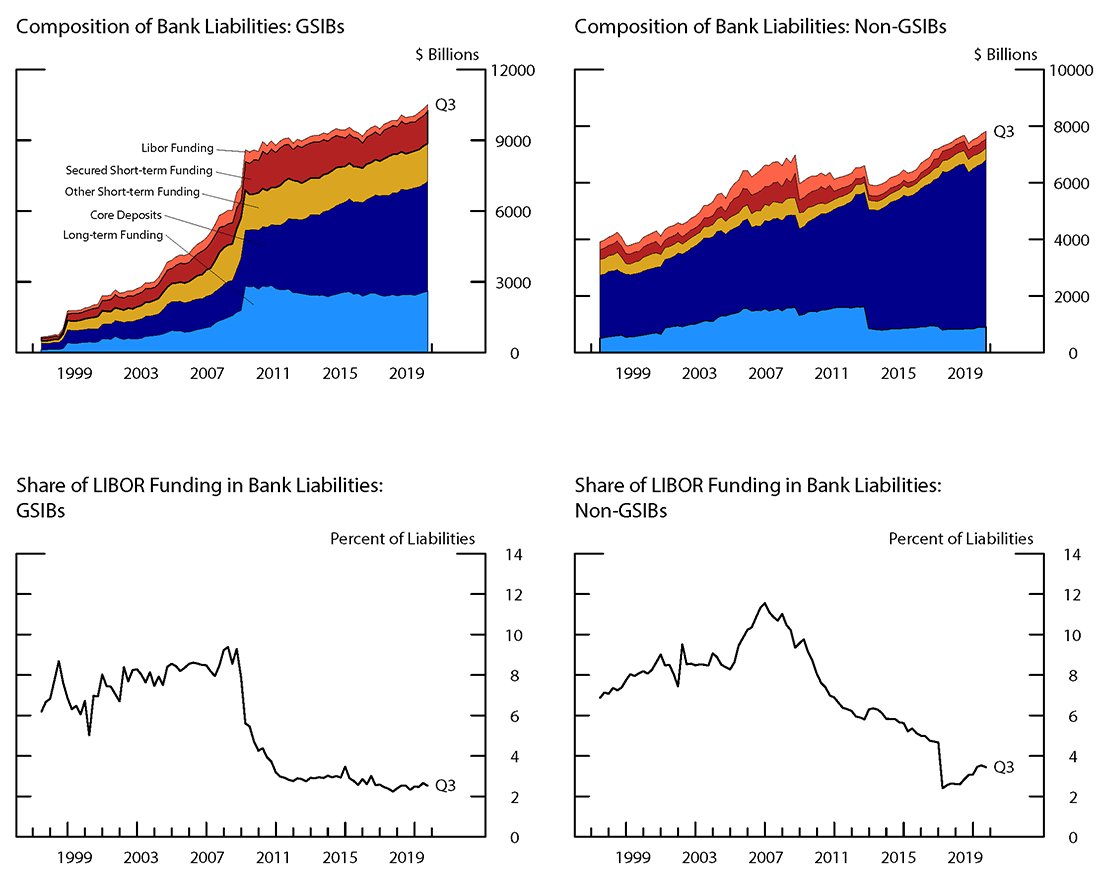
Note: LIBOR funding consists of large time deposits with remaining maturity of less than one year, fed funds purchased and commercial paper. Secured short-term funding is repo and trading liablities minus derivatives with negative fair value. Other short-term funding is foreign deposits and other borrowed money with maturity less than one year. All other liabilities are included in core deposits and long-term funding.
Source: FR-Y9C, Call Report.
Short-term wholesale unsecured funding as a share of liabilities is shown in the lower panels of the figure. As of 2019:Q3, less than 3 percent of GSIB liabilities consisted of such funding compared to an average of 8 percent during the years before the crisis and the first part of the crisis (2004:Q1-2008:Q4). Similarly, for non-GSIBs the decrease was from 9 percent to less than 4 percent. Some of this funding would be at shorter terms, either overnight borrowing or borrowing at maturities of less than a week, and the cost of this very short-term borrowing tends to move differently from rates like 1-month, 3-month, or longer maturities of LIBOR. Thus, the percentage of U.S. bank funding directly tied to wholesale unsecured borrowing at terms similar to the most widely used LIBOR tenors might be 2-3 percent.9 Using the same time period but using only information on commercial banks, short-term wholesale unsecured funding shows a very similar pattern (not shown). GSIB liabilities decreased from 10 percent to 4 percent, and for non-GSIBs the decrease was from 14 percent to 4 percent.
Some foreign banks rely much more heavily on offshore wholesale unsecured borrowing to fund dollar liabilities (International Monetary Fund 2019). Whereas our data provides detailed information about the consolidated assets and liabilities of U.S. banks, we have limited and less comparable information on foreign branches, especially given their offshore funding activity.
…and the banks' cost of funding does not have a higher correlation with LIBOR compared to other rates.
In the United States, a measure of overnight Treasury repo rates, SOFR, has been recommended as an alternative to U.S. dollar LIBOR. Averages of SOFR can be in financial contracts either "in advance" (calculated at the start of an interest period) or "in arrears" (calculated at the end of an interest period), and forward-looking term rates may be created based on SOFR futures markets.10 In this section, we use historical proxies for SOFR and our data on forward-looking term OIS rates imputed from fed fund futures to examine correlations with total bank funding costs.11
Table 1 shows that LIBOR is not more correlated with a measure of total bank funding costs than averages of SOFR or the term OIS rate, even during the crisis period. As shown, correlations change over time, and they are overall much lower after the crisis. However, in each period, either the 3-month effective federal funds rate (EFFR) to OIS or the 3-month SOFR in advance rates exhibit the highest correlations with banks' funding costs. Appendix Table A.1 displays a similar pattern when providing a further breakdown of the non-GSIB banks.
Table 1: Average Correlation with Changes in Bank Funding Costs, 5-year windows
| 3-Month LIBOR | 3-Month SOFR in Advance | 3-Month SOFR in Arrears | 3-Month EFFR OIS | |
|---|---|---|---|---|
| GSIBs | ||||
| Pre-crisis (2001:Q3-2006:Q2) | 0.89 | 0.82 | 0.87 | 0.90 |
| Crisis (2006:Q3-2011:Q2) | 0.58 | 0.69 | 0.35 | 0.61 |
| Post-crisis (2014:Q3-2019:Q2) | 0.58 | 0.47 | 0.71 | 0.73 |
| Non-GSIBs | ||||
| Pre-crisis (2001:Q3-2006:Q2) | 0.77 | 0.76 | 0.77 | 0.78 |
| Crisis (2006:Q3-2011:Q2) | 0.38 | 0.54 | 0.36 | 0.49 |
| Post-crisis (2014:Q3-2019:Q2) | 0.13 | 0.47 | 0.30 | 0.29 |
Note: Bolded number designates the rate with the highest correlation for a bank group-time period pair. Twenty-quarter (five-year) correlations are calculated at the bank level using total cost of funding and the designated market rate. Correlations are then averaged across banks in the group. The period 2011:Q3 to 2014:Q2 is not reported in the analysis to allow for equally long 5-year periods and to focus on the most recent period when the Federal Reserve's monetary policy target was predominantly above the effective lower bound. The total cost of funding equals total interest expense divided by bank liabilities. 3-month LIBOR, EFFR, and OIS rates are based on the first day of the quarter. SOFR in Advance is SOFR across the previous quarter. SOFR in Arrears uses the current quarter. See footnote 8 for details on historical SOFR.
Source: Call Report, FR Y-9C, Federal Reserve Bank of New York, ICE Benchmark Administration, Refinitiv, Datascope Tick History, and authors' calculation.
These results are qualitatively similar, whether we examine average correlations or volume-weighted correlations. The finding that a compound average of SOFR was more correlated to bank funding costs than LIBOR during the financial crisis holds for almost every bank in our sample. As shown in Figure 3, which plots the correlations of a compound average of SOFR in advance (the y-axis) and LIBOR (the x-axis) with bank funding cost for each bank, there are only a few banks for which LIBOR was somewhat more correlated than a compound average during the crisis. In the vast majority of cases, a compound average SOFR rate was notably more correlated with funding costs than LIBOR was.
We do not have complete data on banks' funding costs for the first quarter of 2020, but available data does show that the same dynamics that caused SOFR to be more correlated with overall bank funding cost in the 2007-2009 crisis have occurred recently. Issuance of financial commercial paper declined notably during March 2020 while overnight issuance increased, and core deposits held in banks, which pay rates far lower than LIBOR, rose by about $1.7 trillion dollars.
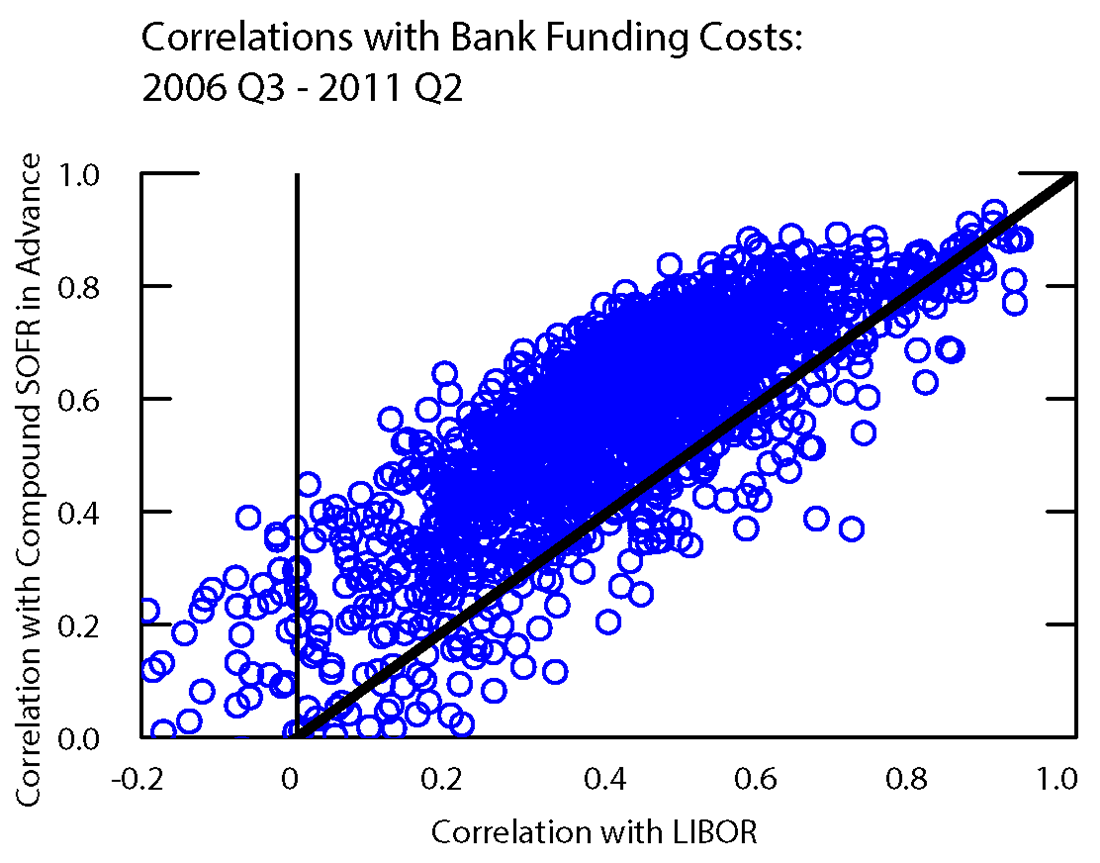
Note: Twenty-quarter (five-year) correlations are calculated at the bank level using total cost of funding and the designated market rate. The total cost of funding equals total interest expense divided by bank liabilities. 3-month LIBOR is based on the first day of the quarter. SOFR in Advance is SOFR across the previous quarter.
The diagonal black line indicates where the correlation with SOFR equals the correlation with LIBOR.
Source: Call Report, FR Y-9C, Federal Reserve Bank of New York, ICE Benchmark Administration and authors' calculation.
Banks could readily tie their LIBOR funding exposure to another rate.
Although U.S. banks' direct exposures to short-term wholesale unsecured funding appear to be about 2-4 percent of their overall liabilities, banks have also accumulated a number of other liabilities that they have chosen to tie to LIBOR, including:
- Issuance of senior or subordinated floating rate debt that pays LIBOR
- Federal Home Loan Bank (FHLB) advances based on LIBOR
- Issuance of non-agency mortgage or asset-backed securitizations whose payments are tied to LIBOR
- Issuance of preferred equity tied to LIBOR
- Derivatives liabilities incurred through issuance of fixed-rate debt that is then swapped to LIBOR
Using data from Bloomberg, we estimate that U.S. banks have $412 billion outstanding in senior or subordinated floating-rate debt that pays LIBOR. This debt has mostly been issued by large banks (those with $50 billion or more in assets), and represents 3 percent of liabilities, more than their combined borrowing in wholesale unsecured funding markets.
While smaller banks do not tend to issue debt, they do borrow through FHLB advances, which are an increasingly popular form of funding for non-GSIBs (Gissler and Narajabad 2018). As shown in Figure 4, commercial banks as a group have increased the dollar amount of FHLB funding by 57 percent since 2011. About 40 percent of advances have variable rates, of which about 60 percent were LIBOR-indexed as of 2019:Q3.12
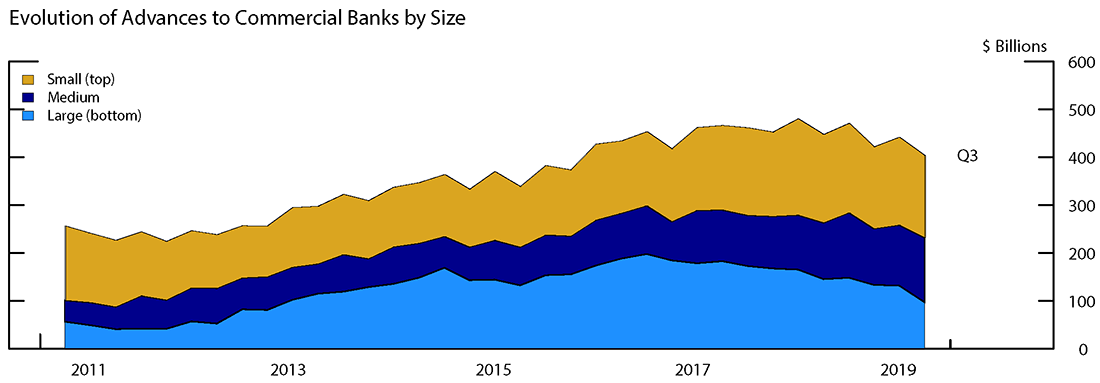
Note: Large banks are those with greater than $250 billion in assets. Medium banks are those with between $50 billion and $250 billion in assets. Small banks are those with less than $50 billion in assets.
Source: Call Report.
In addition, many banks have LIBOR exposure by issuing fixed-rate debt and then purchasing swap agreements to pay LIBOR rates, creating a synthetic rather than a fundamental LIBOR exposure. Though it is difficult to quantify such exposure, the prospectuses of all the major banks mention this practice.
Importantly, some or all of these liabilities could be based on other rates, including risk-free rates. For example, banks could borrow either at fixed rates or based on SOFR, and could swap fixed-rate debt issuances to SOFR rather than LIBOR. If banks did reduce these exposures to LIBOR, their remaining exposures to LIBOR-like markets would be a small fraction of their overall cost of funding.
Managing the remaining risks related to rate increases in unsecured funding markets should be commensurately easier if that occurred. Arguably, many banks should be in a better position to absorb the risks associated with their funding in this particular market than the consumers or businesses that would see their borrowing rates rise if loans are tied to a rate like LIBOR. For loans directly funded by wholesale unsecured markets, which should be relatively few, these risks could in principle be compensated by adding on a fixed margin.13 These changes would also mitigate consequences from episodes, of which we have seen three over the past five years, in which LIBOR increases 40-60 basis points relative to risk-free rates for reasons such as money-market reform or increased T-bill issuance that have had little relationship with U.S. bank funding costs.
To conclude…
We have shown that estimates of bank cost of funding are not more correlated with LIBOR than with other rates. Indeed, LIBOR has been less correlated with our measure of funding costs than available risk-free rates. While we recognize that banks have exposure to wholesale unsecured funding, their on-balance sheet liability exposures have decreased over the years, and their off-balance sheet and other liability exposures to LIBOR, which are larger, could be readily swapped to another interest rate, including a risk-free rate.
This is not to argue that banks' asset-liability management would not need to change if loans were based on risk-free rates rather than a rate like LIBOR. As discussed, loan margins would need to adjust to account for the differences between these types of rates, and banks would need to make other adjustments, for example by borrowing from FHLBs or swapping to risk-free rates rather than LIBOR. However, the results shown in this note indicate that, in terms of their liabilities and correlations with funding costs, these changes should be manageable.
References
Alternative Reference Rates Committee (2018). "Second Report of the Alternative Reference Rates Committee (PDF)", March 5, 2018.
Alternative Reference Rates Committee (2019). "A User's Guide to SOFR (PDF)", April 22, 2019.
Bowman, David (2019). "Historical Proxies for the Secured Overnight Financing Rate (PDF)", FEDS Notes. Washington: Board of Governors of the Federal Reserve System, July 15, 2019.
Heitfield, Erik and Yang-Ho Park (2019). "Inferring Term Rates from SOFR Futures Prices (PDF)", Finance and Economics Discussion Series 2019-014, Washington: Board of Governors of the Federal Reserve System.
International Monetary Fund (2019). "Chapter 5, Banks' Dollar Funding: A Source of Financial Vulnerability", in Global Financial Stability Report, October.
Gissler, Stefan and Borghan Narajabad (2018). "Supply of Private Safe Assets: Interplay of Shadow and Traditional Banks," available at SSRN: https://ssrn.com/abstract=3132058 or http://dx.doi.org/10.2139/ssrn.3132058.
Quarles, Randal K. (2019). "The Next Stage in the LIBOR Transition", speech delivered at the Alternative Reference Rates Committee Roundtable, New York, June 3, .
Schrimpf, Andreas and Vladyslav Sushko (2019). "Beyond LIBOR: A Primer on the New Benchmark Rates", BIS Quarterly Review, March, pp 29–52.
Appendix
Table A.1: Correlation with Changes in Bank Funding Costs
| 3-Month LIBOR | 3-Month SOFR in Advance | 3-Month SOFR in Arrears | 3-Month EFFR OIS | |
|---|---|---|---|---|
| Non-GSIBs: | ||||
| Large Domestic | ||||
| Pre-crisis (2001:Q3-2006:Q2) | 0.87 | 0.8 | 0.88 | 0.88 |
| Crisis (2006:Q3-2011:Q2) | 0.53 | 0.65 | 0.41 | 0.61 |
| Post-crisis (2014:Q3-2019:Q2) | 0.35 | 0.53 | 0.58 | 0.57 |
| Large Foreign | ||||
| Pre-crisis (2001:Q3-2006:Q2) | 0.93 | 0.84 | 0.92 | 0.93 |
| Crisis (2006:Q3-2011:Q2) | 0.52 | 0.72 | 0.53 | 0.66 |
| Post-crisis (2014:Q3-2019:Q2) | 0.45 | 0.47 | 0.58 | 0.59 |
| Small | ||||
| Pre-crisis (2001:Q3-2006:Q2) | 0.77 | 0.76 | 0.77 | 0.78 |
| Crisis (2006:Q3-2011:Q2) | 0.38 | 0.54 | 0.36 | 0.49 |
| Post-crisis (2014:Q3-2019:Q2) | 0.13 | 0.47 | 0.3 | 0.29 |
Note: Bolded number designates the rate with the highest correlation for a bank group-time period pair. Twenty-quarter (five-year) correlations are calculated at the bank level using total cost of funding and the designated market rate. Correlations are then averaged across banks in the group. The period 2011:Q3 to 2014:Q2 is not reported in the analysis to allow for equally long 5-year periods and to focus on the most recent period when the Federal Reserve's monetary policy target was predominantly above the effective lower bound. The total cost of funding equals total interest expense divided by bank liabilities. 3-month LIBOR, EFFR, and OIS rates are based on the first day of the quarter. SOFR in Advance is SOFR across the previous quarter. SOFR in Arrears uses the current quarter. See footnote 8 for details on historical SOFR. Large banks are those with greater than $50 billion in assets. Large foreign banks are domestically chartered banks but owned by an institution in another country. Small banks are those with less than $50 billion in assets.
Source: Call Report, FR Y-9C, Federal Reserve Bank of New York, ICE Benchmark Administration, Refinitiv, Datascope Tick History, and authors' calculation.
1. We thank Kevin Kiernan for excellent research assistance. Return to text
2. LIBOR is produced by ICE Benchmark Administration. LIBOR is scheduled to end by 2022 and is a widely used benchmark for short-term rates. For example, U.S. dollar LIBOR is estimated to be referenced in $200 trillion of financial contracts (Alternative Reference Rates Committee, 2018). Return to text
3. OIS rates reflect market expectations of the effective federal funds rate targeted by the Federal Reserve. LIBOR spreads are typically measured relative to OIS because these rates are unaffected by other factors, such as safe-harbor flows that can affect Treasury-bill rates. Return to text
4. Quarles (2019) notes that the scenarios used in the Federal Reserve's annual stress tests do not assume that LIBOR will widen relative to short-term Treasury rates in the severe economic stress scenarios and that the adoption of SOFR would not materially change the results of the stress tests compared to LIBOR. Return to text
5. Prior to 2000, the volatility in daily changes of 3-month LIBOR was about twice as high as it has been over the past two decades, leading to more daily volatility in the LIBOR-OIS spreads shown in Figure 1. Return to text
6. Our measure of the LIBOR-OIS spread did not rise during the Asian financial crisis or during the Russian crisis and bailout of Long-Term Capital Management in August-September 1998, although it did briefly rise subsequently later in 1998. Return to text
7. Form FR Y-9C is filed by bank holding companies (BHCs) with more than $3 billion in consolidated assets, and Call Reports are filed by all commercial banks (form FFIEC 031 and 041). This note uses data from both reports to measure the entire banking industry. Call Reports are used to obtain information on commercial banks that are not under a BHC that files an FR Y-9C form. Return to text
8. Given that large time deposits are not insured, such depositors are more sensitive to the credit risk of the bank and will demand an interest rate that captures such risk. Prior to 2002, the reporting of fed funds purchased was combined with securities sold under agreement to repurchase (repo). Because repo consists of 80 percent or more of the combination of fed funds and repo since the time of the split, the combined category is treated as repo prior to 2002. Return to text
9. At least $175 billion of unsecured bank wholesale borrowing is currently overnight, based on volumes in fed funds and Eurodollar markets reported in data on the Overnight Bank Funding Rate produced by the Federal Reserve Bank of New York, and about 90 percent of financial commercial paper issuance is at maturities of 2 weeks or less according to data from the Federal Reserve Board. Return to text
10. The Alternative Reference Rates Committee describes SOFR and its uses in A User's Guide to SOFR (2019). Return to text
11. Bank funding cost is defined as a bank's effective funding rate (annualized total interest expense/total liabilities) calculated from Call Reports and form FR Y-9C. Details on the historical proxies for SOFR can be found in Bowman (2009). The Federal Reserve Bank of New York (FRBNY) began publishing SOFR on April 3, 2018. FRBNY also released data from August 2014 to March 2018 representing estimates of SOFR based on the same transactions and methodology that underlie the official publication. Data going back to 1998 is based on the FRBNY primary dealers' overnight Treasury GC repo borrowing activity from the primary dealer survey. Return to text
12 FHLBs reported in their 2019:Q3 financial statement that $149 out of $246 billion variable rate advances are indexed to LIBOR. See http://fhlb-of.com/ofweb_userWeb/resources/2019Q3CFR.pdf. Return to text
13. Incorporating a floor in a SOFR loan could also help to mitigate any mismatch. Return to text
Bowman, David, Chiara Scotti, and Cindy M. Vojtech (2020). "How Correlated is LIBOR with Bank Funding Costs?," FEDS Notes. Washington: Board of Governors of the Federal Reserve System, June 29, 2020, https://doi.org/10.17016/2380-7172.2539.
Disclaimer: FEDS Notes are articles in which Board staff offer their own views and present analysis on a range of topics in economics and finance. These articles are shorter and less technically oriented than FEDS Working Papers and IFDP papers.