FEDS Notes
April 12, 2024
Is This Time Different: How Are Banks Performing during the Recent Interest Rate Increases Compared to 2004-2006?
Anya Kleymenova, Lori Leu, and Cindy M. Vojtech1
Note: On June 18, 2024, an update was made to correct the spelling of Nafij Ahmed’s name.
Introduction
In 2022, the Federal Reserve began its latest monetary tightening cycle. Increases in interest rates are generally favorable for commercial bank net interest income (interest income minus interest expense). This relationship holds because many loan types have adjustable rates, and banks do not pass through all interest rate increases to depositors. In this note, we investigate the response of the largest U.S. banks to the changing interest rate environment and compare their responses to the recent tightening cycle relative to prior cycles.
Figure 1 shows the path of the federal funds effective rate for the three most recent increasing rate cycles. The 2022–2023 cycle (henceforth the 2022 cycle) is notably larger in the change of the rate, and the increases have occurred over a shorter time horizon. As a result, it may have been harder for banks to adjust to the changing rate environment. For example, banks may have extended the duration of their assets during the relatively low-rate and long low-inflation period prior to 2022. In addition, there was deposit pricing pressure at some banks in 2023. In our analyses, we compare the current large bank performance to that of the 2004–2006 up-rate cycle (henceforth 2004 the cycle), using 2004:Q2 to 2006:Q2 and 2021:Q4 to 2023:Q3 as our defined periods of interest.
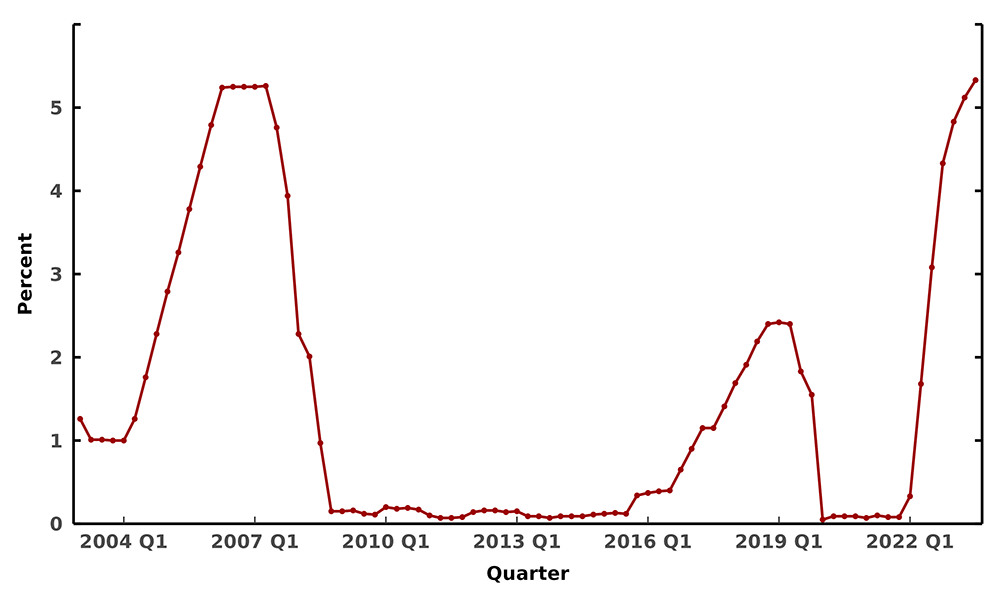
Source: Board of Governors of the Federal Reserve System (https://fred.stlouisfed.org/series/FEDFUNDS).
Our work corroborates and extends Ahmed, Miranda, and Patel (2023) who study the banking sector performance across the 2004 and 2022 cycles at the commercial bank level. In this note, we take a closer look at trends in the largest banks, capturing performance for the entire banking organization (commercial bank and non-commercial banking activities). We analyze trends in the decomposition of banks' assets and liabilities, as well as interest rate pass-through in yields and costs. Overall, we find that large banks have increased the profitability of their interest rate-sensitive operations. In aggregate, asset yields have increased more than funding costs, and loan growth has been robust. In addition, the pass-through for deposit rates in the current cycle has been more muted in the aggregate, while the pass-through at the bank level became more heterogenous. For some non-deposit categories, namely other borrowed money (OBM) and trading liabilities, the pass-through rate has been much higher in the 2022 cycle.
Data Description
We use FR Y-9C data that account for bank mergers. These data are reported at the bank holding company level and have been used in prior studies (see for example, Hirtle et al. (2016)). For ease of reference, we refer to all financial institutions in our sample as "banks." To capture the recent interest rate increases, the panel data are narrowed to the period between 2003:Q1 and 2023:Q3. Additionally, this note focuses on the largest banks that operate in a similar operating and regulatory environment. To that end, the data are limited to the large banks that are subject to the Federal Reserve System stress tests. Not all banks are in the sample for the entire period. Notably, Capital One enters this sample in 2004:Q4; Ally, American Express, Discover, Morgan Stanley, and Goldman Sachs enter the sample in 2009:Q1; and Charles Schwab enters in 2012:Q1. We exclude foreign banks that enter the FR Y-9C panel in 2016 or later.2 The final panel contains 27 banks representing 78 percent of assets in the FR Y-9C data as of December 31, 2022.
Earnings Performance
We measure bank performance by focusing on the net interest margin (NIM), which summarizes the earnings performance of a bank, with earnings being generated specifically by the interest-rate sensitive lines of business. NIM is defined as follows:
$$$$ NIM = \frac{\text{interest income - interest expense}}{\text{average interest-earning assets}} $$$$
The first panel in figure 2 shows aggregate NIM for the sample. Because NIM is an important source of profitability, banks manage NIM through hedging and balance sheet management. This management generally stabilizes NIM, but there was downward pressure during the low-rate periods preceding the recent rate increases. As this note shows, the compressed NIM during the COVID-19 pandemic was primarily driven by low rates and an influx of deposits for which banks had few high-earning investment options.3
The second panel of figure 2 presents NIM by bank group and shows large variation in NIM across those groups. For example, credit card banks have much higher NIM, while investment banks and custody banks tend to have lower NIM. To better understand the drivers of NIM, we next examine sources of interest income and interest expense separately.
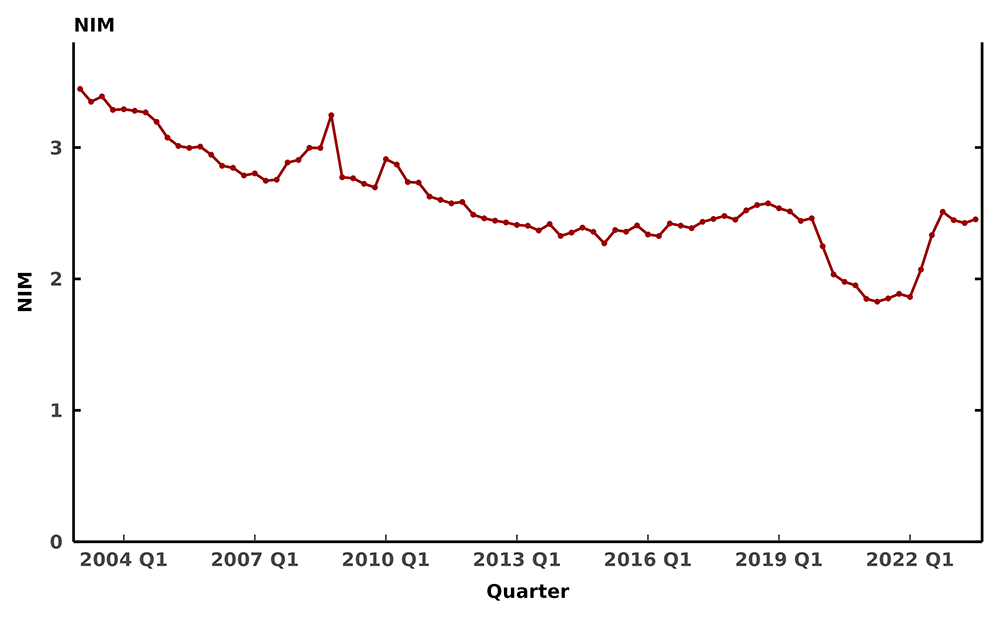
Note: The spike in 2009 is driven by new entrants (Ally, Morgan Stanley, Goldman Sachs, American Express, and Discover). Data are not seasonally adjusted.
Source: FR Y-9C, Call Reports, and internal calculations.
Figure 2b. NIM by Bank Group
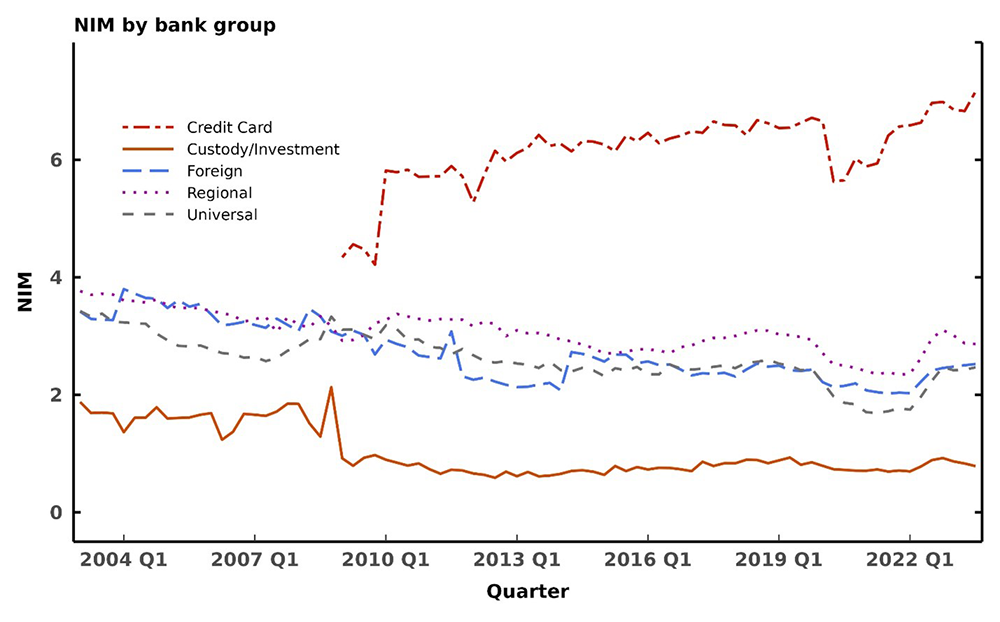
Note: Bank groups are defined in the Appendix. Data are not seasonally adjusted.
Source: FR Y-9C, Call Reports, and internal calculations.
Interest Income
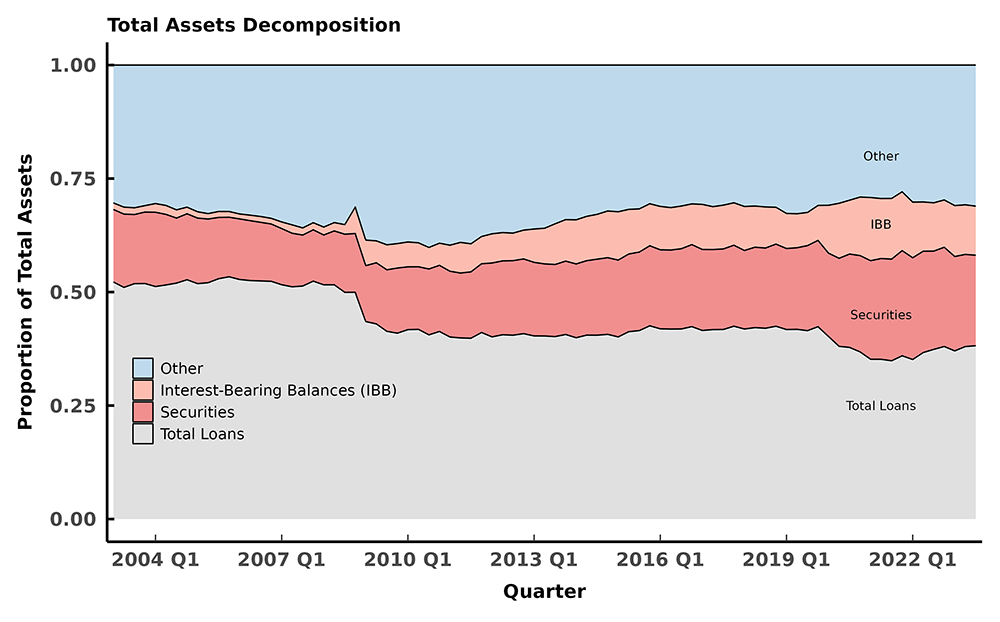
Interest income is generated by a bank's interest-earning assets. We split bank assets into four main categories: loans, securities, interest-bearing balances (cash equivalents, IBB), and other assets (which include primarily repurchase agreements but also have non-earning assets such as property and equipment). Figure 3 shows the dollar levels of assets in the first panel and the composition shares in the second panel. During the 2004 interest rate cycle, securities as a proportion of total assets shrank from 16 percent to 13 percent, and in the 2022 cycle they decreased from 23 percent to 20 percent. These changes are consistent with banks shifting to higher yielding assets as rates increase. Most securities held by banks are U.S. Treasury securities and mortgage-backed securities (MBS), which are generally fixed-rate. However, many loan types, particularly business and commercial real estate loans, have variable interest rates. In the 2004 cycle, loans as a proportion of total assets grew from 51 percent to 52 percent, and in the 2022 cycle, they grew from 36 percent to 38 percent. Overall, loans are growing faster in the 2022 cycle, increasing 2 percent in one and a half years compared to 1 percent in two years.
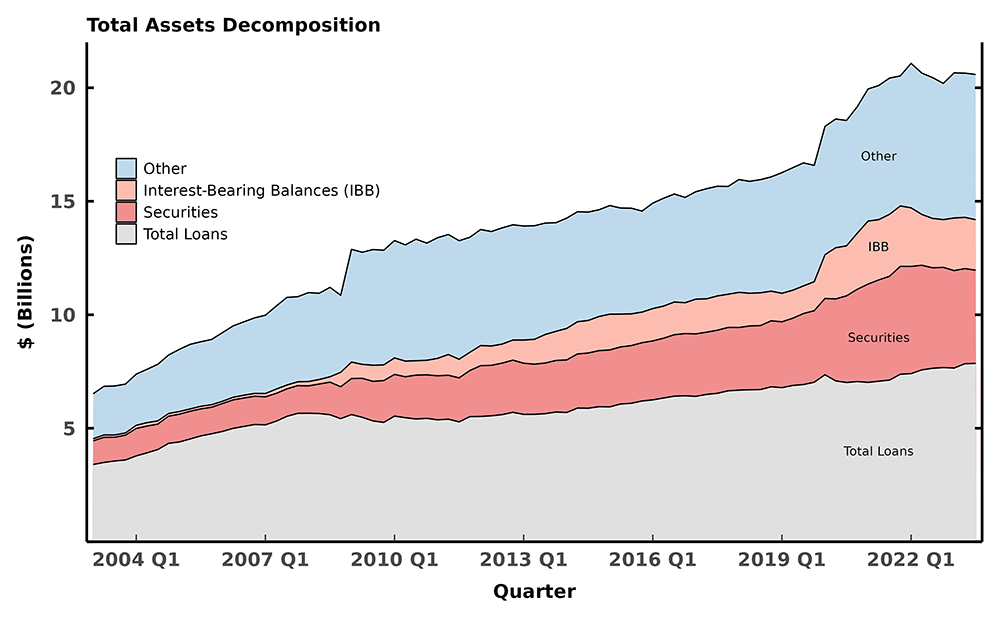
Source: FR Y-9C, Call Reports, and internal calculations.
Figure 3b. Total Assets Decomposition (proportion)
Source: FR Y-9C, Call Reports, and internal calculations.
The asset composition of the large banks at the beginning of the two periods of rate increases is much different, likely driven by the different regulatory and monetary policy environments. Large banks had a much higher share of securities at the start of the 2022 cycle. This overall increase in securities holdings is partially explained by the adoption of the liquidity coverage ratio (LCR) which mandates banks to hold more high-quality liquid assets (HQLAs). The higher share of interest-bearing balances is related to the Federal Reserve's use of large-scale asset purchases (LSAPs) in response to both the 2007–2009 financial crisis and the COVID-19 pandemic. The Federal Reserve's security purchases are funded by bank reserves, which are interest-bearing deposits credited to banks.
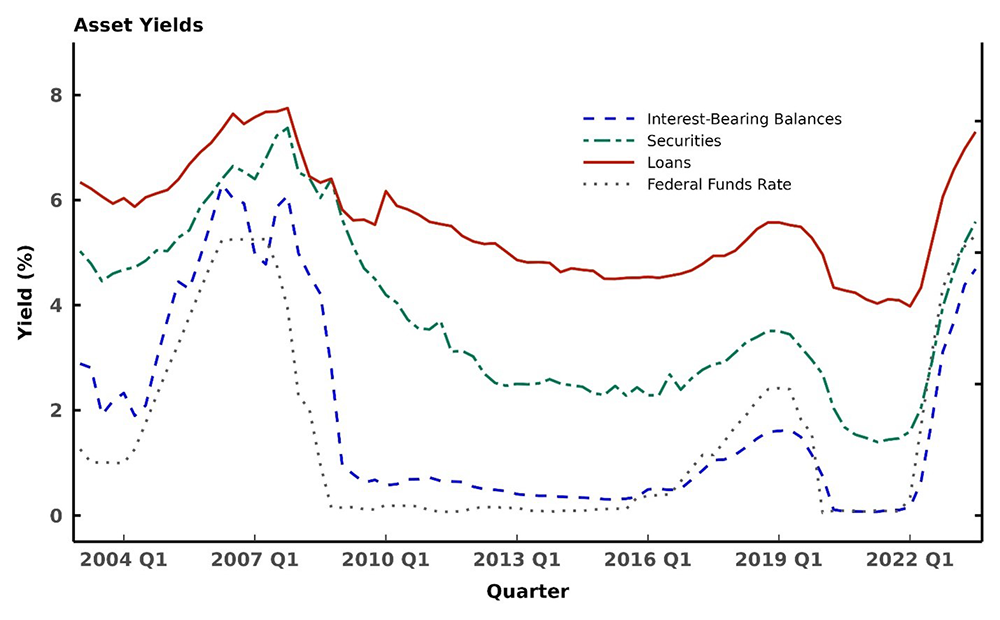
Figure 4 plots the interest rate yields for the three asset types as well as the federal funds effective rate. Because rates are increasing more quickly in the 2022 cycle, the asset yields are also increasing faster than in prior rate cycles. As expected, the rate on interest-bearing balances increases with the federal funds effective rate because reserves (bank deposits at the Federal Reserve) earn an interest rate near the top of the federal funds target range. Even though most securities held by banks have fixed interest rates, there is a large increase in the securities yield during the 2022 cycle. This increase suggests that banks adopted hedge positions to support profitability. Table 1 compares the change in rates across the asset categories and rate cycles. For both cycles, the pass-through of interest rates is the lowest for loans and highest for interest-bearing balances.
Source: FR Y-9C, Call Reports, Board of Governors of the Federal Reserve System (federal funds rate), and internal calculations.
Table 1: Change in Yields for Assets
| Table 1 | ||
| Change in yield (percentage points) | 2004:Q2 – 2006:Q2 | 2021:Q4 – 2023:Q3 |
|---|---|---|
| Interest-bearing Balances | 1.9 – 6.2 = 4.3 | 0.1 – 4.7 =4.6 |
| Securities | 4.7 – 6.4 = 1.7 | 1.5 – 5.6 = 4.1 |
| Loans | 5.9 – 7.4 = 1.5 | 4.1 – 7.3 = 3.2 |
| Federal Funds Effective Rate | 1.26 – 5.25 = 3.99 | 0.08 – 5.33 = 5.25 |
Interest Expense
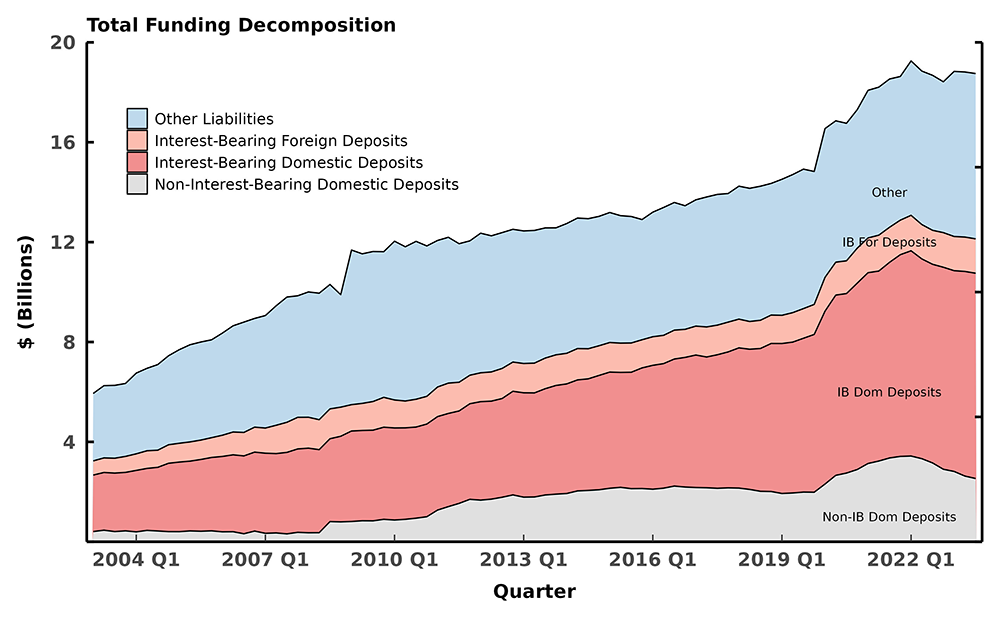
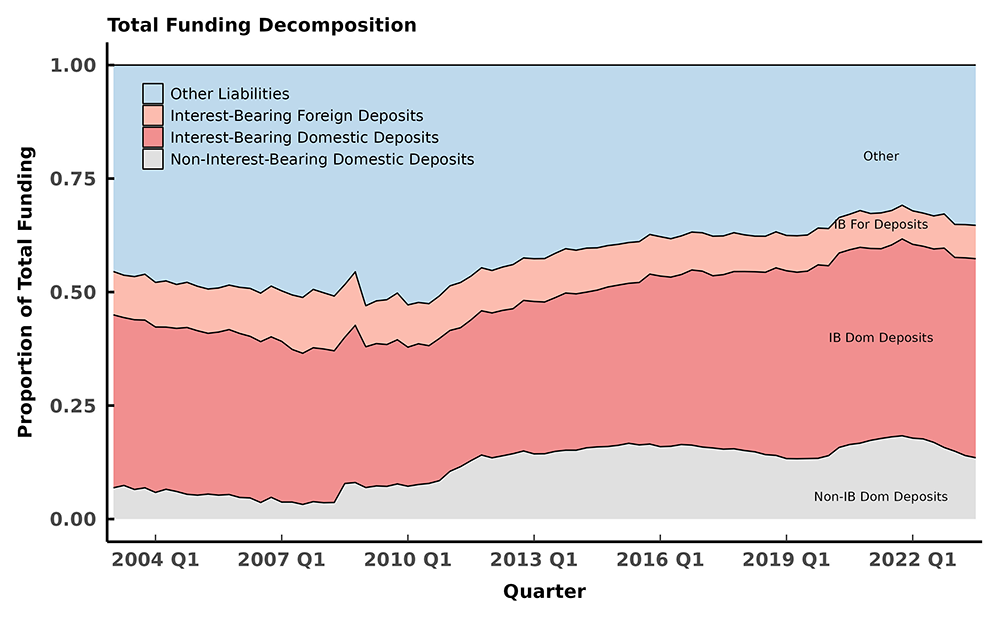
We split liabilities into four categories: noninterest-bearing domestic deposits, interest-bearing domestic deposits, interest-bearing foreign deposits, and other liabilities (primarily consisting of Federal Home Loan Bank (FHLB) advances and OBM). Figure 5 shows the dollar levels of liabilities in the first panel and the composition shares in the second panel. During the 2022 cycle, there is a decline in total liabilities driven by a decline in noninterest-bearing deposits. This shift was slower during the 2004 cycle, likely due to the size and speed of the interest rate increases and due to savers seeking returns that better kept pace with inflation. Ahmed, Miranda, and Patel (2023) note a shift from noninterest-bearing deposits to interest-bearing deposits, but we do not document a similar pattern when only considering the stress tested banks in our data. In the 2004 cycle, the proportion of funding accounted for by interest-bearing domestic deposits was stable at around 36 percent, while in the 2022 cycle, this proportion rose from 42 percent to 44 percent. The change in the composition of funding is mainly driven by noninterest-bearing domestic deposits: as a proportion of funding, these deposits declined from 11 percent to 10 percent in the 2004 cycle and from 18 percent to 14 percent in the 2022 cycle.
Source: FR Y-9C, Call Reports, and internal calculations.
Figure 5b. Total Funding Decomposition (proportion)
Source: FR Y-9C, Call Reports, and internal calculations.
Figure 6 plots the interest rate costs for the three liability types as well as the federal funds effective rate. As is common during rate increases, the pass-through to deposits is much lower. Domestic deposits generally experience the least amount of interest rate increases. There is also a delay between the first federal funds rate increase and any noticeable increase in the aggregate domestic deposit rate. The interest rate pass-through for OBM and trading liabilities is much faster, suggesting that most of these funding sources are variable rate and reprice with the market. Table 2 compares the change in rates across the funding categories and rate cycles and shows that the pass-through patterns are much more different across the cycles for funding. In particular, the pass-through for deposit rates in the current cycle has been more muted, while the pass-through of OBM and trading liabilities has been higher.
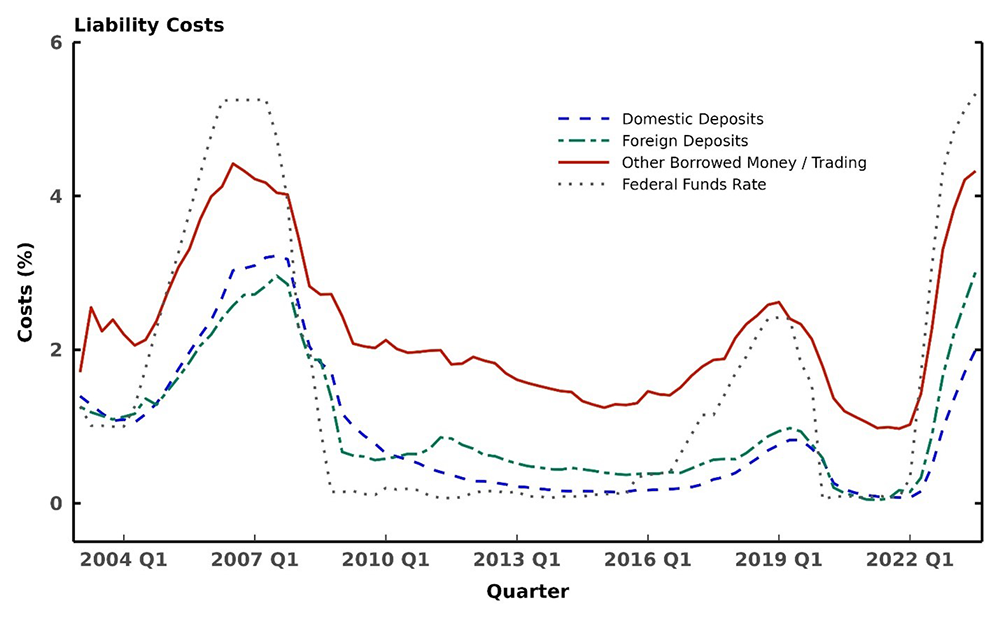
Source: FR Y-9C, Call Reports, Board of Governors of the Federal Reserve System (federal funds rate), and internal calculations.
Table 2: Change in Costs for Liabilities
| Table 2 | ||
| Change in rate (percentage points) | 2004:Q2 – 2006:Q2 | 2021:Q4 – 2023:Q3 |
|---|---|---|
| Domestic Deposits | 1.1 – 2.7 = 1.6 | 0.1 – 2.0 = 1.9 |
| Foreign Deposits | 1.2 – 2.4 = 1.2 | 0.1 – 3.0 = 2.9 |
| OBM/Trading | 2.2 – 4.1 = 1.9 | 1.0 – 4.3 = 3.3 |
| Federal Funds Effective Rate | 1.26 – 5.25 = 3.99 | 0.08 – 5.33 = 5.25 |
Another way to explore interest rate pass-through is to look at deposit betas, where deposit beta is defined as the change in the interest rate on deposits divided by the change in the federal funds effective rate. Figure 7 compares deposit betas for the two rate cycles at the bank level. The distribution disperses between the 2004 and 2022 cycles: there is more heterogeneity in the 2022 cycle. Combining these results with the aggregate costs summarized in table 2, we can conclude that larger banks in the sample have lower betas in the 2022 cycle. Figure 8 compares the OBM/Trading betas across the two rate cycles. Here, there is a clear shift of the distribution to the right between the two rate cycles. This matches the aggregate measures of cost reported in table 2.
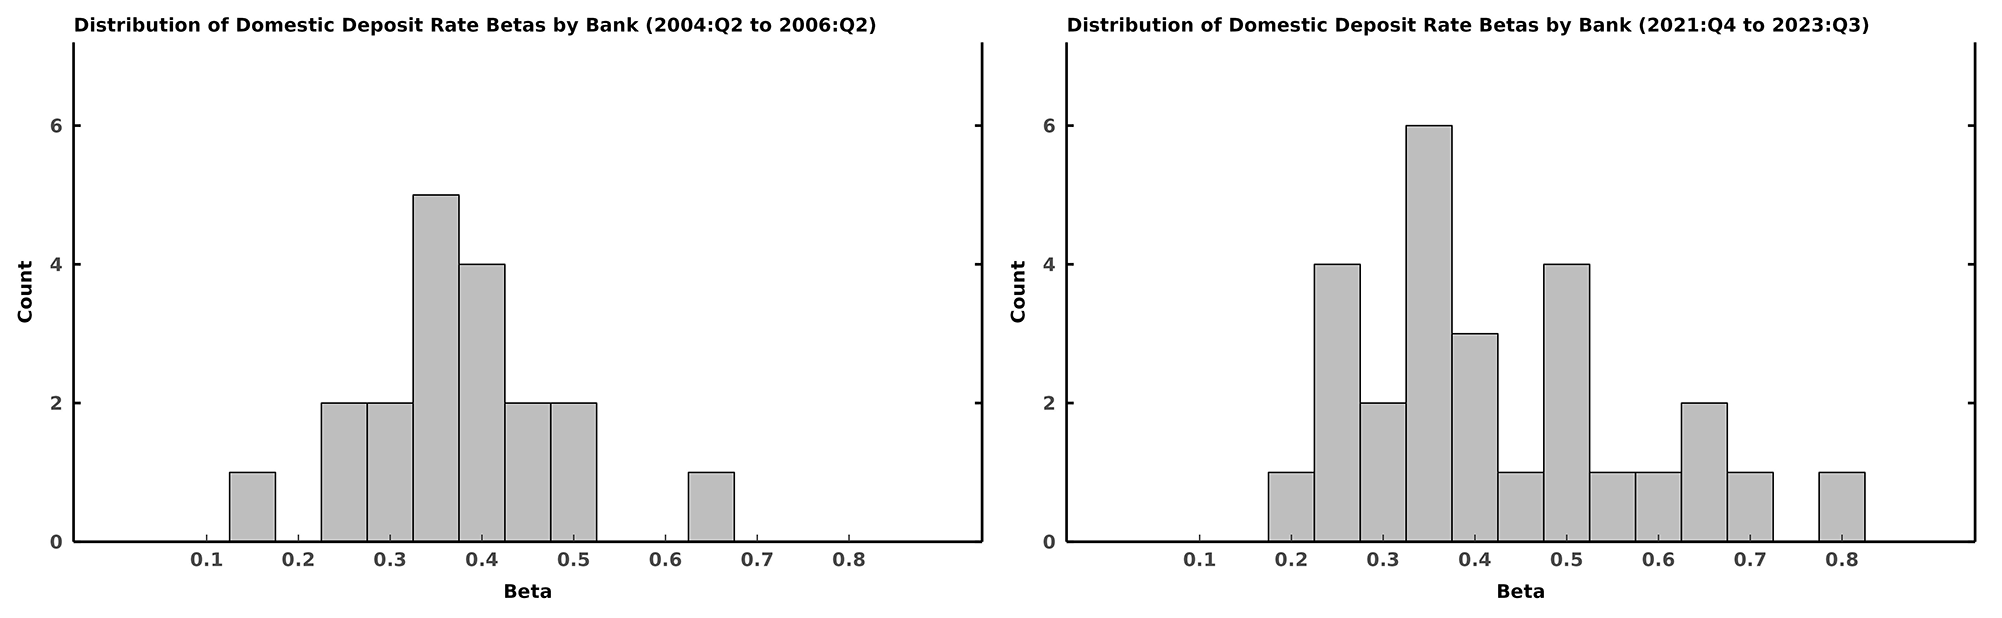
Source: FR Y-9C, Call Reports, Board of Governors of the Federal Reserve System (federal funds rate), and internal calculations.
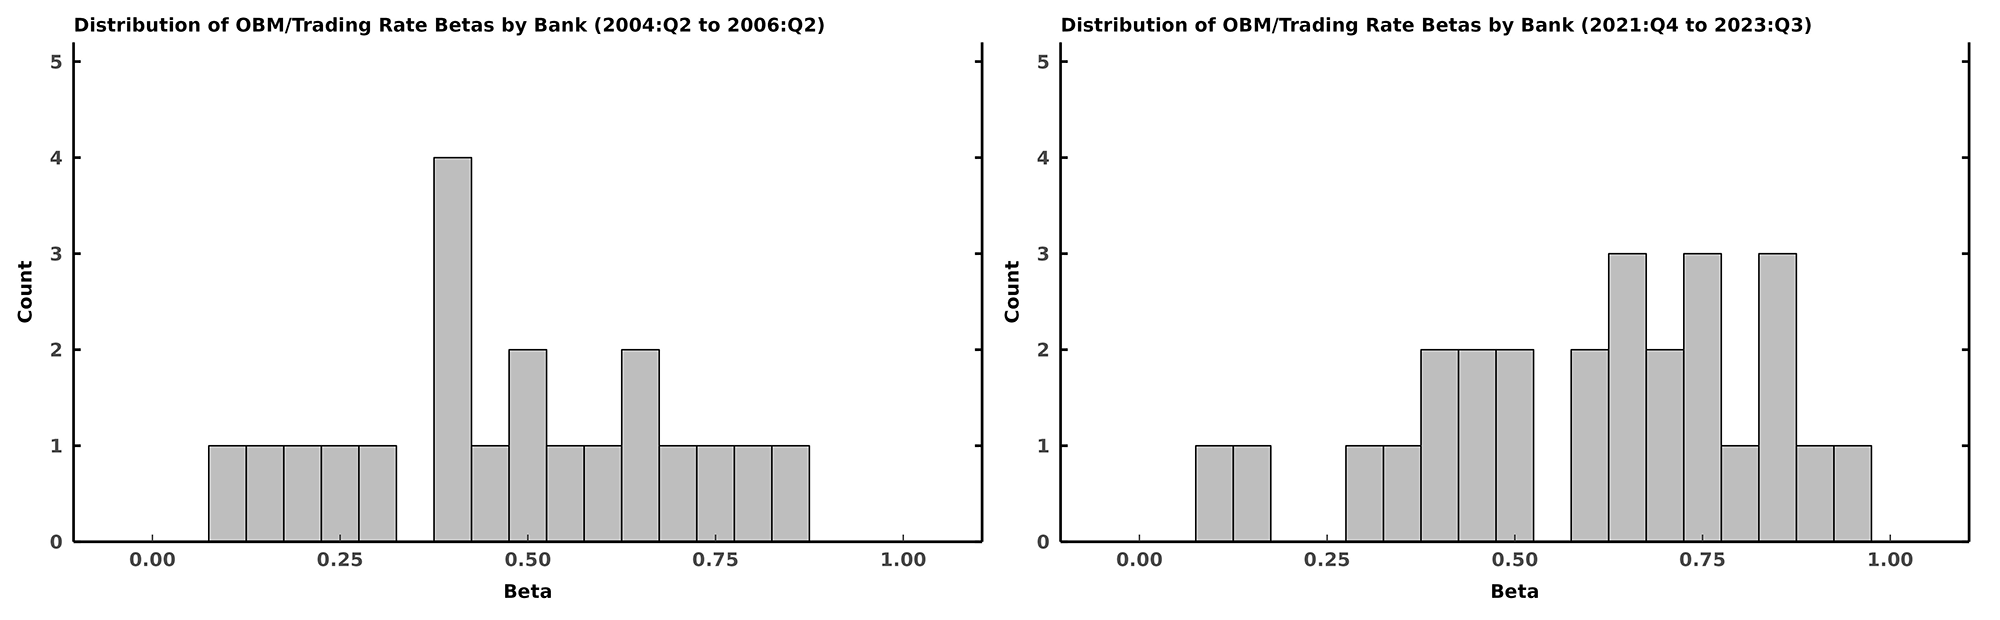
Source: FR Y-9C, Call Reports, Board of Governors of the Federal Reserve System (federal funds rate), and internal calculations.
Conclusion
Overall, large banks have increased the profitability of their interest rate-sensitive operations in the recent rising interest rate environment. In aggregate, asset yields have increased more than funding costs, and loan growth has been robust. Compared to the 2004 cycle, the interest rate pass-through for funding has been different. In particular, the pass-through for deposit rates in the current cycle has been more muted in the aggregate, while the pass-through at the bank level became more heterogenous. For some non-deposit categories, namely OBM and trading liabilities, the pass-through rate has been much higher in the 2022 cycle.
References
Ahmed, N., Miranda, D., and Patel, K. (2023). Banking Sector Performance During Two Periods of Sharply Higher Interest Rates. FDIC Quarterly, Volume 17, Number 3.
Hirtle, B., Kovner, A., Vickery, J., and Bhanot, M. (2016). Assessing financial stability: the Capital and Loss Assessment under Stress Scenarios (CLASS) model. Journal of Banking and Finance, 69, S35-S55.
Appendix
Bank group definitions:
- Credit Card: Capital One (2004:Q4), American Express (2009:Q1), Discover (2009:Q1)
- Custody/Investment: State Street, Northern Trust, BONY Mellon, Morgan Stanley (2009:Q1), Goldman Sachs (2009:Q1)
- Foreign: TD Bank, Santander, BMO, HSBC
- Regionals: M&T, US Bancorp, Citizens, Keycorp, Huntington, PNC, Fifth Third, Truist, Regions, Ally (2009:Q1), Charles Schwab (2012:Q1)
- Universals: JP Morgan Chase, Bank of America, Wells Fargo, Citigroup
- Excluded banks: Credit Suisse, DWS USA, MUFG, BNP Paribas, Deutsche Bank, UBS, Barclays, and RBC.
Other data and calculation notes:
- All balance sheet variables used in denominators of ratios are calculated as a two-quarter average.
- Securities include held-to-maturity and available-for-sale.
1. We thank Jose Berrospide, Patrick deFontnouvelle, Ronel Elul, Nika Lazaryan, and Myya McGregory for their helpful comments and discussions. We thank Fulvia Fringuellotti, Nika Lazaryan, Myya McGregory, and Patrick Sewell for their help with the merger-adjusted data. The views expressed in this note are those of the authors and do not necessarily reflect the views of the Federal Reserve Board or the Federal Reserve System. Return to text
2. Foreign banks with over $50 billion in non-branch assets were required to create intermediate holding companies (IHCs) in 2016. These banks are excluded from our analyses because they are not in the data for a long time series, and they generally have business operations that differ from the traditional banking services of taking deposits and making loans. Return to text
3. In the Senior Loan Officer Survey (SLOOS), banks reported weaker demand across several loan categories for the period between 2020:Q2 and 2020:Q4. The increase in deposits is documented later in this note. See the SLOOS results website for more information: https://www.federalreserve.gov/data/sloos.htm. Return to text
Kleymenova, Anya, Lori Leu, and Cindy M. Vojtech (2024). "Is This Time Different: How Are Banks Performing during the Recent Interest Rate Increases Compared to 2004-2006?," FEDS Notes. Washington: Board of Governors of the Federal Reserve System, April 12, 2024, https://doi.org/10.17016/2380-7172.3466.
Disclaimer: FEDS Notes are articles in which Board staff offer their own views and present analysis on a range of topics in economics and finance. These articles are shorter and less technically oriented than FEDS Working Papers and IFDP papers.