FEDS Notes
July 15, 2019
Long-Run Effects on Chinese GDP from U.S.-China Tariff Hikes
John K. Ferraro and Eva Van Leemput*
1. Introduction
Since the beginning of 2018, the United States and China have increased tariff rates on each other's imports, contributing to fears of a global downturn. In the near-to-medium term, there are several channels through which increased tariffs and continued uncertainty could affect global growth. First, higher tariffs are equivalent to a tax increase, with negative effects on consumption and investment. Second, given China's important role in global value chains, an increase in bilateral tariffs could disrupt supply chains, with significant negative effects on output. Third, increased uncertainty could dampen GDP if firms delay investment and hiring. Finally, the same forces could negatively affect sentiment and roil international financial markets. Outside of these immediate though eventually temporary effects, a persistent increase in tariffs would likely negatively affect the long-run productive capacity of the economy. Higher tariffs could slow the accumulation of capital, shift resources into less productive sectors, reduce the extent of competition, or interfere with the dissemination of technological advances.
In this note, we employ a particular model of trade policy effects following Caliendo and Parro (2015) that focuses on the role of tariffs in spurring adverse resource reallocations. Higher U.S. tariffs on imports from China raise the price of those goods, increasing the production cost for U.S. firms as intermediate inputs become more expensive, thus lowering U.S. productivity and GDP. In China, tariffs decrease demand for those products for which China is most productive, pushing resources into less productive sectors and lowering overall GDP. While the primary focus of our note is to quantify the long-run effects of permanent increases in U.S.-China import tariffs on Chinese GDP, our model also provides an estimate of the effect on U.S. GDP, as well as third-party effects on countries not directly involved in the tariff increases.
Our trade model suggests that the direct long-run impact of the currently implemented tariffs on Chinese output is likely to be small, effectively reducing the level of real GDP by 0.25 percent. Further, the model estimates that if the United States were to hike tariffs an additional 25 percentage points on the remainder of imports from China, Chinese GDP would fall by a modest 0.39 percent. All told, these results suggests a limited long-run imprint from a further significant increase in tariffs by the United States and China. That said, these are long-run impacts under the assumption of full employment and therefore do not capture the impact of any transient factors described above. In addition, the model does not capture a wide range of other indirect effects, such as associated decreases in investment or reduced innovation stemming from less competition. As such, we view these estimates as a likely lower bound.
2. Trade Policy Developments between the United States and China
Table 1 presents the tariff hikes by the United States and China since the beginning of 2018. Panel A shows the implemented tariffs and Panel B shows the proposed tariffs. Columns (1) through (3) present the U.S. trade policy actions and columns (4) through (6) present China's actions.
The first trade policy action by the United States was the approval of a 28-percent tariff increase on all imported solar panels and washing machines (line 1) after manufacturers in those industries filed petitions for more protection against foreign competition. The tariff took effect in January 2018 and affected all U.S. trading partners (not shown), including China (column (3)).
The second announcement came in March 2018 after an investigation by the U.S. Secretary of Commerce concluded that foreign countries' trade practices with the U.S. posed a threat to U.S. national security. Consequently, under Section 232 of the Trade Expansion Act of 1962, President Trump signed an executive order to impose a 25- and 10-percent tariff hike on steel and aluminum imports, respectively (line 2). While some countries received an extension, the tariffs went into effect for China on March 23 on an estimated $3 billion of imports. China in turn imposed a 15- to 25-percent tariff hike on $3 billion of U.S. goods, including pork, nuts, fruits, and scrap aluminum.
Table 1: Timeline of Trade Policies since January 2018
| United States | China | |||||
|---|---|---|---|---|---|---|
| Date | Tariff hike (ppt.) | Imports from China affected ($ in billions) | Date | Tariff hike (ppt.) | Imports from U.S. affected ($ in billions) | |
| (1) | (2) | (3) | (4) | (5) | (6) | |
| A. Implemented | ||||||
| 1. Solar & washing mach. | 1/22/2018 | 28 | 1.4 | - | - | |
| 2. Steel & aluminum | 3/23/2018 | 25 & 10 | 3.2 | 4/2/2018 | 15-25 | 3 |
| 3. Sec. 301; $50bn (part 1) | 7/6/2018 | 25 | 34 | 7/6/2018 | 25 | 34 |
| Sec. 301; $50bn (part 2) | 8/23/2018 | 25 | 16 | 8/23/2018 | 25 | 16 |
| 4. Sec. 301; $180bn | 9/24/2018 | 10 | 180 | 9/24/2018 | 5-10 | 60 |
| 5. Sec. 301; $180bn* | 5/10/2019 | 15 | 180 | 6/1/2019 | 5-15 | 60 |
| Total (1-5) | 24.9** | 234.6 | 19.6** | 113 | ||
| B. Proposed | ||||||
| 6. Remaining $275bn | - | 25 | 275 | - | 25*** | 17 |
| Total (1-6) | 24.9** | 509.6 | 20.3** | 130 | ||
Note: The tariff hikes are denoted in percentage points (ppt).
* These actions represent additional tariffs on the same imports as in those in line 4
** These tariff rates display the weighted average tariff hike across all affected goods.
*** We assume a 25 percent tariff hike for the sake of exposition as no official tariff rate has been announced.
The third development also occurred in March. Following a year-long Section 301 investigation, the United States Trade Representative (USTR) released a report stating that China's 'Made in China 2025' tech strategy has systematically sought to misappropriate U.S. intellectual property. As a result, the U.S. government announced it would impose a 25-percent tariff hike on $50 billion of Chinese goods. On July 6, the 25-percent tariff increase went into effect on the first $34 billion of imports from China (line 3) and China imposed an equivalent tariff increase of 25 percent on $34 billion of U.S. goods, including soybeans. The 25-percent tariff hike on the remaining $16 billion of Chinese goods took effect on August 23, eliciting an equivalent response from China.
The fourth trade policy action occurred in September, when President Trump announced a 10-percent tariff increase on approximately $180 billion of Chinese goods, which went into effect on September 24 (line 4). In response, China increased tariff rates by 5 and 10 percent on an additional $60 billion of imports from the U.S. In late 2018, the United States and China agreed to temporarily hold off on additional tariff hikes up to March 1, while resuming trade negotiations and in early 2019 President Trump extended this deadline indefinitely following progress in ongoing trade talks.
The fifth and most recent trade policy action occurred in May 2019; citing a breakdown in negotiations, President Trump announced a 15-percent tariff hike on top of the 10-percent tariff already in place on $180 billion of Chinese goods, which went into effect on May 10 (line 5). In response, the Chinese authorities released a list with tariff hikes of 5 to 15 percent on the $60 billion of U.S. goods, which took effect on June 1. To date, the United States has raised tariffs on about $235 billion of Chinese goods and China has raised tariffs on about $113 billion of U.S. goods (lines 1-5).
The U.S. administration has additionally threatened to impose a 25 percent tariff increase on the remaining $275 billion of Chinese imports currently unaffected by the recent U.S. tariffs (line 6).2 As shown in table 2, if the totality of tariffs enumerated (lines 1-6) were implemented, they would cover 23 percent of U.S. non-oil goods imports and 2.6 percent of U.S. GDP and would raise the average U.S. tariff on imports from China by 24.9 percentage points. Similarly, a retaliation by China on all imports from the United States would cover 8 percent of all Chinese non-oil goods imports and 1 percent of Chinese GDP.
Table 2: U.S.-China Trade Importance
| U.S. Total Imports from China | U.S. Total Exports to China | ||
|---|---|---|---|
| Level (2017, $bn) | 509.6 | Level (2017, $bn) | 130 |
| % U.S. Total Non-Oil Goods Imports | 23% | % U.S. Total Non-Oil Goods Exports | 9% |
| % U.S. GDP | 2.60% | % U.S. GDP | 0.70% |
| % Chinese Total Non-Oil Goods Exports | 23% | % Chinese Total Non-Oil Goods Imports | 8% |
| % Chinese GDP | 4% | % Chinese GDP | 1% |
3. Model
We analyze the impact of the recently implemented and proposed tariffs using an international trade model developed by Caliendo and Parro (2015), which builds on the seminal model of trade and geography of Eaton and Kortum (2002) to include multiple tradable and non-tradable sectors, input-output linkages, and global imbalances. In the analysis, we include 30 separate countries and a rest-of-the-world (ROW) entity modeled as one aggregate block.3 The model includes 40 sectors, of which 20 are tradable and 20 are non-tradable, as shown in Table 3.
Each country consists of consumers who purchase final goods, earn labor income, and receive transfers from tariff revenues and from country-specific trade imbalances with all other countries.4 Countries produce composite intermediate goods, which can either serve as final goods for consumption or can be used as inputs in the production of other (tradeable and nontradeable) intermediate goods. We assume that production exhibits constant returns to scale and operates at full employment, using labor and a composite intermediate good (also referred to as materials) as inputs. If we define sectors by $$$j$$$ and countries by $$$n$$$, the production function for intermediate goods is given by:
$$$q_{n}^{j}=z_{n}^{j}[l_{n}^{j}]^{Y_{n}^{j}}\Pi_{k=1}^{J}[m_{n}^{k,j}]^{Y_{n}^{kj}}$$$, (1)
where $$$z_{n}^{j}$$$ denotes productivity in country $$$n$$$ and sector $$$j$$$, $$$l_{n}^{j}$$$ denotes labor, and $$$m_{n}^{k,j}$$$ are the materials needed from sector $$$k$$$ for the production of the intermediate good in sector $$$j$$$. Since production exhibits constant returns to scale and markets are modeled as perfectly competitive, firms price goods at their unit cost:
$$$p_{n}^{j}=\frac{c_{n}^{j}}{z_{n}^{j}}$$$ (2)
where $$$c_{n}^{j}$$$ denotes the cost of an input bundle.
Table 3: Sectors
| Tradable | Non-Tradable | ||||||
|---|---|---|---|---|---|---|---|
| 1 | Agriculture | 11 | Basic metals | 21 | Electricity | 31 | Real estate |
| 2 | Mining | 12 | Metal products | 22 | Construction | 32 | Renting machinery |
| 3 | Food | 13 | Machinery nec | 23 | Retail | 33 | Computer |
| 4 | Textile | 14 | Office | 24 | Hotels | 34 | R&D |
| 5 | Wood | 15 | Electrical | 25 | Land transport | 35 | Other business |
| 6 | Paper | 16 | Communication | 26 | Water transport | 36 | Public |
| 7 | Petroleum | 17 | Medical | 27 | Air transport | 37 | Education |
| 8 | Chemicals | 18 | Auto | 28 | Aux transport | 38 | Health |
| 9 | Plastic | 19 | Other transport | 29 | Post | 39 | Other services |
| 10 | Minerals | 20 | Other | 30 | Finance | 40 | Private |
Countries can source composite intermediate goods domestically or from international suppliers. International trade, however, is subject to trade costs. Denoting country $$$n$$$ as the importer and $$$i$$$ as the exporter, we split trade costs into tariffs $$$\tau _{ni}^{j}$$$ and the typical iceberg trade costs $$$d_{ni}^{j}$$$ which include shipping and other costs. We model these trade costs as multiplicative: $$$(1+\tau _{ni}^{j})d_{ni}^{j}=1$$$. Therefore, the price of an intermediate good in destination country $$$n$$$ is the lowest price across all producers $$$i$$$ after accounting for trade costs, $$$p_{n}^{j}=\min_{i}(\frac{c_{t}^{j}(1+\tau _{ni}^{j})d_{ni}^{j}}{z_{i}^{j}})$$$. Plugging in the firm's pricing equation (2) and adjusting for international trade costs yields the final price:
$$$p_{n}^{j}=\min_{i}(\frac{c_{t}^{j}(1+\tau _{ni}^{j})d_{ni}^{j}}{z_{i}^{j}})$$$ (3)
In this note, we focus on the role of tariffs in spurring adverse resource re-allocations through the lens of our model. For example, as shown in equation (3), higher U.S. tariffs on imports from China, $$$\tau _{USA,CHN}^{i}$$$, raise the prices of those intermediate goods, $$$p_{USA}^{j}$$$, thus lowering U.S. productivity and GDP. In China, tariffs decrease demand for those products for which China is most productive, pushing resources into less productive sectors and lowering overall GDP. We note that the model assumes each country operates at full resource utilization, including full employment, so misallocation of resources is the sole cause of productivity loss.
An important feature and advantage of our multi-country model is that it incorporates trade diversion– exporters can divert their goods to other destinations and importers can switch suppliers, thereby mitigating the negative effect of higher import prices. This approach highlights the main offsetting forces in analyzing the spillovers of permanent U.S.-China tariff hikes. On the one hand, countries could lose as China and the United States push resources into less productive sectors whose goods would otherwise have been imported. On the other hand, countries could gain via trade diversion.
4. Data
We collected data on (1) trade flows, (2) tariffs, (3) input-output structures, and (4) gross output and value added from several data sets.
- Bilateral Trade We use bilateral trade from the United Nations Statistical Division Commodity Trade (UNCOMTRADE) database for 2016 at the Harmonized System 6-digit (HS-6) level.
- Bilateral and Sectoral Tariffs We collect sectoral tariff data from the United Nations Statistical Division-Trade Analysis and Information System (UNCTAD-TRAINS) and Most-Favored Nation (MFN) databases for 2014 and 2016, respectively. The UNCTAD TRAINS data contain bilateral tariffs at the HS-6 product level. The MFN data provide importer-specific MFN tariff rates. We then aggregate bilateral tariffs at the HS-6 level to sectoral bilateral tariffs for the tradable sectors in Table 3 using bilateral trade weights. All told, we compute 31 by 31 bilateral tariffs for each of the 20 tradable sectors in 2016 and assume infinitely large trade barriers for the 20 non-tradable sectors to serve as our baseline. The implemented and proposed tariffs are computed using the lists released by the USTR and China's Ministry of Commerce.
- Input-output tables We use the World Input-Output Database (WIOD) for 2014 to compute the input-output coefficients as the total dollar value of an input sector's intermediate goods divided by the total dollar value of the output sector's inputs.6
- Gross output and value added We use sectoral gross output and value added data from the OECD STAN database for 2016.7
5. Quantitative Analysis
5.1 Effective Tariffs
We first present the computed changes in trade-weighted bilateral tariffs. Table 48 shows the import-weighted bilateral tariffs between the U.S. and China for the scenarios described in Table 1.
The first important finding from studying the baseline tariffs is that bilateral trade between China and the United States was already subject to non-zero tariffs. For instance, the top line shows that the initial import-weighted tariff on U.S. imports from China is about 2.5 percent. Interestingly, the import-weighted tariff on China's imports from the U.S. is notably higher at 5.9 percent. To date, the import-weighted tariffs on U.S. imports from China have risen to 16 percent, whereas those on China's imports from the United States have risen to 20 percent (line 5).
The scenario in line 6 highlights that the effective tariff rates would increase sharply if the proposed tariffs were implemented. For example, if the U.S. were to impose a tariff increase of 25 percent on the remaining $275 billion of imports from China, line 6 shows that the effective new tariff for the U.S. would be 28 percent, an increase compared to the baseline of about 25 percentage points (=28-2.5).
Table 4: Total Import-weighted Bilateral Tariffs
| U.S. tariffs on imports from China (pct.) | Chinese tariffs on imports from U.S. (pct.) | |
|---|---|---|
| (1) | (2) | |
| Baseline (2016) | 2.5 | 5.9 |
| A. Implemented | ||
| 1. Solar & washing mach. | 2.7 | 5.9 |
| 2. Steel & aluminum | 2.8 | 6.4 |
| 3. Sec. 301 - $50bn | 7.6 | 14 |
| 4. Sec. 301 - $180bn (10%) | 11 | 16 |
| 5. Sec. 301 - $180bn (25%) | 16 | 20 |
| B. Proposed | ||
| 6. Remaining $275bn (25%) | 28 | 27 |
Figure 1 plots the bilateral tariffs for each sector. The top panel plots the U.S. tariffs on imports from China in the baseline and shows the tariff rate for the implemented and proposed tariff actions. The bottom panel shows the corresponding Chinese tariffs on U.S. goods.
Several features are noteworthy. First, tariffs vary widely by sector. For instance, the U.S. import tariff on China's textile sector is above 10 percent, whereas in the paper sector, it is nearly 0. Second, China's import tariffs are generally higher than those in the U.S.; that is, the blue bars in the bottom panel are taller for most sectors than in the top. This highlights the importance of having a model with multiple sectors to capture the differences in trade exposures and net increases in tariffs. Finally, the sixth scenario in Table 4 would dramatically increase tariffs and thereby poses a significant downside risk (grey bars).
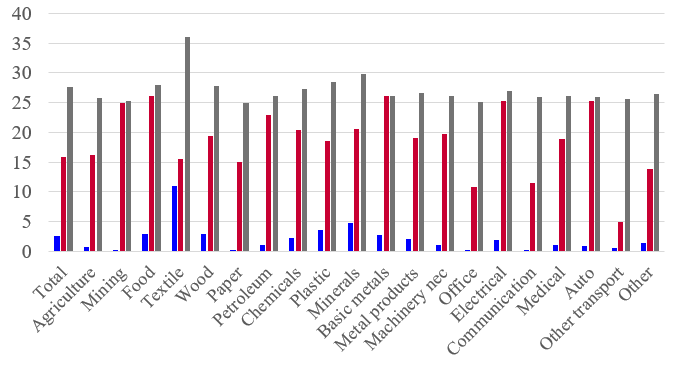
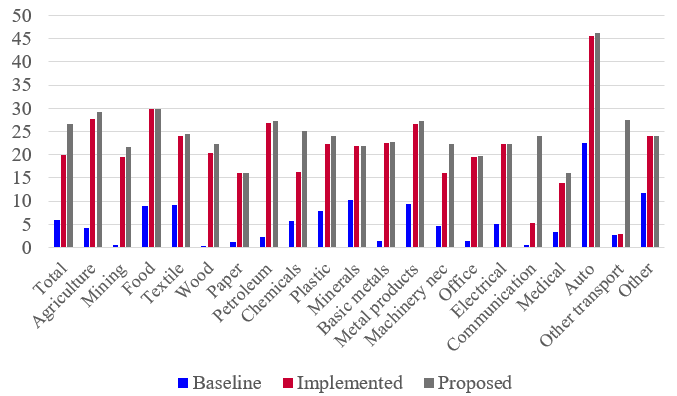
Note: Key identifies bars in order from left to right.
5.2 Effects on Economic Activity
We study the impact of each of the six trade scenarios highlighted in Table 4 on Chinese and U.S. growth. For each of these scenarios we increase the bilateral tariffs for the U.S. and China at the HS-6 level and aggregate those into sectoral bilateral tariffs. We then solve for a new steady-state equilibrium using our international trade model and compute the changes in real Chinese GDP, real U.S. GDP, and these countries' bilateral trade relative to our baseline scenario.
Table 5 presents the results. According to our model, the currently implemented tariffs are expected to have a limited impact (line 5), reducing the level of real GDP in China by 0.25 percent (column (1)). The direct negative effect stems from a drop in Chinese exports to the U.S. Higher tariffs on imports from China increase the prices U.S. consumers and producers face on Chinese goods, as highlighted in equation (2), and thereby reduce U.S. demand for Chinese goods by an estimated 33 percent, or $159 billion as shown in columns (3) and (4). However, we find that this negative effect is in part mitigated by China diverting its exports to other countries (not shown).
Table 5: Cumulative Effect on Real GDP and Trade
| China Real GDP | U.S. Real GDP | China's exports to the U.S. | China's imports from the U.S. | |||
|---|---|---|---|---|---|---|
| (pct.) | (pct.) | (pct.) | ($ in billions) | (pct.) | ($ in billions) | |
| (1) | (2) | (3) | (4) | (5) | (6) | |
| A. Implemented | ||||||
| 1. Solar & washing mach. | 0 | 0 | -0.5 | -2 | -0.2 | -0.3 |
| 2. Steel & aluminum | -0.02 | -0.01 | -0.9 | -4 | -2 | -3 |
| 3. Sec. 301; $50bn | -0.11 | -0.1 | -14 | -67 | -25 | -34 |
| 4. Sec. 301; $180bn (10%) | -0.17 | -0.14 | -23 | -111 | -33 | -45 |
| 5. Sec. 301; $180bn (25%) | -0.25 | -0.19 | -33 | -159 | -43 | -58 |
| B. Proposed | ||||||
| 6. Remaining $275bn (25%) | -0.39 | -0.31 | -54 | -260 | -59 | -80 |
Turning to the United States, the model estimates show that the implemented tariffs lower real U.S. GDP by 0.19 percent. Similarly, higher Chinese tariffs on imports from the U.S. reduce Chinese demand for U.S. goods by an estimated 43 percent or $58 billion as shown in columns (5) and (6). Note that the decrease is smaller relative to China's drop in exports to the U.S. because China has raised tariffs on only $113 billion of U.S. goods compared to the affected $234.6 billion of Chinese goods. For that same reason, however, U.S. producers now face higher prices on more imported intermediate goods, which in turn lowers consumers' purchasing power as outlined before. This direct effect is somewhat mitigated as the U.S. diverts import demand from China to other countries (not shown).
Further tariff increases between the two countries would exacerbate the negative GDP effects. Indeed, if the United States does enact its proposed tariff hike of 25 percent on the remainder of Chinese goods, the level of Chinese and U.S. GDP would fall by 0.39 and 0.31 percent respectively (line 6), which admittedly is still not a large effect, with bilateral trade between the two countries shrinking by more than half.
All told, the model suggests a limited long-run imprint from an increase in tariffs between the United States and China. As such, this analysis suggests that the current concerns regarding the potential economic effects of higher tariff rates are likely related to fears of temporary disruption, such as confidence effects, supply chain disruptions, and financial market volatility, or other long-run factors that are not captured in our model, including slowed innovation due to weaker competition or technology effects. Therefore, we view these estimates as likely lower bounds.
5.3 Spillovers to other countries
The nature of our model, specifically its consideration of multiple countries and input-output link- ages, makes it amenable to analyzing spillover effects to other countries. On the one hand, countries could lose as China and the United States push resources into less productive sectors whose goods would otherwise have been imported. On the other hand, countries could gain via trade diversion.
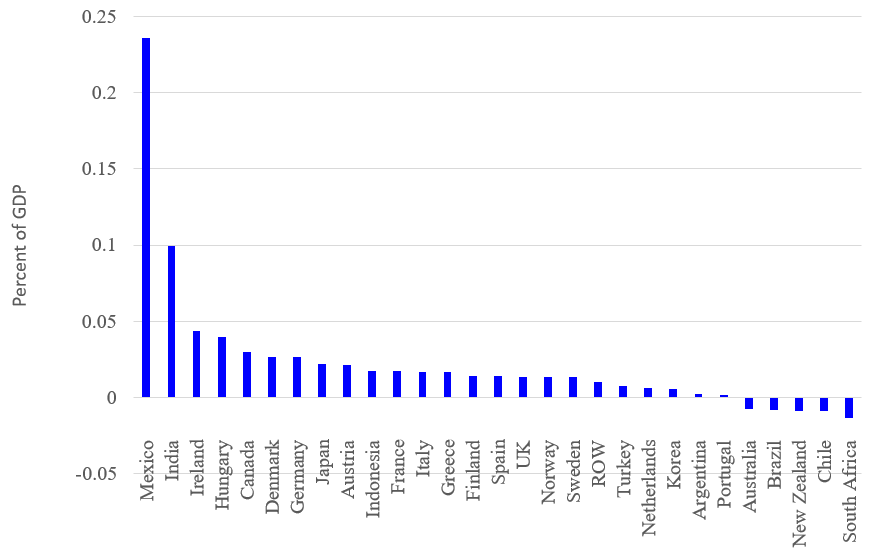
Figure shows the estimated impact on real GDP of other countries in the sample for scenario 4 of table 5, in which we study the cumulative effect of the implemented tariffs. Generally, we find negligible spillover effects to other countries. For most countries, the positive spillover effect of U.S. import diversion is diminished by the negative spillover effect from lower Chinese demand. However, Mexico gains as U.S. import demand is diverted from China, thereby pushing resources into the relatively more productive sectors. We also find that a drop in Chinese demand lowers exports for commodity suppliers like New Zealand, Chile, and South Africa, imposing a drag on their real GDP. All told, this highlights that trade diversion may benefit or pose a small drag on other countries.
References
Alvarez, F. (2017): "Capital accumulation and international trade," Journal of Monetary Economics, 91, 1–18.
Caliendo, L. and F. Parro (2015): "Estimates of the Trade and Welfare Effects of NAFTA," The Review of Economic Studies, 82, 1–44.
Eaton, J. and S. Kortum (2002): "Technology, Geography, and Trade," Econometrica, 70, 1741–1779.
OECD (2011): "STAN Database," .
--- (2016): "Monthly Monetary and Financial Statistics," .
Timmer, M. P., E. Dietzenbacher, B. Los, R. Stehrer, and G. J. de Vries (2015): "An Illustrated User Guide to the World Input-Output Database: the Case of Global Automotive Production," Review of International Economics, 23, 575–605.
United Nations (2014): "Trade Analysis and Information System Database," .
--- (2016a): "Commodity Trade Database," .
--- (2016b): "INDSTAT2 Database," .
--- (2016c): "Most-Favored Nation Database," .
--- (2016d): "National Accounts Database," .
World Input-Output Database (2014): "Input-Output Tables," .
* International Finance Division, Federal Reserve Board, Washington D.C. The views expressed herein are those of the authors and do not necessarily reflect those of the Board of Governors of the Federal Reserve System or its staff.
1. China has not specified a tariff rate if the U.S. were to impose a 25-percent tariff hike on the remainder of Chinese goods. For the sake of exposition, we assume a 25 percent tariff hike (line 6).
2. The 30 countries include Argentina, Australia, Austria, Brazil, Canada, Chile, China, Denmark, Finland, France, Germany, Greece, Hungary, India, Indonesia, Ireland, Italy, Japan, Mexico, the Netherlands, New Zealand, Norway, Portugal, South Africa, South Korea, Spain, Sweden, Turkey, the United Kingdom, and the United States.
3. These transfers are positive (negative) if countries have a positive (negative) total goods balance
4. We assume countries face no trade barriers for domestically produced goods; that is, $$$(1+\tau _{ni}^{j})d_{ni}^{j}=1$$$ if $$$i=n$$$.
5. We supplement these data with the OECD's input-output (I-O) tables for 2011.
6. We supplement these data with the United Nations' INDSTAT2 and National Accounts databases.
7. For each row of table 4, the numbers show what the import-weighted average tariff becomes from the cumulative effects of all the tariffs shown up to that row.
Ferraro, John K., and Eva Van Leemput (2019). "Long-Run Effects on Chinese GDP from U.S.-China Tariff Hikes," FEDS Notes. Washington: Board of Governors of the Federal Reserve System, July 15, 2019, https://doi.org/10.17016/2380-7172.2382.
Disclaimer: FEDS Notes are articles in which Board staff offer their own views and present analysis on a range of topics in economics and finance. These articles are shorter and less technically oriented than FEDS Working Papers and IFDP papers.