FEDS Notes
August 03, 2020
New Financial Market Measures of the Neutral Real Rate and Inflation Expectations
Alex Aronovich and Andrew Meldrum
Long-term U.S. interest rates have fallen substantially over the last two decades. The 5-to-10-year nominal forward interest rate implied by the prices of U.S. Treasury securities is now about 7 percentage points lower than it was at the start of the 1990s (Figure 1). In this Note, we develop a new approach for combining information in Treasury yields and survey forecasts of short-term interest rates and inflation, in order to shed light on what the decline in long-term forward rates tells us about perceptions of the longer-run neutral real interest rate and longer-run expected Consumer Price Index (CPI) inflation.1 We find evidence that perceptions of the neutral real interest rate were relatively stable during the 1990s and early 2000s, but have declined steadily since the Global Financial Crisis, before dropping sharply to around 0 percent during the recent Covid-19 pandemic. In contrast, inflation expectations declined steadily during the 1990s and have since been relatively stable, remaining at about 2.2 percent, even during the recent Covid-19 pandemic.
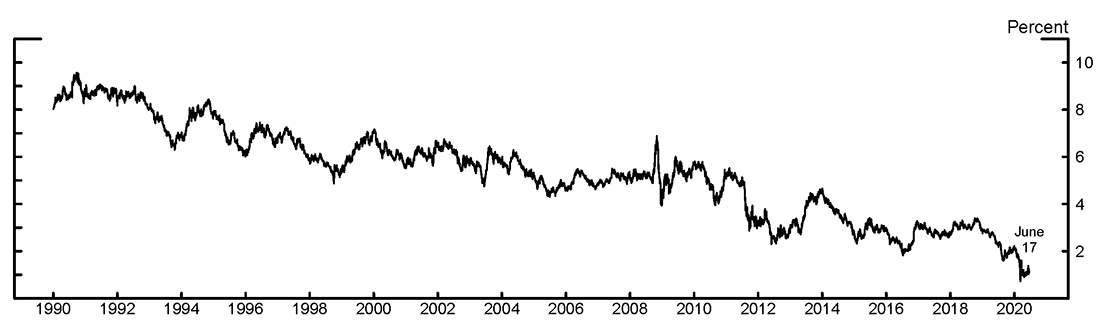
Source: Federal Reserve Bank of New York, Board staff calculations.
Regression-Based Measures of the Neutral Rate and Inflation Expectations
If there are no risk premiums in Treasury yields, 5-to-10-year nominal forward rates would be equal to the sum of the average expected short-term real rate and average expected inflation over the period between 5 and 10 years ahead. If we further assume that investors expect the economy to be operating at potential and the effects of transitory shocks to have abated within 5 years, then the real component would provide a measure of the perceived longer-run equilibrium, or "neutral," real interest rate.
Unfortunately, we cannot straightforwardly decompose nominal forward rates into real and inflation components back to the early 1990s, because of a lack of market-based estimates of real interest rates.2 Moreover, in practice, risk premiums in forward rates may be large and vary substantially over time (see, for example, Kim and Wright (2005)). An alternative measure of interest rate and inflation expectations that should be free of risk premiums is provided by survey forecasts. However, surveys are published infrequently and may measure financial market participants' expectations with errors (because expectations reported by survey respondents may not always be representative of the views of market participants).
This Note introduces a new method for gauging expected real interest rates and inflation rates based on nonlinear regressions of Blue Chip survey forecasts of Treasury bill yields and CPI inflation on Treasury yields. The parts of survey forecasts that are explained by the level of Treasury yields provide measures of expected interest rates and inflation, while the unexplained parts are assumed to be random measurement error. Thus, a benefit of this new approach is that it produces estimates of longer-run expectations that account for term premiums and measurement errors. Moreover, these regression-based expectations can easily be estimated at a daily frequency.
The new approach is closely related to the literature on survey-augmented dynamic affine term structure models, which have been widely-used to estimate term premiums and interest rate expectations; popular estimates include those of Kim and Wright (2005) and Kim and Orphanides (2012). Simplifying a little, interest rate expectations in those models are determined by a linear time-series model of yields, which is estimated using information from surveys and the past behavior of interest rates. Our approach allows for a more flexible functional relationship between expectations and the current yield curve. It also uses only the information in surveys, which makes the model substantially more accessible and faster to estimate than a term structure model. Moreover, dropping the information from the past behavior of interest rates is unlikely to make a material difference to the results because it is well-known that past interest rates provide only a weak signal about their future dynamics (see e.g. Kim and Orphanides (2012)).3 Finally, we note that our regressions can be estimated at a tiny fraction of the computational cost of a dynamic term structure model.
In the remainder of this section we provide the technical details of the approach and data set. Readers not interested in those details can skip ahead to the Results section. Let $$s^{(h)}_t$$ denote a survey-based estimate of the average expected nominal short rate or average expected inflation over the next $$h$$ years, observed at time $$t$$. We estimate regressions of the form
$$(1) \ \ \ \ \ \ \ \ \ \ s^{(h)}_t = g(x_t) + u^{(h)}_t, $$
Where $$g(\cdot)$$ is a nonlinear function of an $$N \times 1$$ vector of Treasury yields $$x_t$$, and $$u^{(h)}_t$$ is a residual. We estimate $$g(x_t)$$ nonparametrically using local linear regressions. The estimator for $$t=1,2,\dots,T$$ is given by
$$(2) \ \ \ \ \ \ \ \ \ \ \hat{g}_h(x_t) = e^T_1(X^T WX)^{-1}X^T Ws,$$
Where
$$ s = \begin{bmatrix} s^{(h)}_1 \\ \dots \\ s^{(h)}_T \end{bmatrix}, \ \ \ \ X = \begin{bmatrix} 1 & (x_1-x_t)^T \\ \dots & \dots \\ 1 & (x_T - x_t)^T \end{bmatrix}, $$
$$\displaystyle W = diag \left( \prod_{d=1}^{N} K(\frac{x_{1,d} - x_{t,d}}{b_d}) \ \dots \ \prod_{d=1}^{N} K (\frac{x_{T,d}-x_{t,d}}{b_d}) \right), $$
and $$e_1$$ is an $$(N+1) \times 1$$ vector with the first element equal to 1 and the remaining elements equal to zero. The weighting matrix $$W$$ is determined by a Gaussian kernel function $$K(\cdot)$$ and bandwidth parameters $$b_d \ge 0 $$.4 Very small values of $$b_d$$ effectively mean that the regression only assigns material weight to the near neighbors of $$x_t$$, while very large values of $$b_d$$ mean that all points receive approximately equal weight (that is, the local linear regression converges to the standard linear case). We adopt a standard cross-validation procedure of choosing the bandwidth parameters that minimize the sum of squared out-of-sample errors.5
The dependent variables in the regressions are long-horizon survey expectations derived from the Blue Chip Economic Indicators and Financial Forecast surveys of 3-month Treasury bills and CPI inflation. The sample period runs from January 1990 to June 2020. The Economic Indicators and Financial Forecasts surveys are both conducted twice each year, giving a total of 122 survey observations over the sample. We take the Treasury bill and inflation expectation reported by the average respondent and linearly interpolate across forecast horizons to produce measures of average expected short-term nominal interest rates and inflation over the next 5 and 10 years. The explanatory variables in the regressions are zero-coupon Treasury yields with maturities of 6 months, 5 years, and 10 years. These yields are taken from the Gürkaynak, Sack, and Wright (2007) data set.6
In total, there are four regressions: for average expected short-term nominal interest rates and inflation at horizons of 5 and 10 years each.7 From the fitted values we compute average expectation short-term nominal interest rates and inflation over a period from 5 to 10 years ahead. We finally compute the average expected short-term real rate from 5 to 10 years ahead as the difference between the expected short-term nominal rate and expected inflation.
Results
Figure 2 shows the 5-to-10-year-ahead average expected short-term real interest rate and CPI inflation implied by the nonlinear regressions. During the 1990s and 2000s prior to the Global Financial Crisis, the expected short-term real interest rate generally stayed within a range from about 1.5 percent to about 2.5 percent. However, since the Global Financial Crisis, it has declined fairly steadily, with particularly sharp declines during the middle of 2019 and during the recent Covid-19 pandemic, during which it has fallen to around 0 percent.
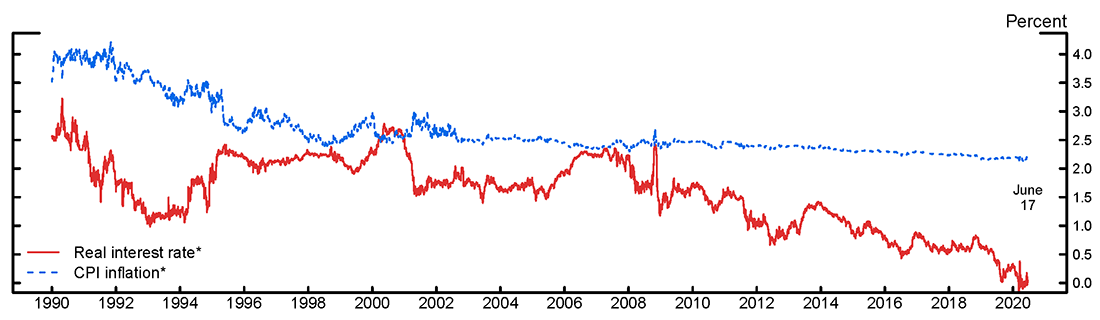
* Estimated using local linear regressions of interest rate and inflation survey forecasts on Treasury yields.
Source: Federal Reserve Bank of New York; Wolters Kluwer Legal and Regulatory Solutions U.S.: Blue Chip Economic Indicators and Blue Chip Financial Forecasts; Board staff calculations.
In contrast, the average expected CPI inflation rate declined fairly steadily during the 1990s, from about 4 percent to a little over 2.5 percent. While it has edged down since 2014, it has remained relatively stable during the recent Covid-19 pandemic, ending the sample at 2.2 percent. Thus, the results generally confirm previous by findings by Bauer and Rudebusch (2020): long-horizon inflation expectations generally fell during the 1990s, while real rate expectations have fallen since the Global Financial Crisis.
As discussed above, our regressions are closely related to survey-augmented dynamic term structure models, with the most important exception that the regressions allow for nonlinearity in the relationship between expectations and yields. Figure 3 illustrates the importance of allowing for nonlinearity. It compares the perceived neutral real rate implied by the regressions (the red line) with the corresponding results from the survey-augmented term structure model of D'Amico, Kim, and Wei (2018; the dashed blue line). The purple markers show a measure based on the difference between long-horizon Blue Chip surveys of federal funds rate and CPI inflation expectations. The regressions are better able to track the broad movements in the survey measure than the term structure model, which struggles to match the extent of the downward trend.
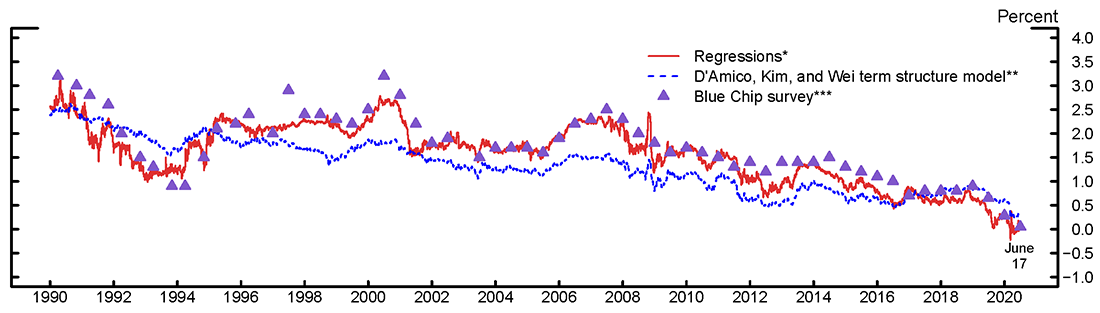
* Estimated using local linear regressions of interest rate and inflation survey forecasts on Treasury yields.
** See Kim, D. H., C. Walsh, and M. Wei (2019), 'TIPS from TIPS: Update and Discussions', FEDS Notes, May 21, 2019. All yields are on a zero−coupon basis.
*** Difference between survey respondents' long−run nominal rate and inflation expectations. The final survey data point is June 2020.
Source: Federal Reserve Bank of New York; Wolters Kluwer Legal and Regulatory Solutions U.S.: Blue Chip Economic Indicators and Blue Chip Financial Forecasts; Board staff calculations.
How do our estimates of long-horizon expectations of short-term real interest rates compare with previous estimates of neutral real interest rates? As can be seen in the gray region in Figure 4, estimates of the longer-run neutral real rate from six previous studies (Del Negro and others (2017); Holston, Laubach, and Williams (2017); Johannsen and Mertens (2016); Kiley (2020); Laubach and Williams (2003, 2016); Lewis and Vazquez-Grande (2019)) have declined from around 2 percent in the 1990s to below 1 percent over the period since the Global Financial Crisis.8 Our estimate broadly matches the decline in the mean of these estimates. However, the macroeconomic model estimates declined earlier than our estimate, reflecting the fact that the survey-based measure (shown in Figure 3) did not decline immediately during the Global Financial Crisis. In addition, the survey-based measure has continued to decline in recent years, ending the sample around the bottom end of the range of macroeconomic model estimates. Finally, we note that our estimates can be obtained at a tiny fraction of the typical computational costs of estimating these macroeconomic models.
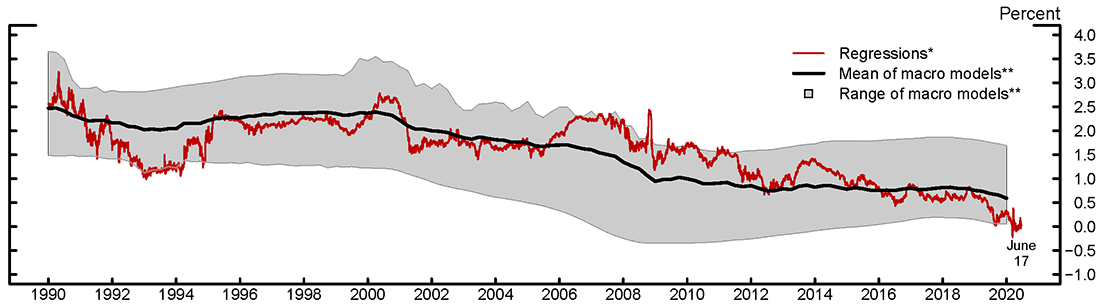
* Estimated using local linear regressions of interest rate and inflation survey forecasts on Treasury yields.
** Mean and range of quarterly point estimates from six models reported in the Monetary Policy Strategies section: Del Negro and others (2017), Holston and others (2017), Johannsen and Mertens (2016), Kiley (2020), Laubach and Williams (2003), and Lewis and Vazquez−Grande (2019). The final data point is 2020 Q1.
Source: Federal Reserve Bank of New York; Wolters Kluwer Legal and Regulatory Solutions U.S.: Blue Chip Economic Indicators and Blue Chip Financial Forecasts; Board staff calculations.
References
Bauer, M. D., and G. D. Rudebusch (2020)."Interest Rates under Falling Stars."American Economic Review, 110 (5), 1316-54.
D'Amico, S., D. H. Kim, and M. Wei (2018). "Tips from TIPS: The Informational Content of Treasury Inflation-Protected Security Prices." Journal of Financial and Quantitative Analysis, 53(1), 395-436.
Del Negro, M., D. Giannone, M. P. Giannoni, and A. Tambalotti (2017). "Safety, Liquidity, and the Natural Rate of Interest." Brookings Papers on Economic Activity, Spring, pp. 235-316.
Haubrich, J. G. and S. Millington (2014). "PCE and CPI Inflation: What's the Difference?" Available at: https://www.clevelandfed.org/newsroom-and-events/publications/economic-trends/2014-economic-trends/et-20140417-pce-and-cpi-inflation-whats-the-difference.aspx.
Holston, K., T. Laubach, and J. C. Williams (2017). "Measuring the Natural Rate of Interest: International Trends and Determinants." Journal of International Economics, 108, pp. S59-75.
Gürkaynak, R. S., B. Sack, and J. H. Wright (2007). "The U.S. Treasury Yield Curve: 1961 to the Present." Journal of Monetary Economics 54(8), pp. 2291-2304.
Johannsen, B. K. and E. Mertens (2016). "A Time Series Model of Interest Rates with the Effective Lower Bound." Finance and Economics Discussion Series 2016-033. Board of Governors of the Federal Reserve System.
Kiley, M. T. (2020). "What Can the Data Tell Us about the Equilibrium Real Interest Rate?" International Journal of Central Banking 16(3), pp. 181-209.
Kim, D. H. and A. Orphanides (2012). "Term Structure Estimation with Survey Data on Interest Rate Forecasts." Journal of Financial and Quantitative Analysis, 47(1), pp. 241-272.
Kim, D. H. and J. H. Wright (2005). "An Arbitrage-Free Three-Factor Term Structure Model and the Recent Behavior of Long-Term Yields and Distant-Horizon Forward Rates." Finance and Economics Discussion Series, 2005-33. Board of Governors of the Federal Reserve System.
Kim, D. H., C. Walsh, and M. Wei (2019). "Tips from TIPS: Update and Discussions." FEDS Notes. Washington: Board of Governors of the Federal Reserve System, May 21, 2019, https://doi.org/10.17016/2380-7172.2355.
Laubach, Thomas, and John C. Williams. (2003). "Measuring the Natural Rate of Interest." Review of Economics and Statistics, 85(4), November, 1063–1070.
Lewis, K. F., and F. Vazquez-Grande (2017). "Measuring the Natural Rate of Interest: A Note on Transitory Shocks." Journal of Applied Econometrics, forthcoming.
Newey, W. (2007). "Course Materials for 14.385 Nonlinear Econometric Analysis, Fall 2007." MIT OpenCourseWare (http://ocw.mit.edu), Massachusetts Institute of Technology.
1. This is a different measure of inflation from the one based on personal consumption expenditure targeted by the Federal Open Market Committee. As discussed by Haubrich and Millington (2014), CPI inflation has on average been somewhat higher than CPE inflation. Return to text
2. We can use the yields on Treasury Inflation Protected Securities to decompose nominal forward rates since the late 1990s. Return to text
3. Indeed, unreported results show that a dynamic term structure model augmented with survey information produces essentially the identical interest rate expectations as a linear regression of surveys on yields. Return to text
4. For more details on the local linear estimator, see Newey (2007). Return to text
5. This procedure entails a "leave-one-out" cross-validation procedure: For a given set of bandwidth parameters, we estimate the model leaving out each observation of the survey data in turn and compute the resulting out-of-sample fitting errors. The bandwidth parameters are chosen using a numerical optimizer that minimizes the resulting sum of squared errors over the sample. Return to text
6. Updates of the data are available at https://www.federalreserve.gov/data/nominal-yield-curve.htm. Return to text
7. We constrain the bandwidth parameters to be the same for 5- and 10-year expectations. Return to text
8. Here, we plot the smoothed estimates of the neutral real rate from the macroeconomic models, that is, the expectation of the neutral real rate conditional on all data in the estimation sample. Return to text
Aronovich, Alex, and Andrew Meldrum (2020). "New Financial Market Measures of the Neutral Real Rate and Inflation Expectations," FEDS Notes. Washington: Board of Governors of the Federal Reserve System, August 03, 2020, https://doi.org/10.17016/2380-7172.2621.
Disclaimer: FEDS Notes are articles in which Board staff offer their own views and present analysis on a range of topics in economics and finance. These articles are shorter and less technically oriented than FEDS Working Papers and IFDP papers.