FEDS Notes
May 22, 2023
Real GDP and Productivity Measurement: What Do Macro Data Capture?
François de Soyres, Alexandre Gaillard, and Henry Young1
Since the publication of their 2021 "Blue Book", the UK's Office for National Statistics started to measure real GDP in the national accounts using double deflation. This methodological update follows the premise that "double deflation is internationally accepted as the best approach to producing volume estimates of industry Gross Value Added".2 Indeed, double-deflation, taking the difference between gross output and intermediate inputs, has been the international standard since the System of National Accounts (SNA 1993) was adopted by the international community to facilitate international comparisons of national economic statistics. In the United States, this accounting practice has been used since 1992,3 while it has been the standard practice in the euro area since the creation of Eurostat.4
In this note, we argue that although double deflation is the state-of-the-art method for real value-added measurement, its accuracy relies on several assumptions that are not met in practice. In particular, our analysis aims to quantify how the presence of markups creates a measurement issue in national accounts data. As a result, our understanding of relative growth rates across sectors is biased. These limitations are important for researchers that match their quantitative models with the data produced by statistical agencies.
A historical detour.
To understand accounting procedures in national accounts, it is useful to come back to the notion of real value-added. According to Sims (1969) and Arrow (1974), real value-added can be defined implicitly from the production function itself. Using Arrow's words: we can "imagine capital and labor cooperating to produce an intermediate good called real value added (V), which in turn cooperates with materials to produce the final product."5 Following this view, real value-added in any sector corresponds only to the quantity of a bundle that combines capital and labor. To avoid confusion with what is measured in official data, we can call this object "Physical Value-Added" (PVA). By construction, changes in the quantity of intermediate inputs impact PVA only through movements in labor, capital, or productivity.
In practice, statistical agencies do not observe PVA. Instead, national accountants construct a measure of "statistical value added" using double deflation, a method that consists of taking the difference between gross output and intermediate inputs, both valued using base period prices.6 By construction, it cannot be measured without prices. Obviously, one cannot simply count the number of goods: for example, one cannot compute real value-added in the automotive sector by taking the difference between the final number of cars produced and the number of its intermediate inputs. Therefore, statistical agencies need a common unit of account, which is why base period prices are necessary for the construction of sectoral real value added, as well as aggregate real GDP.
How about distorted prices?
An important implicit assumption underlying the wide usage of double deflation is that the base period price used to value intermediate inputs reflects both inputs' marginal cost and the marginal revenue that can be derived from their usage. If true, then double deflation is indeed an accurate measure of PVA.
However, if prices are distorted (because firms charge a markup or the presence of taxes, for example), then using distorted prices in the construction of real value-added creates a wedge between statistical value-added captured in national accounts and the PVA concept inspired by Sims (1969). This is intuitive: if a sector is charging a markup and makes profits, these profits will be part of the statistical value added measured using double deflation.
Again, the key element here is that real value-added cannot be constructed without prices, which creates issues when prices are distorted. Importantly, price distortions do not need to vary over time to create a bias in real value-added measurement. Even with constant markups, intermediate inputs generate more revenues than their cost. Therefore, using more inputs mechanically results in more statistical value-added, even when domestic factors (labor and capital) and technology are unchanged. This occurs because a sector's net operating surplus, a profit-like variable, is part of the statistical agencies' measure of real value-added. 7 Hence, ceteris paribus, a sector can create statistical value-added by increasing its profits even thought this does not increase PVA.
How much does it matter?
This mismatch between PVA and statistical value added as measured in the national accounts matters in many contexts. For example, measuring real GDP using double deflation in macroeconomic models has a big impact on the statistical properties of real GDP in models' simulations. In de Soyres and Gaillard (2021), we argued that using double deflation is key to understanding cross country real GDP comovements.8
In a new paper (de Soyres, Gaillard and Young, 2023) we analyze whether profits have biased reported measures of sectoral GDP and productivity in the US. According to our framework, real GDP featured in the national accounts and PVA differ mostly for sectors with two characteristics: markups are large (even if they are constant) and fluctuations in intermediate inputs account for a large part of gross output fluctuations.9 Using the BEA's data on net operating surplus, we can build a measure of markups at the sector level which we combine with data on input-output linkages to construct a new version of national account statistics. For each sector, we construct a measure of PVA) and compare it to the statistical measure of real GDP. This exercise brings several insights.
In figure 1, we compare the evolution of statistical real value-added (i.e. sectoral real GDP) to our measure of PVA once fluctuations in net operating surplus are properly taken into account. We focus on two sectors that illustrate different biases in national statistics: Finance and Insurance, and Manufacturing. Both sectors rely heavily on intermediate inputs: between 1997 and 2021, the average share of input cost in total sales amounts to 55 percent in Finance and 70 percent in Manufacturing. While year-to-year growth rates for GDP and PVA are highly correlated, the cumulative bias over time leads to significant differences by the end of our sample. Normalizing both measures to 1997, PVA's cumulative growth in 2021 is 19 percentage points lower than real GDP growth in the Finance sector. In the Manufacturing sector, PVA's cumulative growth is more than 21 percentage points higher than real GDP growth. In other words, compared to PVA, real GDP presented in national accounts severely overestimate cumulative growth in Finance, while they significantly underestimated it in Manufacturing.
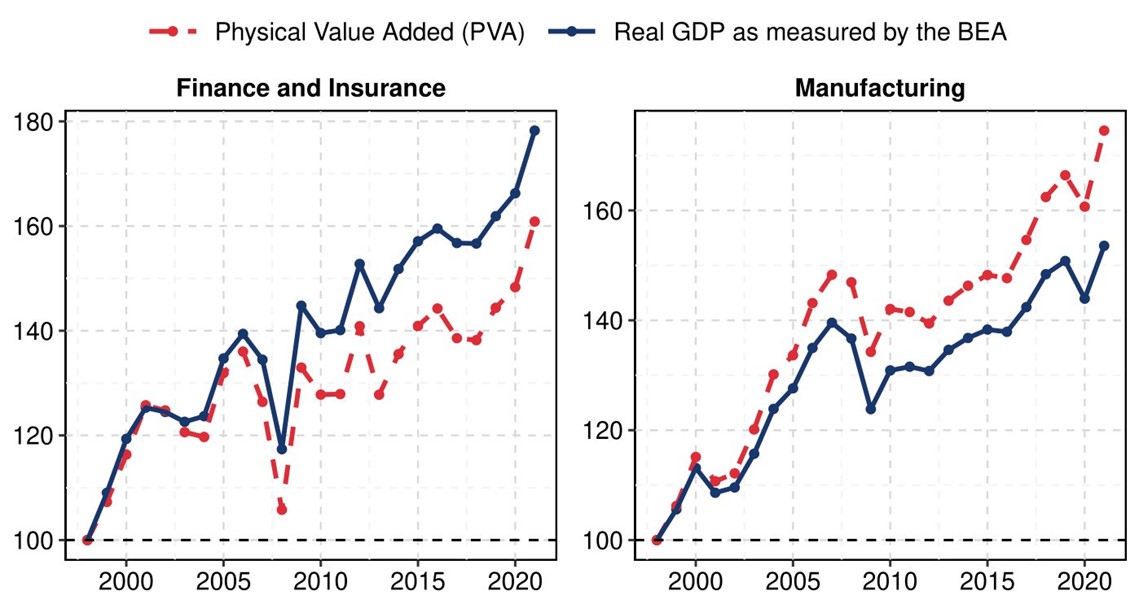
Source: Authors' calculations based on BEA's GDP-by-Industry Accounts Tables
Next, equipped with our PVA index, we construct a measure of "Physical Productivity" as the fluctuations in PVA that are not due to observed movements in labor and capital, which we can then compare to the more standard Solow Residual which is based on real GDP as measured by statistical agencies. Results are presented in figure 2. By the end of our sample in 2021, cumulative growth of physical productivity is about 13 percentage points smaller than that of the Solow residual in Finance, while it is 24 percentage point larger than Solow Residual in Manufacturing. Once again, national accounts' data overestimated productivity growth in Finance, while they underestimated it in Manufacturing.
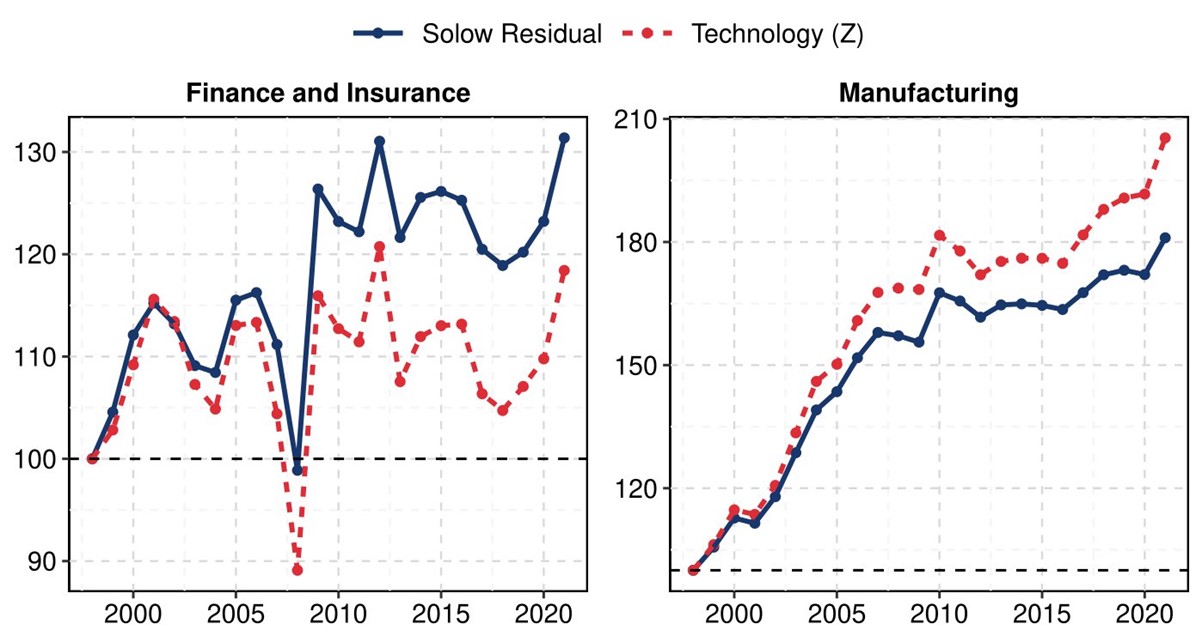
Source: Authors' calculations based on BEA's GDP-by-Industry Accounts Tables
As noted earlier, our analysis aims to quantify how the presence of markups creates a measurement issue in national accounts data. Recall that this mismeasurement appears even if markups are constant and uniform across all firms, as long as intermediate input usage is not perfectly correlated with gross output. Hence, our investigation is conceptually distinct from the topic of resource misallocation. Recent papers such as Baqaee and Farhi (2020) highlighted how markup heterogeneity across firms implies that the allocative efficiency of the U.S. economy has changed over time, as production factors are reallocated to high-markup firms. According to their estimate, this reallocation process accounts for about half of aggregate TFP growth over the period 1997-2015. While both misallocation and measurement are important issues, they highlight different aspects of how markups impact the economy.
In conclusion, our findings highlight how economic mis-measurement in widely used data can bias our understanding of economic activity. With recent debates regarding the rise of market power and markup in the U.S., it is more important than ever to pay close attention to the measurement of economic variables used in policy decisions and academic research.
References
- Arrow, K. (1974): "The Measurement of Real Value Added," in Paul A. David and Melvin W. Reder (eds), Nations and Households in Economic Growth: Essays in honor of Moses Abramovitz: Academic Press, pp. 3–19
- Baqaee, D. and E. Farhi (2020): "Productivity and Misallocation in General Equilibrium," The Quarterly Journal of Economics, Vol 135, Issue 1, pp 105–163.
- European System of Accounts (ESA 1995), Office for Official Publications of the European Communities, European Commission.
- de Soyres, F. and A. Gaillard (2019): "Value Added and Productivity Linkages Across Countries". International Finance Discussion Papers 1266.
- de Soyres, F., A. Gaillard and H. Young (2023): "What is Measured in National Accounts?", Working Paper.
- Sims, C. (1969): "Theoretical Basis for a Double Deflated Index of Real Value Added," The Review of Economics and Statistics, Vol. 51, pp. 470–471.
- Commission of the European Communities, International Monetary Fund, Organisation for Economic Co-operation and Development, United Nations, and the World Bank, "System of National Accounts 1993 (SNA 1993)" Brussels/Luxembourg, New York, Paris, and Washington, DC, 1993.
- Young, A. H. (1992): "Alternative Measures of Change in Real Output and Prices", Survey of Current Business, Vol 72, Issue 4, pp 32–48.
1. François de Soyres ([email protected] ) is a Principal Economist in the Division of International Finance of the Federal Reserve Board of Governors. Alexandre Gaillard is a postdoctoral fellow at the Julis-Rabinowitz Center for Public Policy & Finance at Princeton University. Henry Young is a PhD candidate at the University of Michigan. The views expressed are solely the responsibility of the authors and should not be interpreted as reflecting the views of the Board of Governors of the Federal Reserve System or of any other person associated with the Federal Reserve System. Return to text
2. See section 3 in the ONS memo "A new framework for UK GDP: progress, challenges and the future". The double deflation method computes real value-added growth as the difference between real gross output and real intermediate input growth. It differs from the single-deflation method which assumes that real value-added grows at the same rate as real gross output. Return to text
3. See box page 34 of the article by Allan H. Young "Alternative Measures of Change in Real Output and Prices" published in the Survey of Current Business in April 1992. Return to text
4. See paragraph 10.28 (page 234) of the first European system of national and regional accounts (ESA 1995, published in 1996), which defines the accounting rules for Member States. Return to text
5. This quote is taken from Arrow (1974), pp 4-5. Return to text
6. When the price at time t is used as the base period price used in the construction of real GDP growth from t-1 to t, the index is referred to as the Paasche index. When the price at time t-1 is used, the index is called the Laspeyres index. In most databases, real GDP is defined using the Fisher ideal quantity index which is a geometric mean of the Laspeyres and Paasche indices. Return to text
7. The BEA defines its measure of net operating surplus as: "a profits-like measure that shows business income after subtracting the costs of compensation of employees (received), taxes on production and imports less subsidies, and consumption of fixed capital from value added, but before subtracting financing costs and business transfer payments." Return to text
8. https://drive.google.com/file/d/1p-_Fk8IcckfICUY0rd7-u2v7c8jvE7D4/view Return to text
9. When the bias exists, its direction of the bias depends on the correlation between intermediate input fluctuations and the growth rate of gross output. Return to text
de Soyres, François, Alexandre Gaillard, and Henry Young (2023). "Real GDP and Productivity Measurement: What Do Macro Data Capture?," FEDS Notes. Washington: Board of Governors of the Federal Reserve System, May 22, 2023, https://doi.org/10.17016/2380-7172.3317.
Disclaimer: FEDS Notes are articles in which Board staff offer their own views and present analysis on a range of topics in economics and finance. These articles are shorter and less technically oriented than FEDS Working Papers and IFDP papers.