FEDS Notes
November 09, 2020
Short-Term Funding Stresses and Asset Prices: Lessons from U.S. History
Recent stress episodes in U.S. short-term dollar funding markets have brought renewed attention to the functioning of these markets and how they interact with capital markets more generally.1 The history of U.S. money markets and stock and bond markets before the founding of the Federal Reserve offer a unique perspective on how the structure of money markets can contribute to broader asset price fluctuations. Further, notwithstanding several differences, the structure of these historical money markets still share some similarities with modern money markets. In this note, I summarize recent findings of my own research on historical asset prices and money markets in the U.S. (Weiss, 2020). In short, conditions in U.S. money markets forecast price movements for stocks and bonds—and therefore the price of risk—during the period 1875-1913, due to the importance of money markets in funding leveraged traders.
First, I provide the necessary historical background. In the post-bellum period prior to the founding of the Fed (1866-1913), the marginal investors in U.S. stock and bond markets were typically wealthy speculators who traded on margin credit. For the largest stock exchange, the New York Stock Exchange, all transactions had to be settled daily, so the majority of margin loans were due "on call" and thus essentially had overnight terms. The main providers of these loans were the commercial banks of New York City, but the funds they used to provide these loans often came from deposits of out-of-town banks, and these funds were concentrated in a small number of New York City banks, known as "bankers' banks". The New York City banks had to keep 25 percent of their deposits as cash reserves according to federal law, otherwise they had to contract their loan balances to replenish their reserves and move above the required reserve ratio. As a result, they typically endeavored to keep a buffer above this regulatory limit.2 There was no deposit insurance at the time, and, though the New York City banks belonged to an organization—the New York City Clearinghouse (NYCH)—that could act as a lender of last resort in times of financial stress, it is not clear from the historical record that it always did so.3 Further, there was no interbank market for reserves, as interbank loans were seen as sign that a bank was weak.
The main results of my research, as shown in Figure 1, show that changes in the liquidity position of the NYCH banks forecast excess returns for stocks and bonds for several subsequent quarters. Increases in the liquidity position (e.g. increases in cash reserves or declines in the loan-deposit ratio) for the NYCH banks tend to predict higher excess returns, and these higher excess returns are sizable. For example, a standard deviation increase in the growth of NYCH bank reserves forecasts additional excess returns for stocks two quarters ahead that are 1.5 times the average excess return for stocks. The predictive power of NYCH bank balance sheets comes even while controlling for other common macroeconomic predictors, suggesting that the forecasting ability of NYCH bank financial conditions is a separate channel from general business cycle fluctuations, for example. The relationship between NYCH bank balance sheets and asset prices holds in almost every rolling 10-year subsample during the entire period, suggesting that the predicted effect is not due to any single episode or crisis.4
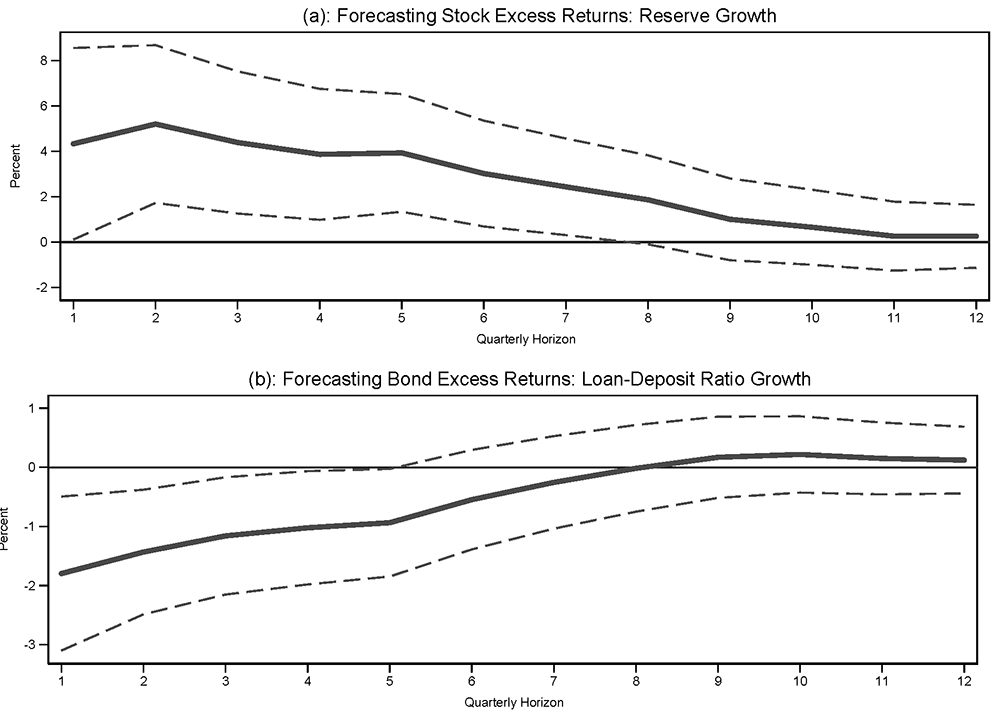
Notes: Each panel shows the additional cumulative excess return at quarterly horizon $$t+h$$ for a specific asset class predicted by a standard deviation increase in a given NYCH bank balance sheet variable at time $$t$$: year-over-year cash reserve growth for stocks (Panel (a)) or year-over-year loan-to-deposit ratio growth for bonds (Panel (b)). Estimates are based on a regression of cumulative excess returns at quarter $$t+h$$ on the NYCH bank balance sheet growth variable and controls for year-over-year real GNP growth, one-quarter excess return, dividend yield, and earnings-to-price ratio all measured at quarter $$t$$. Dashed lines are 90% confidence bands computed using Hodrick (1992) standard errors.
I offer several pieces of evidence to show that the predictive power of NYCH bank health is due to frictions on their ability to supply margin loans. First, the balance sheets of the NYCH banks do not forecast stock dividends, so that their forecasting power must come from changing the discount rate of the marginal investors. Second, Figure 2 shows the forecasting ability is only for the balance sheets of the NYCH banks that provided the bulk of margin loans, i.e. those that held most of the out-of-town banks' deposits. There is no predictability of excess returns using the balance sheets for NYCH banks that funded themselves through individual deposits rather than banks' deposits. Third, the forecasting relationship only holds when the NYCH banks are closer to the minimum reserve requirement (Figure 3), when their supply of loans is constrained. Fourth and finally, though NYCH bank balance sheets also forecast money market conditions in the UK, they do not forecast excess returns for UK equities (Figure 4). This is noteworthy because transactions on the London stock exchange settled every two weeks, so there was less reliance on overnight financing, and London financial institutions had access to a lender of last resort: the Bank of England.5
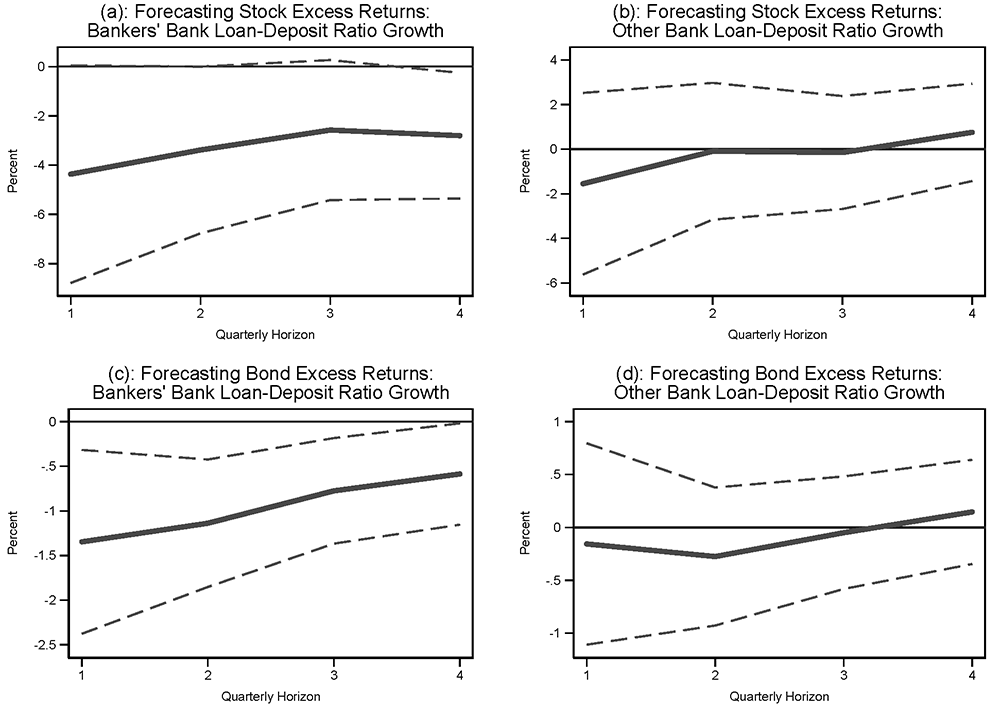
Notes: Each panel shows the additional cumulative excess return at quarterly horizon $$t+h$$ for stocks (Panels (a) and (b)) or bonds (Panels (c) and (d) predicted by a standard deviation increase in either NYCH “bankers’ banks" year-over-year loan-to-deposit ratio growth or all other NYCH banks’ year-over-year loan-to-deposit ratio growth at time $$t$$. Estimates are based on a regression of cumulative excess returns at quarter $$t+h$$ on NYCH bankers’ bank and other NYCH banks’ year-over-year loan-to-deposit ratio growth, year-over-year real GNP growth, dividend yield, earnings-price ratio, and one quarter excess return, all measured at quarter $$t$$ and split into “below" and “above" versions of original variables. “Below" versions take their actual value when NYCH bankers’ banks’ reserve-deposit ratio is below its sample median and zero otherwise, while “above" versions take their actual value when NYCH bankers’ banks’ reserve-deposit ratio is above its sample median and zero otherwise. Plotted effects are for the “below" versions of bankers’ bank and other bank loan-to-deposit ratio growth. Dashed lines are 90% confidence bands computed using Hodrick (1992) standard errors.
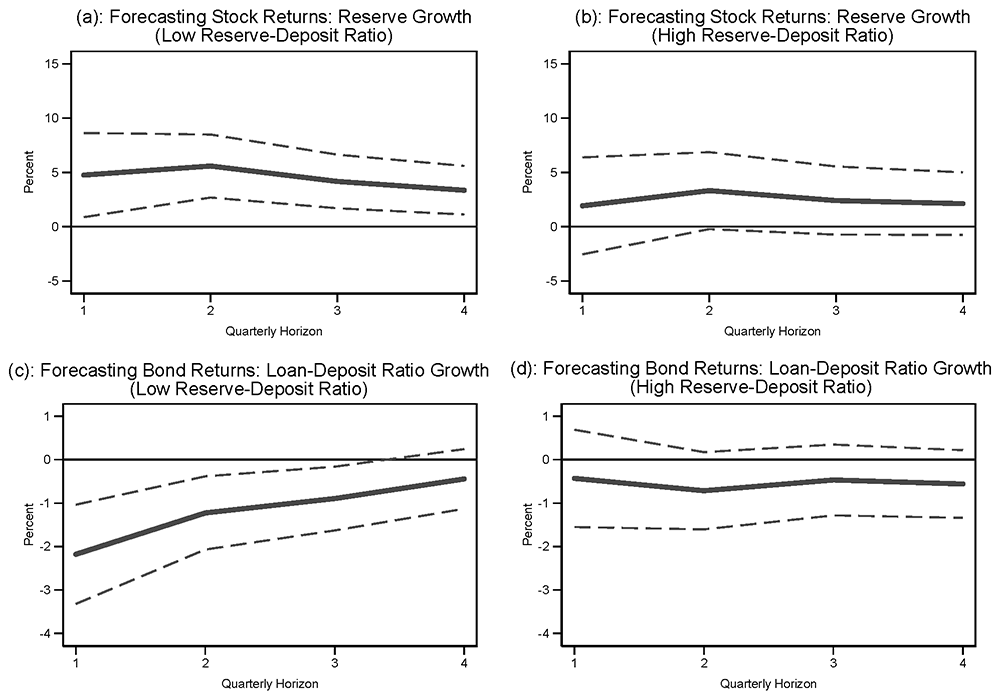
Notes: Each panel shows the additional cumulative excess return at quarterly horizon $$t+h$$ for stocks (Panels (a) and (b)) or bonds (Panels (c) and (d)) predicted by a standard deviation increase in a given NYCH bank balance sheet variable at time $$t$$: year-over-year cash reserve growth or year-over-year loan-to-deposit ratio growth. Estimates are based on a regression of cumulative excess returns at quarter $$t+h$$ on the NYCH bank balance sheet growth variable and controls for year-over-year real GNP growth, one-quarter excess return, dividend yield, and earnings-to-price ratio all measured at quarter $$t$$ with every variable split into “below" and “above" versions. “Below" variables are their actual values when NYCH banks’ reserve-deposit ratio is below its sample median and zero otherwise, while “above" variables are their actual values when NYCH banks’ reserve-deposit ratio is above its sample median and zero otherwise. Panels (a) and (c) report effects for “below" versions of NYCH bank balance sheet variables. Panels (b) and (d) report effects for “above" versions of NYCH bank balance sheet variables. Dashed lines are 90% confidence bands computed using Hodrick (1992) standard errors.
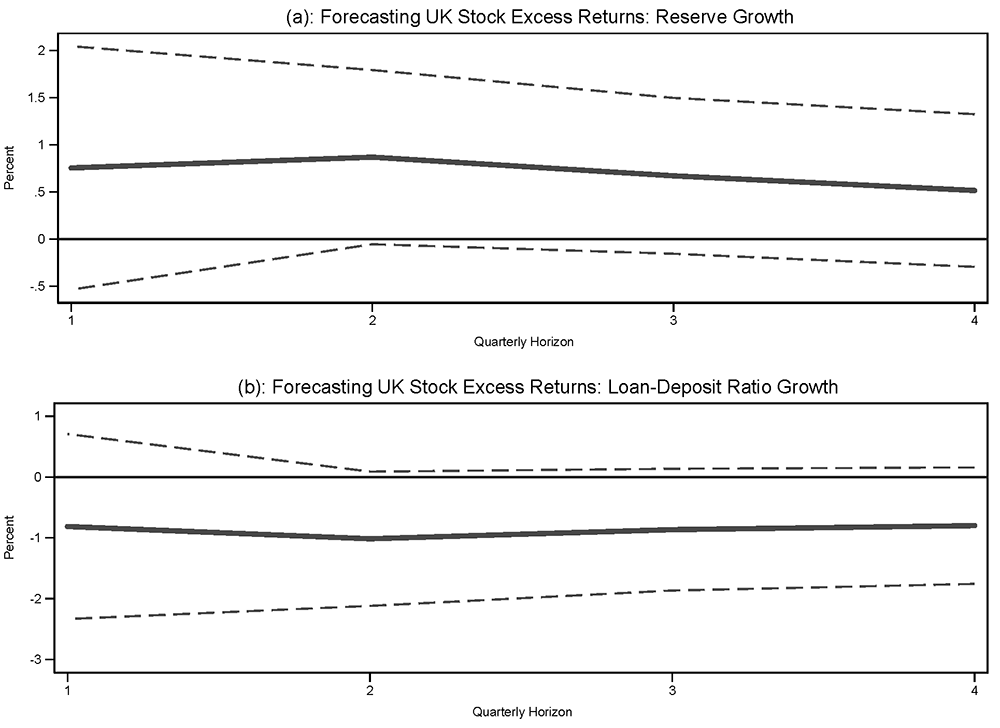
Notes: Each panel shows the additional cumulative excess return at quarterly horizon $$t+h$$ for British stocks predicted by a standard deviation increase in a given NYCH bank balance sheet variable at time $$t$$: year-over-year cash reserve growth (Panel (a)) or year-over-year loan-to-deposit ratio growth (Panel (b)). Estimates are based on regressions of cumulative excess returns for British equities at $$t+h$$ on the NYCH bank balance sheet variable, year-over-year growth in real British bank clearings, the dividend yield for British stocks, and the one-quarter excess return for British equities all measured at quarter $$t$$. Dashed lines are 90% confidence bands computed using Hodrick (1992) standard errors.
Therefore, these historical results offer several lessons about the connection between short-term funding markets and asset prices more generally. First, so long as the marginal investor is a leveraged trader reliant on short-term financing, funding conditions for the leveraged trader will affect the prices of the assets held by the leveraged trader, in line with modern evidence for intermediary asset pricing theories (He and Krishnamurthy, 2018). Second, conditions for those that fund leveraged trading are an important asset price determinant. Therefore it is likely not enough to regulate the leverage of the marginal investor. Even if leverage is well-regulated and at a "safe" level, sudden changes in the conditions for those institutions providing the financing may cause forced deleveraging that lowers asset prices. Call loans on equity collateral in the 19th century typically had an initial margin of 20-30 percent, much higher than those seen in the tri-party repo market currently. Third, money market stress episodes are more likely when reserves are low relative to desired levels, just as lower excess reserves relative to banks' desired levels may have been a factor in the September 2019 stress in repo markets (Correa et al., 2020). Finally, the lack of predictability for British stocks suggests that a reliance on overnight financing and the lack of a lender of last resort likely contributed to greater volatility in U.S. money markets and the spillover of money market tightness to broader risk premia at the time.
References
Accominotti, Olivier, Delio Luceno-Piquero, and Stefano Ugolini. (2020). "Robust Money Markets: Lessons from the First Globalization," VoxEU.org. April 23, 2020.
Afonso, Gara, Marco Cipriani, Adam Copeland, Anna Kovner, Gabriele La Spada, and Antoine Martin. (2020). "The Market Events of Mid-September 2019," Federal Reserve Bank of New York Staff Report No. 918.
Anbil, Sriya, Alyssa Anderson, and Zeynep Senyuz. (2020). "What Happened in Money Markets in September 2019?" FEDS Notes. Washington: Board of Governors of the Federal Reserve System, February 27, 2020.
Avalos, Fernando, Torsten Ehlers, and Egemen Eren. (2019). "September Stress in Dollar Repo Markets—Passing or Structural?" BIS Quarterly Review December 2019: 12-14.
Correa, Ricardo, Wenxin Du, and Gordon Liao. (2020). "U.S. Banks and Global Liquidity," International Finance Discussion Papers 1289. Washington: Board of Governors of the Federal Reserve System, https://doi.org/10.17016/IFDP.2020.1289.
Hanson, Samuel, Andrei Shleifer, Jeremy Stein, and Robert Vishny. (2015). "Banks as Patient Fixed-Income Investors," Journal of Financial Economics 117(3): 449-469.
He, Zhiguo and Arvind Krishnamurthy. (2018). "Intermediary Asset Pricing during the Financial Crisis," Annual Review of Financial Economics 10: 173-197.
He, Zhiguo, Stefan Nagel, and Zhaogang Song. (2020). "Treasury Inconvenience Yields during the COVID-19 Crisis," NBER Working Paper No. 27416.
Hodrick, Robert J. (1992). "Dividend Yields and Expected Stock Returns: Alternative Procedures for Inference and Measurement," Review of Financial Studies 5(3): 357-386.
Jones, David, Yingyuan Chen, and Akihko Yokoyama. (2020). "Online Annex 1.1: Fragilities in US Dollar Short-Term Funding Markets," IMF Global Financial Stability Report.
Schrimpf, Andreas, Hyun Song Shin, and Vladyslav Sushko. (2020). "Leverage and Margin Spirals in Fixed Income Markets during the COVID-19 Crisis," BIS Bulletin No. 2.
Weiss, Colin. (2020). "Intermediary Asset Pricing during the National Banking Era," International Finance Discussion Papers 1302. Washington: Board of Governors of the Federal Reserve System, https://doi.org/10.17016/IFDP.2020.1302.
* Division of International Finance, Board of Governors of the Federal Reserve, email: [email protected]. I thank Shaghil Ahmed, Daniel Beltran, Carol Bertaut, Sally Davies, and Alexandra Tabova for helpful comments. The views expressed in this paper are solely those of the author and should not be interpreted as representing the view of the Board of Governors or anyone else associated with the Federal Reserve System. Return to text
1. Recent policy pieces include Afonso et al., Anbil et al. (2020), Avalos et al. (2019), Jones et al. (2020), and Schrimpf et al (2020). He et al. (2020) build a model to understand the link between funding constraints and Treasury yields, and Correa et al. (2020) study the role of large U.S. banks' excess reserves in their ability to provide dollar liquidity with a discussion of events in September 2019. Return to text
2. The median reserve-deposit ratio of the NYCH banks for the sample period I analyze was about 27 percent. Return to text
3. Hanson et al. (2015) note that commercial banks in the 19th century are more similar in their balance sheet structure to modern shadow banking institutions rather than modern commercial banks. For example, money market funds today have no liability insurance and no access to a lender of last resort. Both money market funds today and 19th century commercial banks have relatively liquid, short-maturity assets as a result (Hanson et al., 2015). Return to text
4. The quarterly forecasting results also hold regardless of what quarter of the year one studies. Return to text
5. Accominotti et al. (2020) discuss the structure of the London money market at the time and lessons it offers for modern money markets. Return to text
Weiss, Colin R. (2020). "Short-Term Funding Stresses and Asset Prices: Lessons from U.S. History," FEDS Notes. Washington: Board of Governors of the Federal Reserve System, November 09, 2020, https://doi.org/10.17016/2380-7172.2582.
Disclaimer: FEDS Notes are articles in which Board staff offer their own views and present analysis on a range of topics in economics and finance. These articles are shorter and less technically oriented than FEDS Working Papers and IFDP papers.