FEDS Notes
May 09, 2024
Stress Testing the Corporate Debt Servicing Capacity: A Scenario Analysis1
Dalida Kadyrzhanova, Ander Perez-Orive, and Eliezer Singer
The total volume of outstanding debt issued by U.S. nonfinancial firms relative to GDP has increased by about 8 percentage points in the past decade.2 While a growing volume of debt was largely viewed as benign in the low interest rate environment of the 2010s, the rapid increase in both short- and long-term rates since early 2022 has raised concerns about the debt-servicing capacity of the corporate sector. In this note, we assess the current vulnerabilities of U.S. nonfinancial public firms using projections of corporate interest coverage ratios (ICRs) under several macroeconomic scenarios.
The ICR—defined as the ratio of earnings before interest and taxes (EBIT) to interest expense—is a measure of the ability of a company to make interest payments using internal cash flows. The ICR incorporates information about effective borrowing rates directly, which makes it a timelier indicator in assessing vulnerabilities during periods of high interest rates relative to other commonly referenced ratios such as debt to income or debt to assets that primarily reflect changes in earnings or debt outstanding. The empirical corporate finance literature has used the ICR as a proxy for financial distress (Whited, 1992; Campello and Chen, 2010) and a vulnerability indicator for financial stability, as lower ratios are linked to higher probabilities of default (Chen et al., 2012; Brandão-Marques et al., 2022).
The aggregate ICR for all publicly listed nonfinancial firms—defined as total earnings over total interest expense—rose steadily since 2000 to reach historically high levels in early 2022 (Figure 1). With the steep increase in borrowing rates in the ensuing period, the aggregate ICR has declined somewhat but has, thus far, remained elevated by historical standards. Current ICRs remain high, due in part to the high proportion of fixed-rate debt among public firms, which slows the pass-through of higher interest rates to interest expense.3
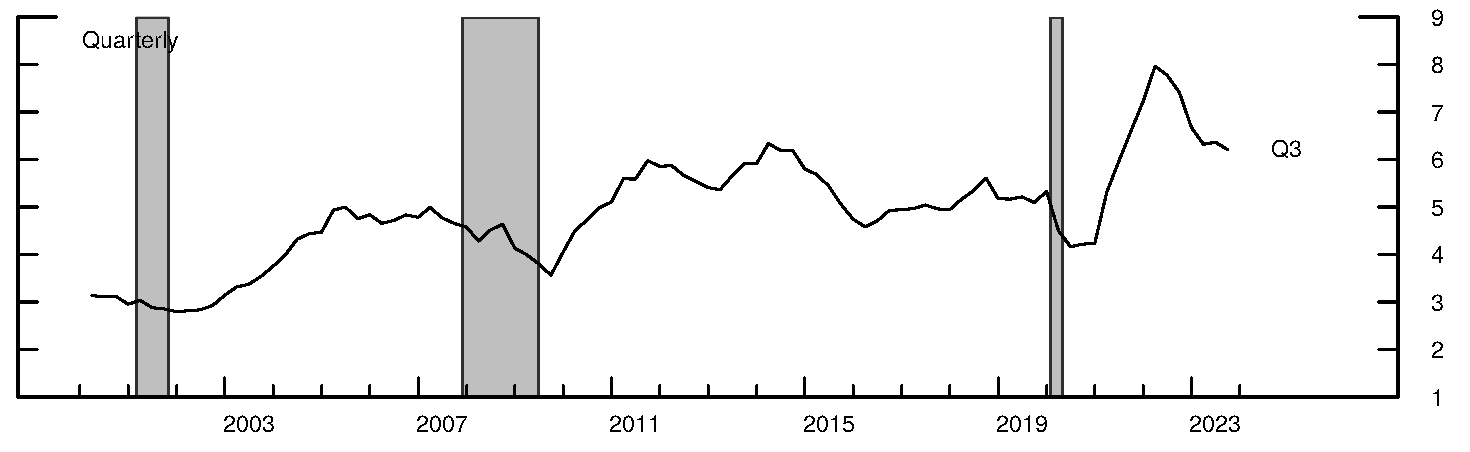
Note: Aggregate ICR = Aggregate EBIT/Aggregate interest expense. Sample includes nonfinancial firms with positive book value of debt and positive interest expense. Three shaded regions in order from left to right showing NBER recessions: March 2001-November 2001, December 2007-June 2009, and February 2020-April 2020.
Source: Compustat.
To quantify the potential vulnerability of public nonfinancial firms to adverse shocks, including persistently elevated interest rates or a near-term severe downturn, we simulate the future path of the aggregate ICR over the next three years under a baseline and two adverse macroeconomic scenarios from Moody's Analytics U.S. Macro Forecast database. Our projections explicitly incorporate the most recent data on public firms' debt structure and maturity wall, allowing us to account for the volume of fixed-rate debt maturing in the medium-term. To better capture the vulnerabilities of smaller, more indebted firms, we also project two more targeted measures of corporate vulnerability: (i) the aggregate ICR for the subset of non-investment-grade (non-IG) firms and (ii) the percent of debt held by firms with an ICR below 2.
We find that the debt-servicing capacity of the U.S. public corporate sector as a whole is robust to sustained elevated interest rates, both in the soft landing (baseline) scenario as well as in a stagflation scenario with a moderate economic downturn. Indeed, absent a severe downturn with a sharp decline in earnings, which would lead to a substantial deterioration in the projected aggregate ICR to levels similar to those observed in the 2008-09 and 2020 recessions, public firms' aggregate debt servicing capacity is likely to remain robust in the near- to medium-term, even for the subset of non-IG firms. This resiliency is due, in large part, to the strong balance sheets of public firms—namely, low borrowing costs on existing debt and moderate refinancing needs in the short run. In the distribution of firms, however, persistently higher interest rates are projected to result in a meaningful deterioration in the credit quality of firms with weaker balance sheets, including some large investment-grade (IG) firms that have so far been relatively insulated from rising rates by their high share of fixed-rate debt. Accordingly, the share of debt at risk is likely to see sustained increase over the next two to three years even if earnings remain resilient.
Methodology
This section describes how we project the aggregate ICR and the share of debt-at-risk under alternative macroeconomic scenarios. The sample consists of U.S. nonfinancial corporations included in the Compustat database reporting positive book value of debt and quarterly interest expense.4 For both the aggregate ICR and the share of debt-at-risk, we compute the historical series from 2000:Q1 until 2023:Q3 and project their evolution over the next three years, through 2026:Q3, all at the quarterly frequency.
Macroeconomic scenarios
Our analysis assesses corporate ICRs under three Moody's scenarios: baseline, stagflation, and severely adverse. Each scenario includes projections of corporate earnings growth, Treasury yields, bond spreads, the federal funds rate, and the growth of corporate bonds and loans outstanding, among other macroeconomic and financial variables.5 Moody's scenarios are developed as equilibrium aggregate outcomes under different assumptions for the paths of future macroeconomic shocks. As such, our projections using these scenarios incorporate the general equilibrium feedback between key macroeconomic variables, including corporate sector vulnerabilities.
The baseline scenario envisions modest economic growth through mid-2025, followed by a slight acceleration. Long-term interest rates are projected to remain stable at roughly current levels, while short-term rates gradually decline starting in the second half of 2024 as inflation returns closer to the Fed's target. In the stagflation scenario, both short- and long-term interest rates rise further as inflation reaccelerates in the near term, which eventually pushes the economy into a recession. Finally, in the severely adverse scenario, the economy experiences a severe recession through the first half of 2025. Short-term interest rates decline to near zero by the end of 2025 as inflation falls below the Fed's target. Corporate bond yields, however, increase significantly in the near term, as the downturn brings about a widening in corporate spreads. In all scenarios, the aggregate volume of corporate bonds outstanding is little changed, while corporate loan growth is highly procyclical, falling sharply during recessions, consistent with tighter bank lending standards in downturns.
Projection of the aggregate ICR
Our analysis of the aggregate ICR is conducted over the entire sample of U.S. public nonfinancial firms and over the subset of non-IG firms. We compute the projected aggregate ICR for the chosen group of firms as the ratio of the projected combined earnings to the projected combined interest expense of all firms in the group. As in McCoy et al. (2020), we account for the high share of fixed-rate debt among nonfinancial public firms and allow for the gradual transmission of higher borrowing rates into borrowers' interest expense as they roll over maturing debt.
Projected earnings are the result of applying the national income and product accounts (NIPA) profits growth rate forecast from each Moody's scenario to the combined earnings in the baseline quarter, 2023:Q3, for each group of firms. To account for differential sensitivities to aggregate growth, we adjust NIPA profit growth rates from the scenario forecast by a multiplier based on the historical relationship of each group's earnings to total NIPA profits. This adjustment accounts, for example, for the high historical elasticity of the earnings of non-IG firms to aggregate fluctuations. To remove seasonality in quarterly earnings, we use the 4-quarter trailing moving average EBIT in our calculations.
Future aggregate interest expense is projected as the sum of initial interest expense and the forecast changes to quarterly interest payments, based on the projected changes in interest rates and in outstanding debt under each macroeconomic scenario. We compute projected changes in interest payments separately for floating- and fixed-rate instruments to account for the fact that interest rate changes affect only the maturing portion of fixed-rate debt. We use Capital IQ to gather data on the composition of the aggregate nonfinancial public corporate stock of debt by instrument type (corporate bonds or bank loans), both for all firms and by credit category (IG, non-IG). In addition, we use information on the maturity structure of corporate bonds from Mergent's FISD to project the precise amounts of IG and non-IG bonds maturing each quarter. The projected changes in outstanding fixed- and floating- rate debt are provided by Moody's.
Projected changes in the floating-rate portion of the aggregate interest expense arise from changes in corporate loan interest rates and changes in the total outstanding loan volume. We assume that all loans have floating rates and that their rates reset immediately following changes to their reference rate, our proxy for which is the federal funds rate. Loans are assumed to roll over upon maturity at the same loan spread over the prevailing federal funds rate.6 The volume of outstanding corporate bank loans is assumed to grow proportionally to the volume of outstanding bank C&I loans under each Moody's scenario.
We project the interest expense from corporate bonds separately by rating category (IG, high yield, or unrated) as the sum of the change in interest expense from rolled-over maturing bonds and the additional interest expense from newly issued corporate bonds. We assume that all bonds have fixed rates and are rolled over at par value.7 To compute the change in interest expense from bonds that are rolled over, we compare, within each rating category, the yield projected to prevail at the time of rollover with the yield at the time the maturing bonds were issued. Aggregate interest expense can also fluctuate with changes in the total volume of outstanding corporate bonds in each quarter. Declines in the volume of bonds represent bonds that mature without being rolled over, while increases capture the volume of newly issued corporate bonds. We assume the yield on all newly issued corporate bonds is equal to the yield projected to prevail at the time of issuance, by rating category.
Projection of the distribution of ICRs
The percent of outstanding debt-at risk (ICR<2) is projected by forecasting ICRs at the firm level across all firms in the sample. Firm-level ICRs are projected using the same approach described above. Starting with each firm's current (2023:Q3) level of debt, total interest expense, and earnings, we distinguish between IG and non-IG firms and use the same assumptions for the earnings growth rate, floating debt share, and maturity wall of fixed-rate debt as in the projection of aggregate ICR by rating grade. We then calculate the percent of debt below a threshold ICR as the total volume of debt held by firms with an ICR below the threshold divided by the projected volume of total outstanding debt in each quarter.
Main Insights
Aggregate ICR
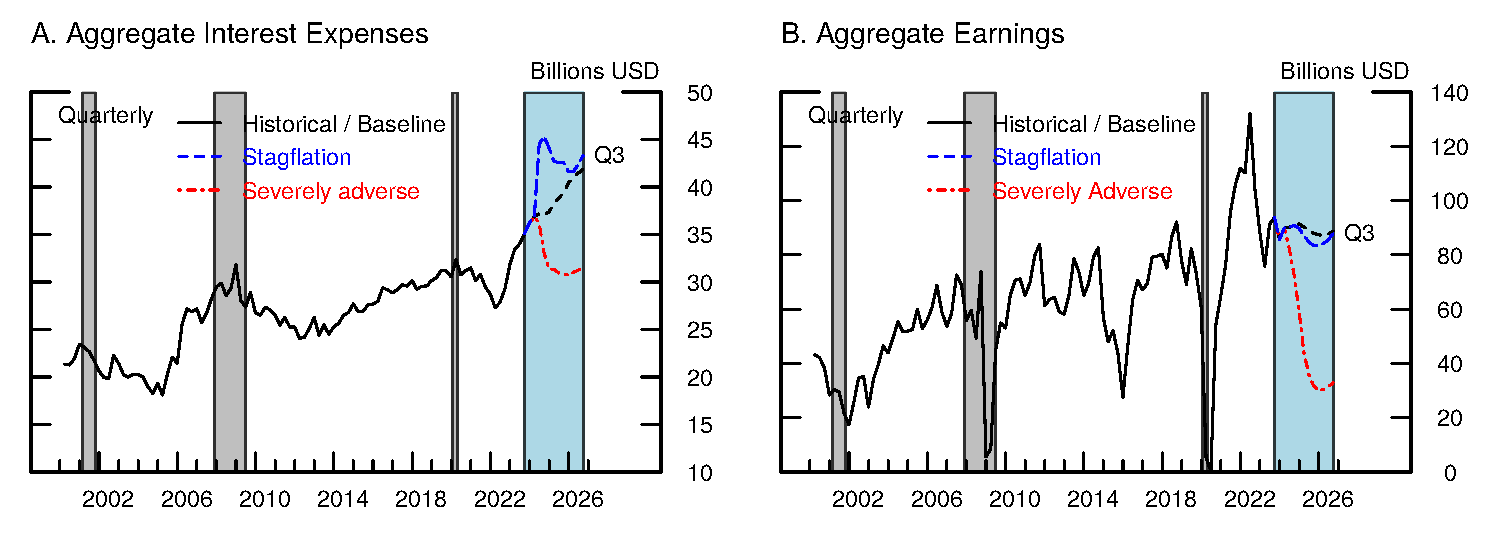
Figure 2 shows the results of our projections of the aggregate ICR across all U.S. public nonfinancial firms. Figures 3a and 3b decompose the projected aggregate ICR into projections of aggregate interest expense and aggregate earnings, respectively. The baseline scenario is shown in the black dotted line, the severely adverse scenario in the red dash-dotted line, and the stagflation scenario in the blue dashed line.
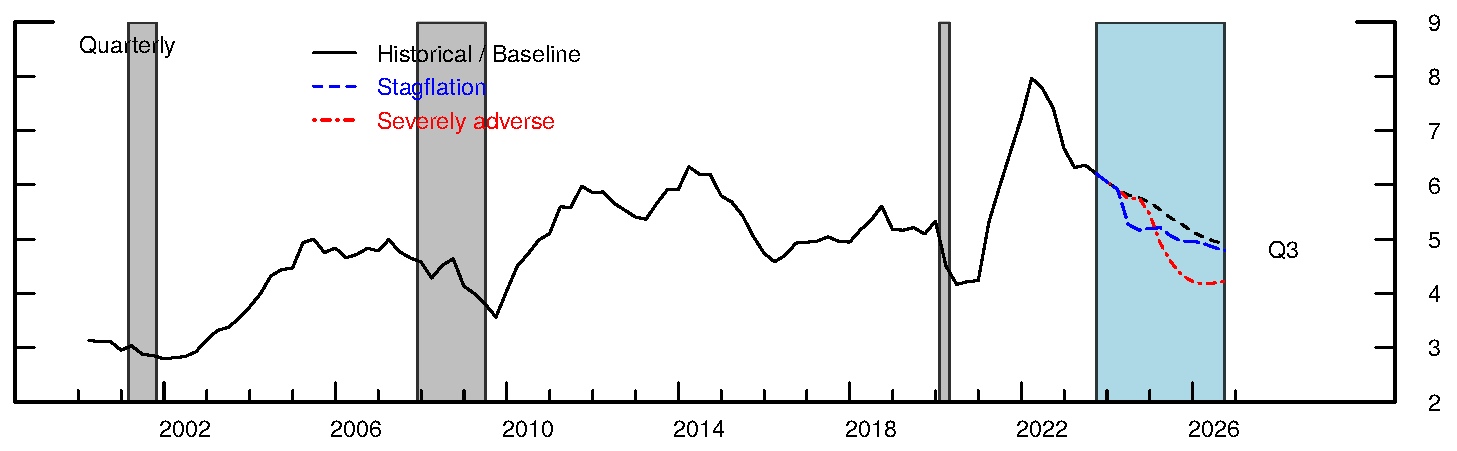
Note: ICR = Aggregate EBIT/Aggregate interest expense. Sample includes nonfinancial firms with positive book value of debt and positive interest expense. Four shaded regions in order from left to right, first three gray shaded regions showing NBER recessions: March 2001-November 2001, December 2007-June 2009, and February 2020-April 2020. Final blue shaded region showing projection horizon: 2023 Q4 – 2026 Q3.
Source: Compustat; Capital IQ; Moody's Analytics Inc.; Mergent's FISD; S&P Ratings; staff calculations.
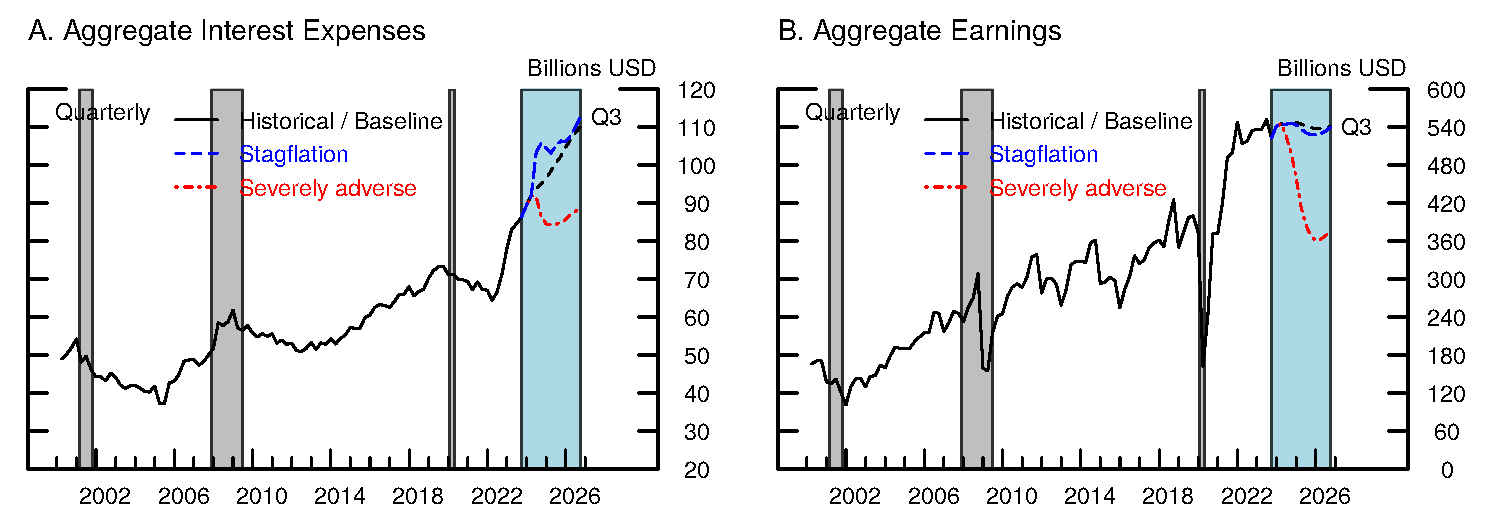
Note: Sample includes nonfinancial firms with positive book value of debt and positive interest expense. Four shaded regions in order from left to right, first three gray shaded regions showing NBER recessions: March 2001-November 2001, December 2007-June 2009, and February 2020-April 2020. Final blue shaded region showing projection horizon: 2023 Q4 – 2026 Q3.
Source: Compustat; Capital IQ; Moody's Analytics Inc.; Mergent's FISD; S&P Ratings; staff calculations.
In the baseline Moody's scenario, both short- and long-term interest rates remain close to their current elevated levels for most of the forecast horizon, leading to a steady increase in the aggregate interest expense that comes solely from the rollover of maturing fixed-rate debt at higher yields (black dotted line in Figure 3a). Indeed, by the end of the projection horizon, around 40% of outstanding corporate bonds will have been issued after the current tightening cycle began in early 2022, with yields in the 4-6% range. Despite the gradually increasing debt-servicing burden, the aggregate ICR remains robust, declining gradually over the forecast horizon to about its pre-pandemic level (black dotted line in Figure 2), due to the resilience in aggregate earnings (black dotted line in Figure 3b).
A sharp increase in interest rates in the near term, as modeled in Moody's stagflation scenario, would have a more immediate negative impact on the aggregate ICR. As shown in Figure 3a (blue dashed line), aggregate interest expense would rise steeply by 2024:Q2, driven by a sharp increase in interest on floating-rate debt in the wake of reaccelerating inflation that brings about a steep increase in policy rates. In this scenario, the aggregate ICR would fall rapidly, as interest expense soars, and then more gradually, as interest rates stabilize. However, the sharply higher interest rates and the following mild earnings recession would not be sufficient to push the aggregate ICR to concerning levels; the aggregate debt-servicing capacity of the nonfinancial sector would remain healthy by historical standards, converging roughly to its levels just prior to the onset of the COVID-19 pandemic.
The aggregate debt-servicing capacity is substantially more vulnerable to a severe earnings downturn, as modeled in the severely adverse scenario (red dash-dotted line in Figure 3b). In this scenario, the aggregate ICR drops to levels comparable to the trough of the COVID-19 pandemic, though not as low as in the 2008-09 recession (red dash-dotted line in Figure 2). Aggregate interest expense would also decline from its current levels, as the deep recession is expected to bring about a steep drop in short-term rates and a sizable decline in bank lending (red dash-dotted line in Figure 3a). Bond yields remain high throughout the recession; however, the additional expense firms incur from rolling over maturing bonds will be outweighed by the reduced expense on floating rate debt. The decline in aggregate interest expense dampens the severity of the decline in the aggregate ICR but is not enough to fully offset it.
Risky borrowers' ICR
The evolution of the aggregate ICR is heavily influenced by large, IG firms that benefit from low borrowing costs on existing debt and limited refinancing needs in the short run, as well as moderate earnings volatility. We next turn to projections of the aggregate ICR for the subset of non-IG firms (non-IG ICR) to examine the vulnerabilities of riskier borrowers. These firms are generally smaller, have a relatively high share of floating-rate debt (35%), and a shorter maturity of fixed-rate debt than IG firms, which increases the sensitivity of their interest expense to changes in short-term rates.8 Their earnings are more exposed to business cycle downturns, which makes them particularly vulnerable. Figure 4 plots the projections of the non-IG ICR, with the baseline scenario shown in the black dotted line, the severely adverse scenario in the red dash-dotted line, and the stagflation scenario in the blue dashed line. Figures 5a and 5b decompose the projected non-IG ICR under the three scenarios into this group's projected evolution of total interest expense and earnings, respectively.
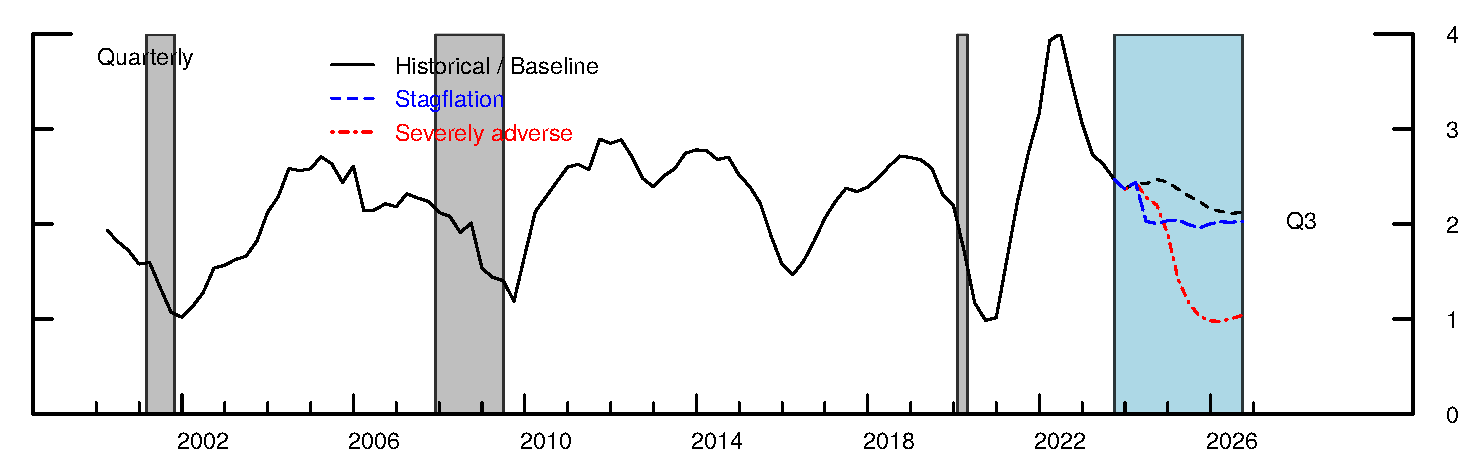
Note: ICR = Aggregate EBIT/Aggregate interest expense. Sample includes nonfinancial firms with positive book value of debt and positive interest expense. Four shaded regions in order from left to right, first three gray shaded regions showing NBER recessions: March 2001-November 2001, December 2007-June 2009, and February 2020-April 2020. Final blue shaded region showing projection horizon: 2023 Q4 – 2026 Q3.
Source: Compustat; Capital IQ; Moody's Analytics Inc.; Mergent's FISD; S&P Ratings; staff calculations.
Figure 5. Aggregate Interest Expense and Earnings of U.S. Public Non-Investment Grade Nonfinancial Firms
Note: Sample includes nonfinancial firms with positive book value of debt and positive interest expense. Four shaded regions in order from left to right, first three gray shaded regions showing NBER recessions: March 2001-November 2001, December 2007-June 2009, and February 2020-April 2020. Final blue shaded region showing projection horizon: 2023 Q4 – 2026 Q3.
Source: Compustat; Capital IQ; Moody's Analytics Inc.; Mergent's FISD; S&P Ratings; staff calculations.
As with the aggregate ICR, we find that the debt-servicing capacity for the subset of non-IG firms remains robust in the baseline and stagflation scenarios. In the baseline scenario, short-term rates peak at their current range, which implies that any additional increase in projected interest expense comes from rollover of fixed-rate debt as it comes due. Since non-IG firms have a lower share of fixed-rate debt, their total interest expense increases proportionally less in the baseline scenario than the aggregate despite a higher percentage of non-IG bonds rolling over during the next 12 quarters—40% as opposed to 30% for all nonfinancial firms (Figure 5a, black dotted line). Accordingly, the non-IG ICR declines by less than the aggregate (black dotted line in Figure 4).
In the stagflation scenario, depicted in the blue dashed line in Figure 4, the higher share of floating-rate debt among non-IG firms means that the additional increases to policy rates envisioned in that scenario have a larger impact on total interest expense for the group (Figure 5a, blue dashed line), producing a sharper near-term decline in the non-IG ICR. However, even with the sharp increase in interest rates envisioned in this scenario, the debt-servicing capacity of the non-IG sub aggregate remains resilient throughout the forecast horizon, remaining near the middle of its historical range.
Under the severely adverse downturn scenario, the more pronounced procyclicality of non-IG firms' earnings induces a proportionally higher decline in the non-IG ICR relative to the aggregate, reaching levels similar to what prevailed during the Great Recession, the COVID-19 outbreak, or the aftermath of the 2001 recession (red dash-dotted line in Figure 4). The heightened vulnerability of non-IG firms to such a downturn is consistent with past economic contractions and occurs despite the projected reduction in non-IG interest expense during the recession. As seen in Figure 5b, total earnings of non-IG firms drop precipitously, falling well below pre-pandemic levels (although not as low as in the COVID-19 recession). At the same time, total interest expense of non-IG firms (Figure 5a, red dash-dotted line) drops proportionally more than the aggregate, reflecting a higher sensitivity of non-IG firms' interest expense to both the reduction in short-term interest rates and the volume of outstanding loans projected in this scenario. That said, the widening of spreads on speculative-grade bonds partially offsets this effect, and the overall reduction in interest expense is far less than that of earnings.
Share of debt at risk
While both the aggregate and the non-IG ICRs remain robust under the baseline and the stagflation scenarios, those firms with weaker balance sheets are of course vulnerable to the higher interest rates in these scenarios. Indeed, our projections of the distribution of ICRs across firms show that the percent of debt held by firms with ICRs below 2 (share of debt-at-risk) would expand in all three Moody's scenarios (Figure 6).
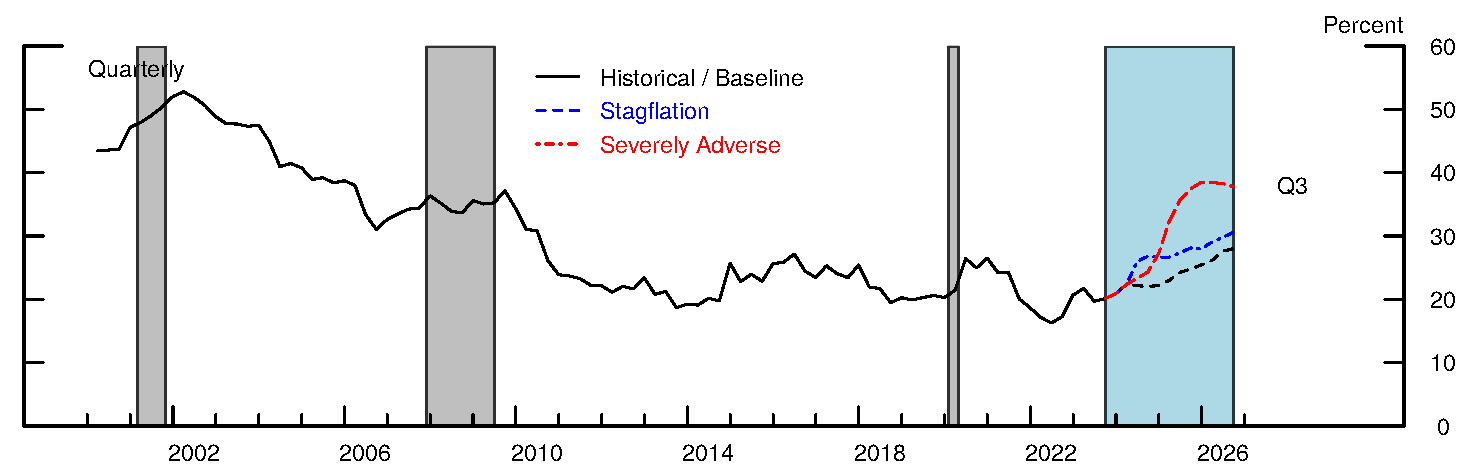
Note: The percent of debt at risk is the percent of debt with ICR < 2. Sample includes nonfinancial firms with positive book value of debt and positive interest expense. Four shaded regions in order from left to right, first three gray shaded regions showing NBER recessions: March 2001-November 2001, December 2007-June 2009, and February 2020-April 2020. Final blue shaded region showing projection horizon: 2023 Q4 – 2026 Q3.
Source: Compustat; Capital IQ; Moody's Analytics Inc.; Mergent's FISD; S&P Ratings; staff calculations.
Under the baseline scenario, depicted in the black dashed line, the share of debt-at-risk gradually increases to 28% by 2026:Q3, reaching the levels observed at the pandemic peak. In this scenario, both interest rates and corporate earnings remain roughly unchanged over the forecast horizon, resulting in a gradual deterioration in ICRs that comes almost entirely from increased interest expense on fixed-rate debt. Accordingly, more than two-thirds of the volume of debt classified as vulnerable by this criterion is owed by IG firms, which tend to have both a high share of fixed-rate debt and large volumes of total outstanding debt. This outcome is notable given that, currently, debt of IG firms accounts for only about a quarter of public firms' total debt at risk. Thus, if long-term interest rates remain elevated relative to their pre-pandemic levels, vulnerabilities are likely to begin to emerge among some large IG firms that have previously had robust debt-servicing capacity, as growing interest payments on fixed-rate debt will start weighing more heavily on their balance sheets.
As with the aggregate ICR, a sharp increase in interest rates under the stagflation scenario would have a more immediate impact on the percent of debt at risk. The additional modest increase in the share of debt at risk over that of the baseline scenario comes mostly from higher interest expense of non-IG firms that have a high share of floating rate debt and are particularly impacted by further increases in short-term interest rates and higher spreads on non-IG bonds in the stagflation scenario. In the severely adverse scenario, the percent of debt at risk increases sharply, reaching almost 40% by the end of 2024. This is substantially higher than at any point since the Great Recession of 2007, including during the COVID-19 recession. Consistent with the path of the aggregate non-IG ICR, the steep increase in the share of debt-at-risk reflects the vulnerability of small- to middle-market non-IG firms to a sizable recession. Almost 90% of the additional increase in the percent of debt at risk over the baseline scenario in the severely adverse scenario comes from non-IG firms.
Conclusion
Both short- and long-term interest rates rose steeply since early 2022, raising concerns about the nonfinancial corporate sector's debt-servicing capacity. Using the ICR—an indicator of debt-servicing capacity—we assess the vulnerabilities of U.S. nonfinancial public firms to a few macroeconomic scenarios featuring either continued elevated interest rates or a severe decline in corporate earnings.
We find that aggregate corporate ICRs, measured across all public firms as well as in the subset of risky public firms, are likely to remain resilient to sustained elevated borrowing costs as long as the economy avoids a severe downturn with a sharp decline in corporate earnings. This resiliency stems mostly from moderate refinancing needs in the near future. A severe recession, however, would bring public firms' debt-servicing capacity to concerning levels, especially among risky firms, whose aggregate ICR could drop below the lows reached in the Great Financial Crisis and the COVID-19 recession. And while debt-servicing capacity is robust in the aggregate, persistently higher interest rates are likely to bring about a substantial deterioration in the debt servicing capacity for a number of vulnerable firms with weaker balance sheets, including some with IG debt.
References
Brandão-Marques, Luis, Qianying Chen, Claudio Raddatz, Jerome Vandenbussche, and Peichu Xie (2022). "The Riskiness of Credit Allocation and Financial Stability," Journal of Financial Intermediation, vol. 51 (July), 100980.
Campello, Murillo, and Long Chen (2010). "Are Financial Constraints Priced? Evidence from Firm Fundamentals and Stock Returns," Journal of Money, Credit and Banking, vol. 42 (September), pp. 1185–98.
Capital IQ, S&P Global Market Intelligence Capital IQ Platform, Wharton Research Data Services.
Compustat, S&P Global Market Intelligence Compustat XpressFeed North America, Historical, and Research Quarterly PDE, Wharton Research Data Services.
Chen, Huafeng, Marcin Kacperczyk, and Hernan Ortiz-Molina (2012). "Do Nonfinancial Stakeholders Affect the Pricing of Risky Debt? Evidence from Unionized Workers," Review of Finance, vol. 16 (April), pp. 347–83.
McCoy, Jack, Francisco Palomino, Ander Perez-Orive, Charles Press, and Gerardo Sanz-Maldonado (2020). "Interest Coverage Ratios: Assessing Vulnerabilities in Nonfinancial Corporate Credit." FEDS Notes. Washington: Board of Governors of the Federal Reserve System.
Mergent, Inc., Mergent Corporate FISD Daily Feed (FITF), http://www.ftserussell.com/financial-data/fixed-income-data.
Moody's Analytics, Inc. U.S. Macro Forecast Database.
Ogden, Richard, Francisco Palomino, Nitish Sinha, and Youngsuk Yook (2016). "Corporate Bond Issuers' Swap Exposure to Rising Interest Rates," FEDS Notes. Washington: Board of Governors of the Federal Reserve System.
Standard & Poor's Credit Ratings, Global Issuers and Structured Finance.
Whited, Toni M. (1992). "Debt, Liquidity Constraints, and Corporate Investment: Evidence from Panel Data," Journal of Finance, vol. 47 (September), pp. 1425–60.
Xu, Qiping (2018). "Kicking Maturity Down the Road: Early Refinancing and Maturity Management in the Corporate Bond Market," Review of Financial Studies, vol. 31 (August), pp. 3061–97.
Appendix: Details on Moody's scenarios
| Moody's Scenario | Date | FFR (%) | Yield on BBB corp. bond index (%) | Yield on HY corp. bond index (%) | NIPA profits growth (%, AR) |
|---|---|---|---|---|---|
| Baseline | 2023 Q4 | 5.3 | 6.2 | 8.3 | 5.1 |
| 2024 Q1 | 5.3 | 5.8 | 7.6 | 7.2 | |
| 2024 Q2 | 5.1 | 6.1 | 8.0 | -0.8 | |
| 2024 Q3 | 4.7 | 6.3 | 8.4 | -1.9 | |
| 2024 Q4 | 4.5 | 6.3 | 8.8 | -3.1 | |
| 2025 Q1 | 4.3 | 6.3 | 8.9 | -2.6 | |
| 2025 Q2 | 4.1 | 6.3 | 9.0 | -2.0 | |
| 2025 Q3 | 3.8 | 6.3 | 9.0 | -1.4 | |
| 2025 Q4 | 3.8 | 6.2 | 9.0 | 1.0 | |
| 2026 Q1 | 3.5 | 6.2 | 9.0 | 1.2 | |
| 2026 Q2 | 3.3 | 6.1 | 8.9 | 3.1 | |
| 2026 Q3 | 3.0 | 6.1 | 8.9 | 3.6 | |
| Stagflation | 2023 Q4 | 5.3 | 6.2 | 8.3 | 5.1 |
| 2024 Q1 | 5.3 | 5.8 | 7.6 | 7.2 | |
| 2024 Q2 | 8.1 | 9.6 | 13.8 | -0.5 | |
| 2024 Q3 | 8.1 | 10.0 | 14.4 | -5.4 | |
| 2024 Q4 | 7.4 | 8.4 | 13.0 | -9.1 | |
| 2025 Q1 | 6.1 | 7.7 | 12.2 | -5.9 | |
| 2025 Q2 | 5.3 | 7.4 | 12.0 | 2.0 | |
| 2025 Q3 | 4.7 | 6.8 | 10.9 | 1.7 | |
| 2025 Q4 | 3.7 | 6.3 | 9.8 | 2.2 | |
| 2026 Q1 | 3.3 | 6.1 | 9.3 | 1.1 | |
| 2026 Q2 | 3.0 | 5.8 | 8.7 | 7.4 | |
| 2026 Q3 | 2.9 | 5.5 | 8.2 | 9.4 | |
| Severely Adverse | 2023 Q4 | 5.3 | 6.2 | 8.3 | 5.1 |
| 2024 Q1 | 5.3 | 5.8 | 7.6 | 7.2 | |
| 2024 Q2 | 5.1 | 6.1 | 11.4 | -48.3 | |
| 2024 Q3 | 4.1 | 7.4 | 15.5 | -36.2 | |
| 2024 Q4 | 3.3 | 6.3 | 11.9 | -34.4 | |
| 2025 Q1 | 2.7 | 5.7 | 10.6 | -25.0 | |
| 2025 Q2 | 2.0 | 5.5 | 9.9 | -11.0 | |
| 2025 Q3 | 1.4 | 5.3 | 9.0 | 1.0 | |
| 2025 Q4 | 0.9 | 5.4 | 8.6 | 7.6 | |
| 2026 Q1 | 0.6 | 5.4 | 8.4 | 9.0 | |
| 2026 Q2 | 0.4 | 5.4 | 8.2 | 9.0 | |
| 2026 Q3 | 0.3 | 5.4 | 8.0 | 9.9 |
1. Federal Reserve Board of Governors. We would like to thank Andrea Ajello, Giovanni Favara, Dino Palazzo, Francisco Palomino, Steve Sharpe, Gustavo Suarez, Jie Yang, and CM Brownbag participants for helpful comments and suggestions. Diego Silva provided excellent research assistance. The analysis and conclusions presented in the note are those of the authors and do not reflect the views of the Board of Governors or the Federal Reserve staff. Version date: March 20, 2024. Return to text
2. The nonfinancial corporate business debt to GDP ratio has increased from about 42% in 2012 to over 50% by early 2022. Public firms account for about 60% of total U.S. nonfinancial corporate business debt. Source: Financial Accounts of the United States; Compustat. Return to text
3. In contrast to interest on floating-rate debt, which is tied to a reference rate and adjusts quickly to changes in short-term interest rates, interest expense on fixed-rate debt reflects higher rates only when borrowers roll over maturing fixed-rate debt. The majority (80%) of outstanding debt from U.S. nonfinancial public firms is fixed rate (Source: Capital IQ). Firms can, in principle, hedge against interest rate changes by using derivatives contracts to convert their debt from floating to fixed, or vice versa. However, the use of such derivatives among public nonfinancial corporations is limited; see Ogden et al. (2016). Return to text
4. In addition to financials, our sample excludes firms with SIC code 99 ("Unclassified establishments"). Return to text
5. Details of the three Moody's scenarios (as of February 2024) for the key series in our projections are in the Appendix. Return to text
6. We keep spreads over the reference rate for bank loans constant, an approximation supported by the empirical evidence. Return to text
7. To account for early refinancing among speculative-grade issuers, we assume that their bonds are rolled over one year prior to stated maturity. This is a conservative approach to modeling maturity management as most speculative-grade bonds are redeemed earlier than one year before maturity (Xu, 2018). By contrast, most IG issuers do not redeem early. Therefore, in a similarly conservative approach we assume that all IG bonds will be rolled over at maturity. Return to text
8. Moreover, in unreported forecasting regressions, we find that the risky borrowers' ICR has a stronger ability to forecast future economic activity than the aggregate ICR. Return to text
Kadyrzhanova, Dalida, Ander Perez-Orive, and Eliezer Singer (2024). "Stress Testing the Corporate Debt Servicing Capacity: A Scenario Analysis," FEDS Notes. Washington: Board of Governors of the Federal Reserve System, May 09, 2024, https://doi.org/10.17016/2380-7172.3481.
Disclaimer: FEDS Notes are articles in which Board staff offer their own views and present analysis on a range of topics in economics and finance. These articles are shorter and less technically oriented than FEDS Working Papers and IFDP papers.