FEDS Notes
August 10, 2017
Synthetic ETFs
Sirio Aramonte, Cecilia Caglio, and Tugkan Tuzun
Summary
Exchange traded funds (ETFs) achieve their investment objectives by either owning a portfolio of securities (physical ETFs) or entering into swap agreements that deliver the returns of pre-specified indexes (synthetic ETFs). Because a swap is collateralized with a portfolio of securities that are generally different than the securities in the benchmark referenced by the ETF, the level of collateralization is important to protect investors against losses in case ETF counterparty did not honor the swap contract. In this note, we provide an overview of how synthetic ETFs work and analyze collateralization levels for a group of synthetic ETFs that voluntarily report their collateral baskets. Our analysis shows that these ETFs are overcollateralized, on average, by about 2%. We find that collateralization levels decline slightly as financial markets become more volatile, in particular when the ETF manager is affiliated with the swap counterparty.
1. Synthetic ETFs: an overview
ETFs are pooled investment vehicles that, unlike mutual funds, are listed on exchanges and can be traded intra-daily. ETFs normally track a benchmark index, and can be classified as physical or synthetic ETFs depending on how they replicate their benchmark. Physical ETFs can purchase the same securities that are included in the benchmark, or can replicate the benchmark according to statistical techniques that allow to purchase and trade fewer and more liquid securities. Synthetic ETFs do not hold securities, but enter a total return swap with financial institutions that promises to pay the return on the benchmark to the ETF. The swap is collateralized with a portfolio of securities to which the ETF has access in case the swap counterparty defaulted on its obligations. Importantly, the securities in the collateral basket are generally different than the securities in the benchmark referenced by the ETF. Hence, the level of collateralization -- the market value of the collateral basket -- is important to protect investors against losses in case ETF counterparty does not honor the swap contract. While we mainly focus on the level of collateralization, other characteristics, such as liquidity and credit quality could differ between the ETF benchmark and the collateral basket. If the credit quality or liquidity of the collateral assets is lower than the ETF benchmark assets, this difference could pose additional risks to the ETF investors.
Note that only a small number of asset managers issue synthetic ETFs in the United States. The reason is that, starting in 2010, the U.S. Securities and Exchange Commission has not allowed the launch of new synthetic ETFs, unless an asset manager was already sponsoring synthetic ETFs before 2010.1 However, our sample does not have collateral or counterparty information for US synthetic ETFs. As we explain later, counterparty affiliation is important to explain the dynamics of collateralization. Unlike in Europe, financial entities in US including ETFs, cannot enter into a swap contract with an affiliated party, helping to ease some of the concerns about US synthetic ETFs.
2. Types of Synthetic ETFs
There are two main structures used for synthetic ETFs: unfunded and funded. Under the unfunded swap model, the issuer of the ETF creates new shares in exchange for cash from the authorized participant (as opposed to the typical in-kind process for the physical ETF) and enters into a total return swap with a counterparty. The ETF issuer uses the investors' cash to buy a basket of securities (substitute basket or collateral basket) from the swap counterparty, which promises to deliver the return of the reference index (minus a swap fee, if applicable). In exchange, the swap counterparty receives the return generated by the substitute basket. Under this structure, the ETF issuer owns the assets in the substitute basket and can immediately liquidate them if the swap counterparty defaults.2
In the funded swap model, the shares of the ETF are created in the same way, as the issuer transfers the cash received from investors to a swap counterparty, but the collateral basket is placed into a segregated account with an independent custodian, rather than being owned by the ETF.
Unlike in the United States, European financial entities, including ETFs, can enter into a swap contract with an affiliated party. This arrangement raises the issue of potential conflicts of interest between ETF investors, who expect the swaps underlying their ETFs to be properly collateralized, and ETF asset managers, who may be more willing to accept lower quality collateral when the swap counterparty is part of the same corporate group.
Importantly, the collateral posted by the ETF swap counterparty does not necessarily have to track the ETF benchmark. Even the asset classes included in the collateral can differ from those in the benchmark. The securities included in the substitute basket are not the constituents of the reference index but they are typically highly correlated with them. In a few cases, synthetic ETFs that reference different benchmarks can be collateralized by portfolios with the same composition.
According to a survey recently published by Morningstar,3 since 2014 there has been a drift away from synthetic replication, with the total AUM for European ETP dropping to 20% at the end of 2016 from around 45% in the previous two years. The change is partially attributable to the release of a Consultative Document4 by the Financial Stability Board (FSB) in 2011. The report highlighted the potential financial stability issues arising from synthetic ETFs, and pointed out that there could be incentive misalignments in the management of collateral when the ETF sponsor and the swap counterparty are affiliated.
3. Sample
After the publication of the FSB Consultative Document in 2011, several synthetic ETFs issuers started to voluntarily report their collateral baskets on their own websites or directly to data providers such as Markit. Markit collects this collateral basket information from non-US synthetic ETFs sponsored by Amundi, ComStage, Deutsche Bank, ETF Securities Limited, Ossiam, Société Générale. The data contain collateral information for the reporting ETF issuer, collateralization level and swap counterparty identifier.
Figure 1 plots the net assets of all global ETFs and the net assets of global synthetic ETFs in our sample from November 26, 2014 to September 16, 2016. Synthetic-ETF net assets remained steady around $75 billion, which represents about 2% of all global ETFs.
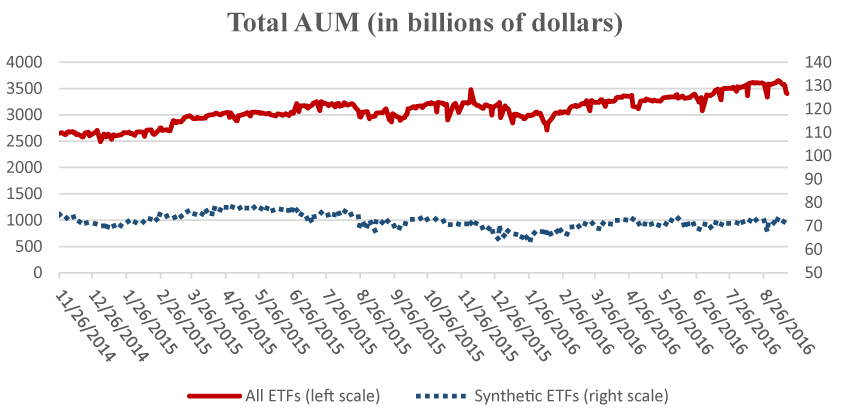
Source: IHS Markit, SOLA.
As shown in Table 1, there are, on average, 899 synthetic ETFs with $75.5 billion worth of assets under management in our sample. The vast majority are domiciled in Europe, where they account for about 20% of ETF assets. Our sample accounts for slightly more than half of the assets managed by European synthetic ETFs, and it is about twice the size of the synthetic ETF sample ($37.9 billion) in Hurlin, Iseli, Perignon and Yeung (2017). It is also covers a longer time period.
Table 1: All ETFs
| Full Sample | Synthetic | Funded | Unfunded | |||||
|---|---|---|---|---|---|---|---|---|
| Count | Net Assets ($bil) | Count | Net Assets ($bil) | Count | Net Assets ($bil) | Count | Net Assets ($bil) | |
| Total | 5,718 | 3,026.05 | 899 | 75.55 | 416 | 16.51 | 483 | 59.04 |
| Region | ||||||||
| Americas | 2,343 | 2,344.98 | - | - | - | - | - | - |
| Europe | 2,485 | 427.88 | 855 | 74.22 | 394 | 15.74 | 461 | 58.48 |
| APAC | 790 | 245.66 | 44 | 1.33 | 22 | 0.77 | 22 | 0.56 |
| Middle East & Africa | 100 | 7.53 | - | - | - | - | - | - |
| Asset Class | ||||||||
| Equity | 3,129 | 2,441.92 | 341 | 51.94 | 101 | 11.68 | 240 | 40.25 |
| Fixed Income | 844 | 449.06 | 105 | 16.77 | - | - | 105 | 16.77 |
| Commodity | 1,000 | 100.75 | 318 | 5.6 | 300 | 4.16 | 18 | 1.44 |
| Alternative | 221 | 18.6 | 15 | 0.75 | 4 | 0.65 | 11 | 0.11 |
| Currency | 187 | 4.62 | 120 | 0.49 | 11 | 0.01 | 109 | 0.47 |
The size of synthetic equity ETFs is $51.9 billion, making them the largest synthetic ETF category. Fixed Income and Commodities are second and third with $16.8 billion and $5.6 billion in net assets, respectively.
As shown in Table 2, a large fraction of synthetic ETFs are long only and aim to match, one-to-one, the returns of underlying indexes. A small fraction of these ETFs in terms of net assets are short and/or leveraged.5 Furthermore, ETFs that have unfunded swap structure have nearly $60 billion in net assets, representing the 78% of the synthetic ETFs assets. Markit data does not provide the collateral information on US synthetic ETFs, which are the US Leveraged and Inverse ETFs. As of May 2017, US Leveraged and Inverse ETFs have $33 billion of assets under management.6
Table 2: Synthetic ETFs
| Long | Leveraged | Inverse | ||||
|---|---|---|---|---|---|---|
| Count | Net Assets ($bil) | Count | Net Assets ($bil) | Count | Net Assets ($bil) | |
| Total | 620 | 69.01 | 101 | 2.34 | 178 | 4.19 |
| Region | ||||||
| Americas | - | - | - | - | - | - |
| Europe | 576 | 67.68 | 101 | 2.34 | 178 | 4.19 |
| APAC | 44 | 1.33 | - | - | - | - |
| Middle East & Africa | - | - | - | - | - | - |
| Asset Class | ||||||
| Equity | 284 | 48.07 | 20 | 1.68 | 37 | 2.19 |
| Fixed Income | 80 | 15.3 | 5 | 0.04 | 20 | 1.43 |
| Commodity | 194 | 4.83 | 62 | 0.45 | 62 | 0.32 |
| Alternative | 15 | 0.75 | - | - | - | - |
| Currency | 47 | 0.06 | 14 | 0.17 | 59 | 0.25 |
Source: IHS Markit, SOLA.
4. Collateralization of Synthetic ETFs
Our data include the collateralization level for each synthetic ETF, calculated as the market value of the collateral/substitute basket to the NAV of the fund. The collateralization level is important to protect investors against losses in case the ETF counterparty were unable to honor the swap contract.
Summary statistics for synthetic ETF collateralization, by ETF type, are reported in Table 3. The average collateralization level is 102.1%, and the 25th percentile is also above 100%. These results for synthetic ETFs that voluntarily report their collateral are consistent with the findings of Hurlin, Iseli, Perignon and Yeung (2017).
Table 3: Collateralization Level of Synthetic ETFs
| All Synthetic ETFs | |||
|---|---|---|---|
| Count | Average | 25th Percentile | |
| All | 899 | 102.1 | 100.2 |
| Equity | 341 | 101.74 | 100.15 |
| Fixed Income | 105 | 100.19 | 100.01 |
| Commodity | 318 | 102.18 | 100.5 |
| Alternative | 15 | 103.95 | 100.26 |
| Currency | 120 | 104.31 | 104.04 |
| Long ETFs | |||
|---|---|---|---|
| Count | Average | 25th Percentile | |
| Equity | 284 | 101.28 | 100.14 |
| Fixed Income | 80 | 100.15 | 100.01 |
| Commodity | 194 | 103.24 | 100.5 |
| Alternative | 15 | 103.95 | 100.26 |
| Currency | 47 | 104.15 | 104.04 |
| Leveraged ETFs | |||
|---|---|---|---|
| Count | Average | 25th Percentile | |
| Equity | 20 | 105.13 | 100.22 |
| Fixed Income | 5 | 100.32 | 100.04 |
| Commodity | 62 | 100.51 | 100.5 |
| Alternative | 0 | ||
| Currency | 14 | 104.04 | 104.04 |
| Inverse ETFs | |||
|---|---|---|---|
| Count | Average | 25th Percentile | |
| Equity | 37 | 103.53 | 100.18 |
| Fixed Income | 20 | 100.31 | 100.08 |
| Commodity | 62 | 100.53 | 100.5 |
| Alternative | 0 | ||
| Currency | 59 | 104.5 | 104.04 |
Source: IHS Markit, SOLA.
Collateralization levels may vary on days when financial markets are particularly volatile, because changes in the value of the collateral may require one of the counterparty to post additional collateral, and these changes may take place over more than one day. In Figure 2, we show that collateralization levels, both in terms of median and 10th percentile, decline slightly when the implied volatility index VIX increases. The decline is small in absolute value, but the pattern does highlight that collateralization levels are affected by overall market volatility.
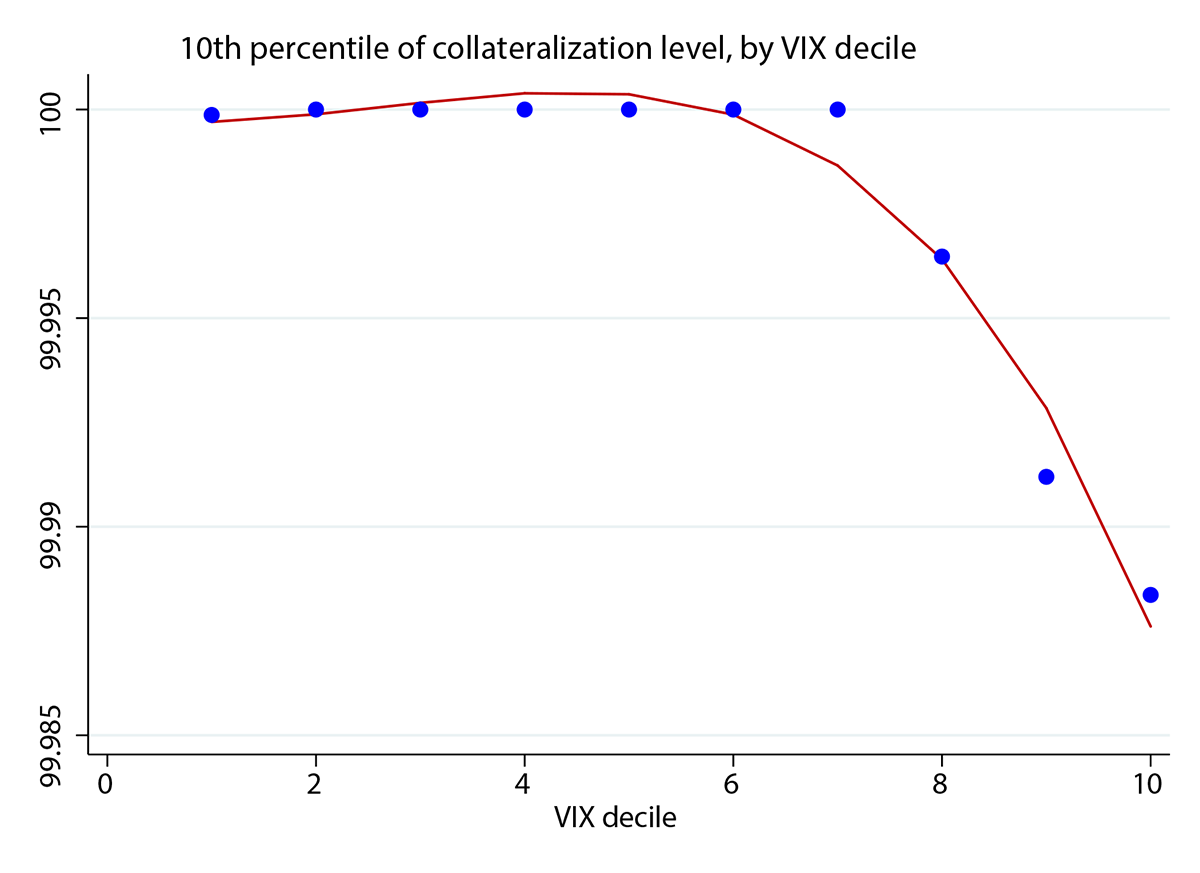
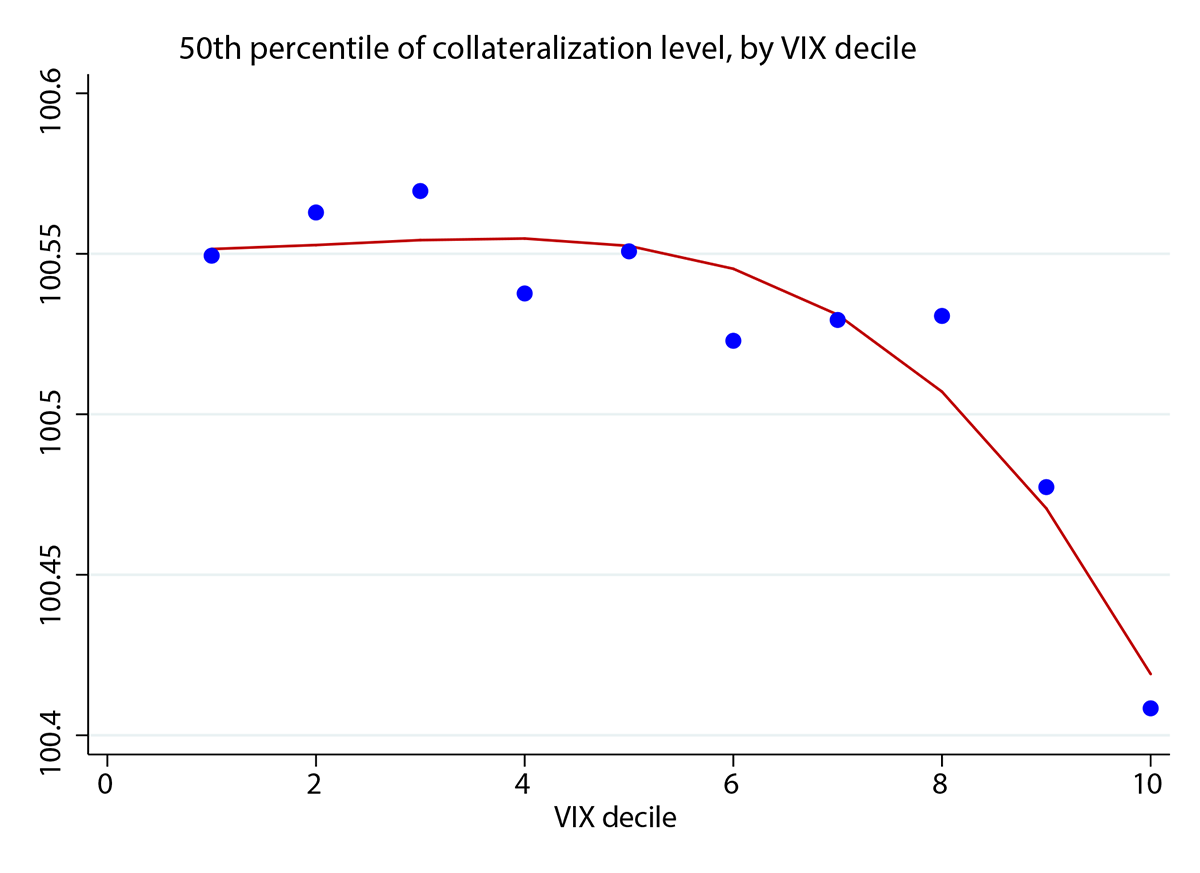
Source: IHS Markit, SOLA.
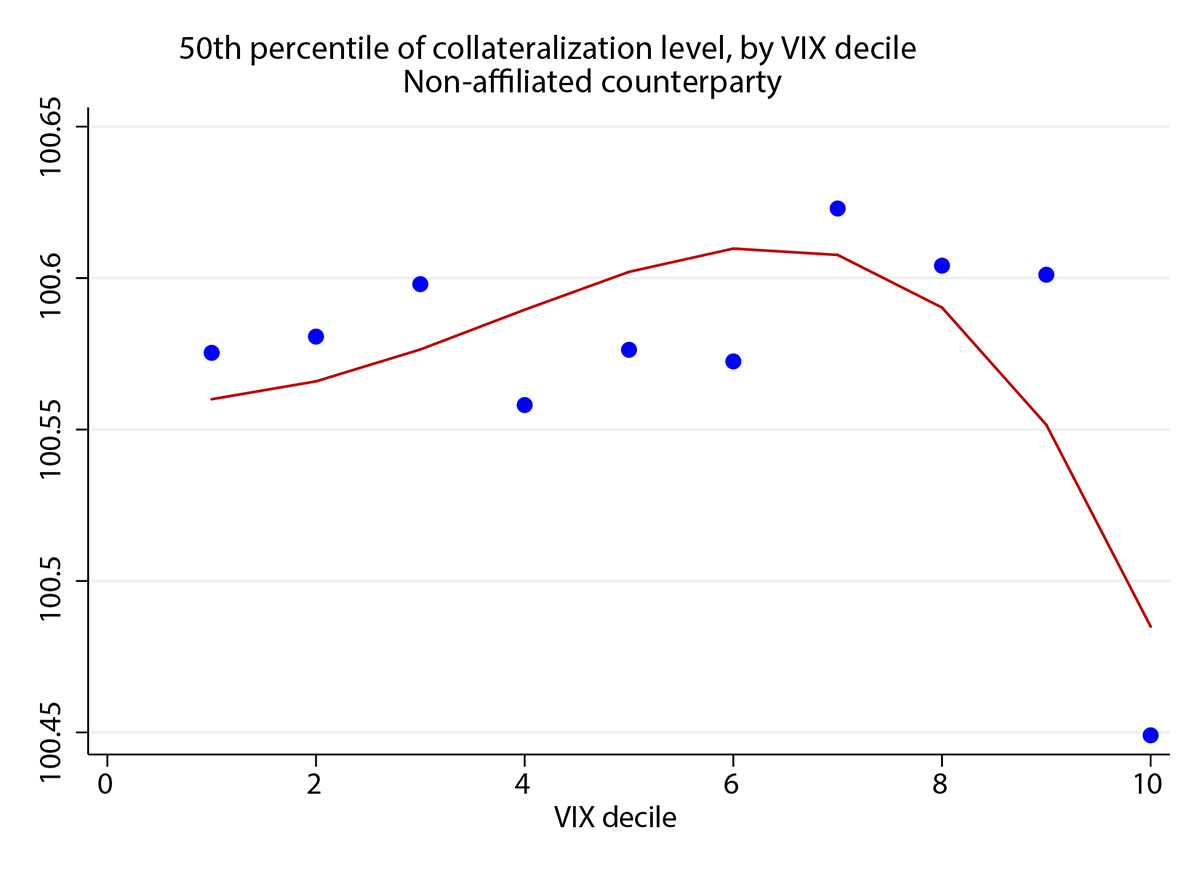
Whether the asset manager and the swap counterparty are affiliated might have an effect on how collateralization levels respond to market volatility. For instance, an asset manager might allow the affiliated counterparty to restore collateral more slowly, possibly because it has better information about the solvency of the counterparty.
In Figure 3, we show that the pattern of median collateralization across market volatility is starkly different depending on whether the asset manager and the swap counterparty are affiliated. We emphasize that the overall effect is fairly small, but collateralization declines steadily across VIX deciles, starting from fairly low VIX levels, when the swap parties are affiliated. On the contrary, collateralization actually increases somewhat across VIX deciles when the swap parties are not affiliated, and it declines only for the highest levels that VIX reaches in the sample we study.
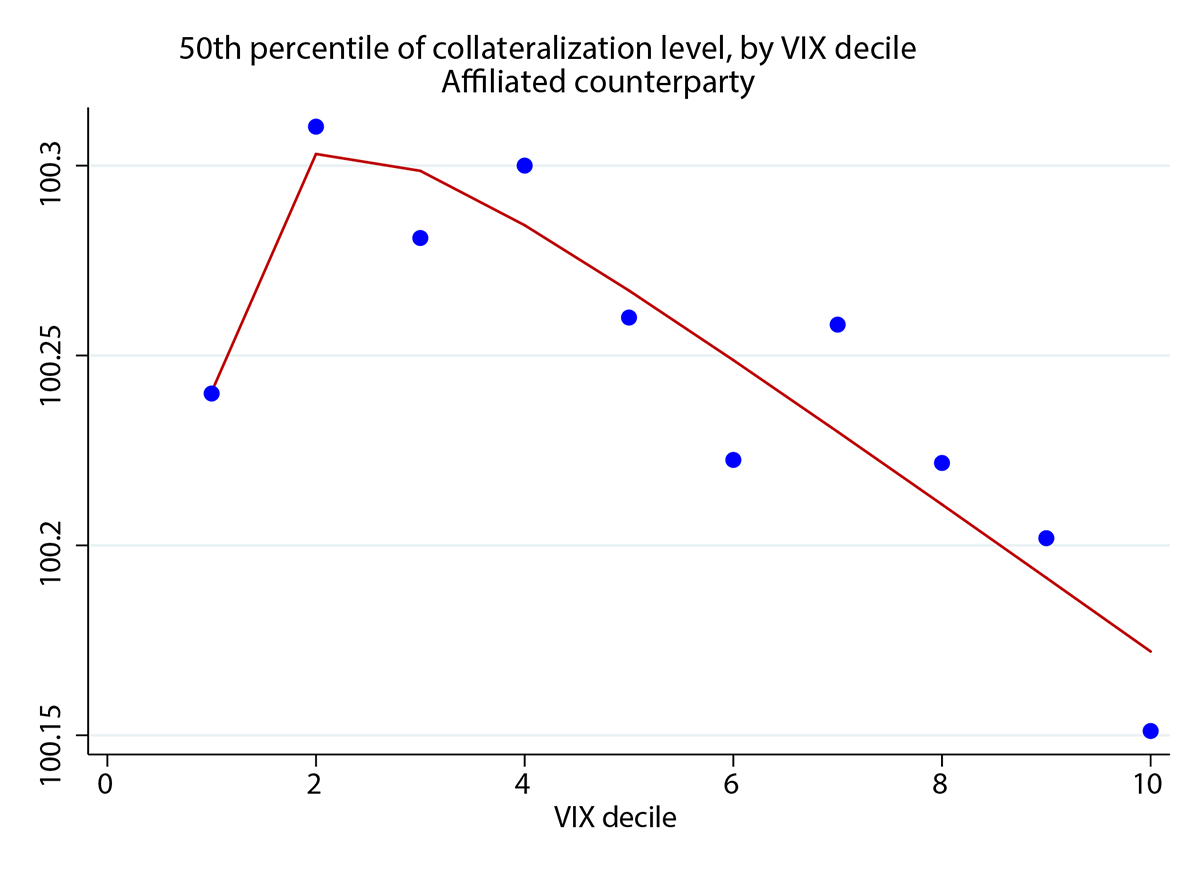
Source: IHS Markit, SOLA.
5. Conclusion
Synthetic ETFs are riskier structures than physical ETFs because investors are exposed to counterparty risk. They are mostly domiciled in Europe, where they represent about 20% of total ETF assets. Slightly more than half of non-US synthetic ETFs, by assets, voluntarily provide details about their collateral baskets. These ETFs are overcollateralized by 2%, on average, and they mostly have an unfunded swap structure, which provides the asset manager with direct ownership of the collateral. Collateralization tends to decline slightly when financial markets are more volatile, especially if the ETF manager is affiliated with the swap counterparty.
It is unclear whether our findings on collateralization levels also apply to synthetic ETFs that do not report collateral details, which continue to remain opaque investment vehicles.
References
Hurlin, Christophe, Grégoire Iseli, Christophe Pérignon, and Stanley Yeung. (2017), "The Counterparty Risk Exposure of ETF Investors."
Financial Stability Board, 2011, "Potential financial stability issues arising from recent trends in Exchange-Traded Funds (ETFs)"
IHS Markit Ltd, SOLA ETF Data Management, accessed June, 2017, http://www.markit.com/Product/SOLA.
Vanguard (2013), "Understanding synthetic ETFs"
1. https://www.sec.gov/news/press/2010/2010-45.htm Return to text
2. Some providers may decide to invest the money with the swap counterparty in a reverse repo. Return to text
3. http://media.morningstar.com/uk/MEDIA/ETF/AGuidedTouroftheEuropeanETFMarketplace2017.pdf. Return to text
4. http://www.fsb.org/2011/04/potential-financial-stability-issues-arising-from-recent-trends-in-exchange-traded-funds-etfs/?page_moved=1. Return to text
5. Leveraged ETFs seek to match multiples of returns on underlying indexes whereas inverse ETFs seek to match one-for- one or the multiples of returns on underlying indexes. Return to text
6. Source: Morningstar. Return to text
Aramonte, Sirio, and Cecilia Caglio, Tugkan Tuzun (2017). "Synthetic ETFs," FEDS Notes. Washington: Board of Governors of the Federal Reserve System, August 10, 2017, https://doi.org/10.17016/2380-7172.2028.
Disclaimer: FEDS Notes are articles in which Board staff offer their own views and present analysis on a range of topics in economics and finance. These articles are shorter and less technically oriented than FEDS Working Papers and IFDP papers.