FEDS Notes
September 06, 2022
The coming long-run slowdown in corporate profit growth and stock returns
Over the past two decades, the corporate profits of stock market listed firms have been substantially boosted by declining interest rate expenses and lower corporate tax rates. This note's key finding is that the reduction in interest and tax expenses is responsible for a full one-third of all profit growth for S&P 500 nonfinancial firms over the prior two-decade period. I argue that the boost to corporate profits from lower interest and tax expenses is unlikely to continue, indicating notably lower profit growth, and thus stock returns, in the future.
To begin, Figure 1 shows that, since the mid-2000s, interest and tax expenses have steadily declined relative to earnings for S&P 500 nonfinancial firms.2 Indeed, prior to the Global Financial Crisis, the ratio of interest and tax expenses to earnings before interest and taxes (EBIT) was fairly high, hovering around 45 percent. As of 2022:Q1, this measure had fallen to 26 percent. In other words, a smaller share of corporate profits is now being paid out to debtholders and tax authorities—thus leaving more available to shareholders.
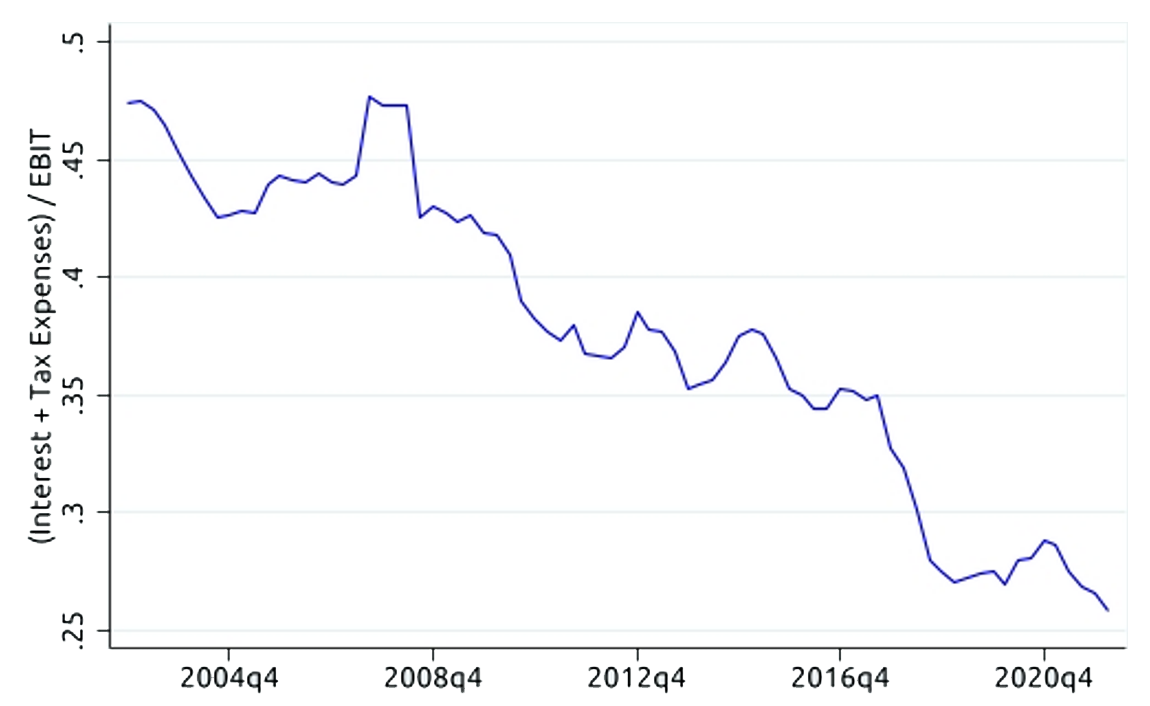
Note. Aggregate values for S&P 500 nonfinancial firms.
Source: Compustat; S&P Dow Jones Indices.
What explains this decline in the share of interest and tax expenses relative to corporate profits? Figure 2 makes clear that a key driver was the decline in corporate interest rates—which itself largely reflects the steady, decades-long march down in Treasury yields. In 2007, just prior to the financial crisis, interest rates faced by S&P 500 nonfinancial firms—as measured by the ratio of their interest expenses to total debt—stood at about 6 percent. By the end of 2019, before the COVID-19 pandemic, this measure had declined to about 3.5 percent, only to fall even further by 2022:Q1, to 3 percent.
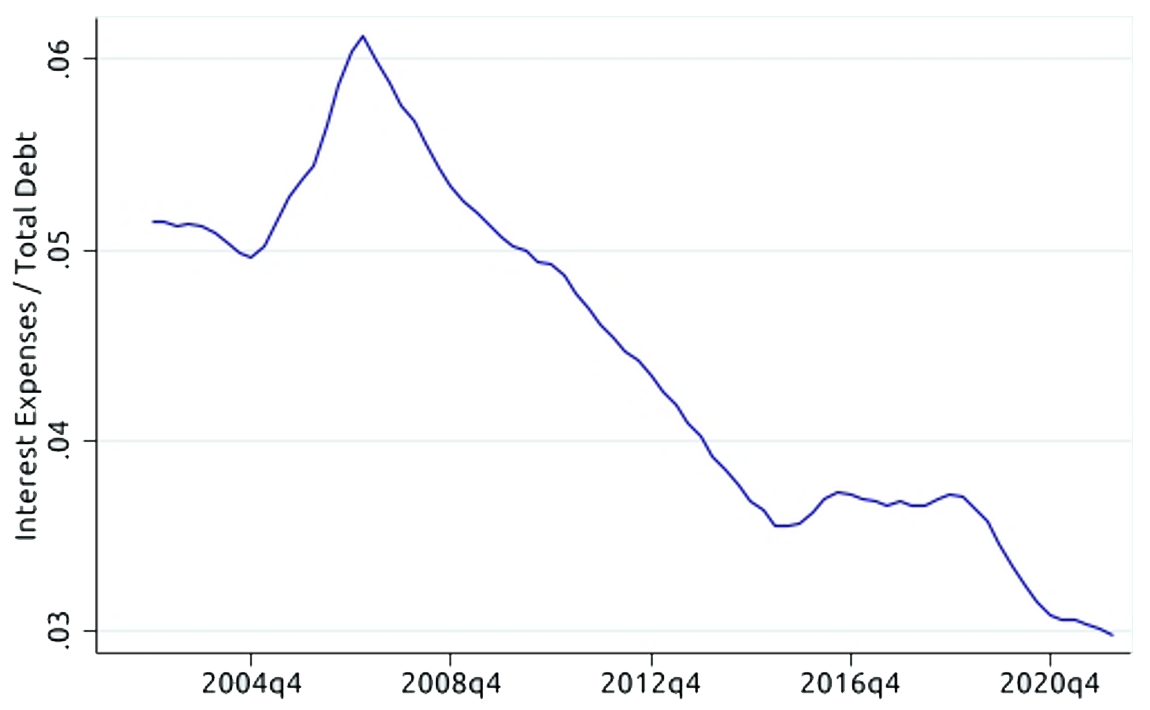
Note. Aggregate values for S&P 500 nonfinancial firms.
Source: Compustat; S&P Dow Jones Indices.
The significant decline in corporate interest rates allowed interest expenses to decline as a share of earnings, even as corporate leverage rose, as shown in Figure 3.
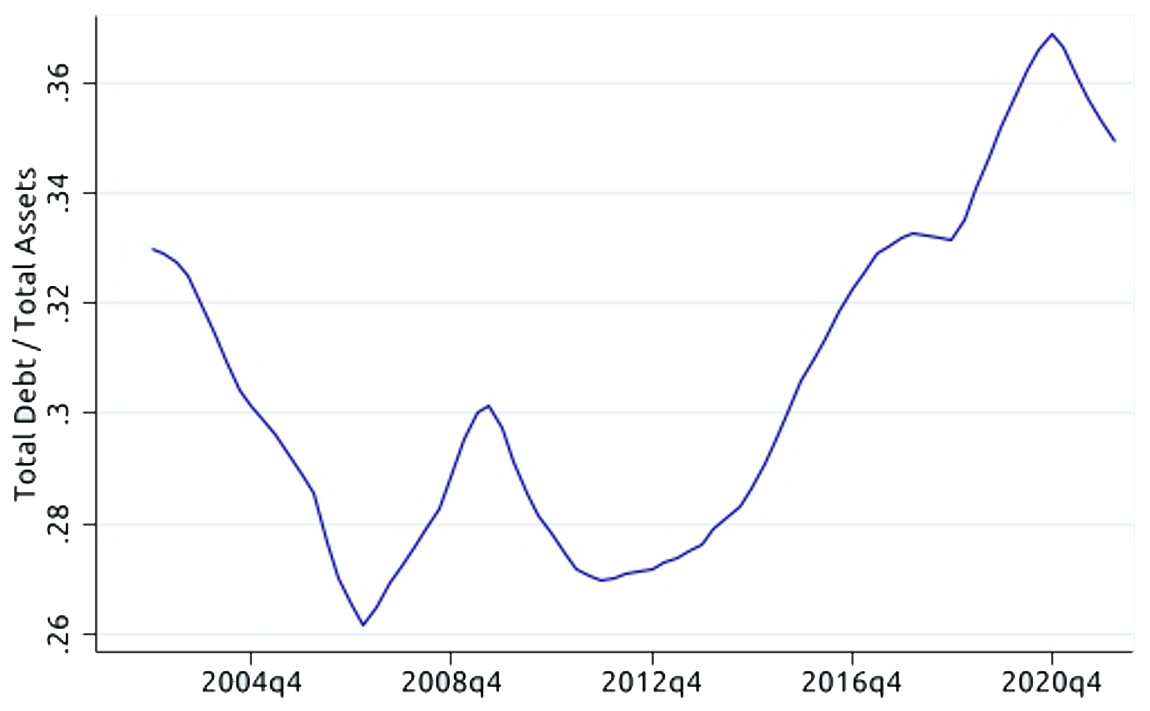
Note. Aggregate values for S&P 500 nonfinancial firms.
Source: Compustat; S&P Dow Jones Indices.
Moreover, effective corporate tax rates also declined, shown in Figure 4. In the years prior to the financial crisis, effective corporate tax rates—measured as total tax expenses divided by pre-tax income—averaged about 30 percent. They then drifted somewhat lower in the years immediately following the crisis. The major step down, however, occurred following the passage of the Tax Cuts and Jobs Act of 2017, which cut the statutory corporate tax rate from 35 percent to 21 percent.
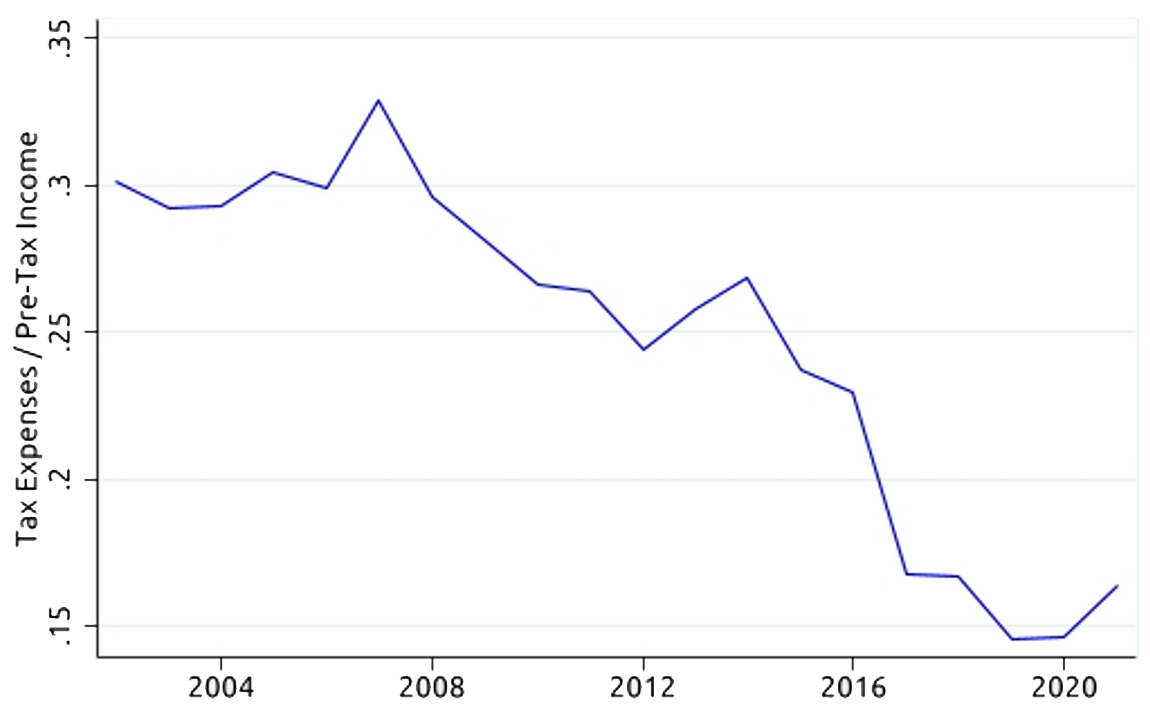
Note. Aggregate values for S&P 500 nonfinancial firms.
Source: Compustat; S&P Dow Jones Indices.
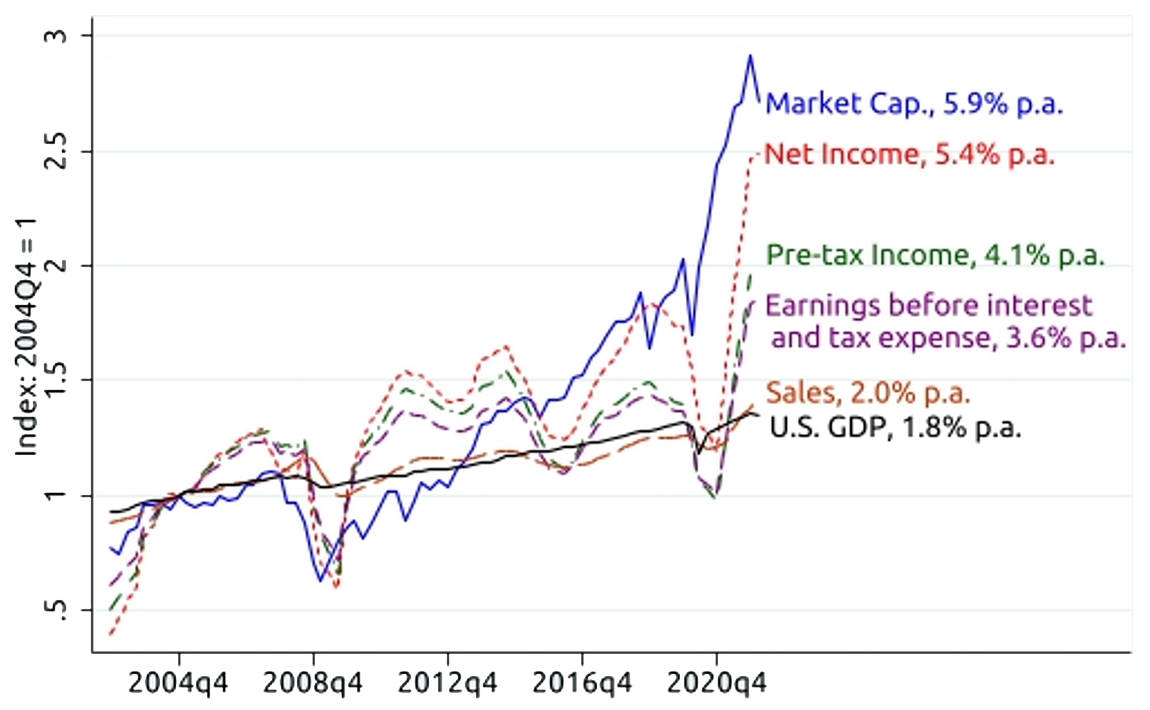
How much did the relative decline in interest and tax expenses contribute to earnings growth over the past two decades? Figure 5 attempts to answer this question. The figure shows various indicators of real growth for S&P 500 nonfinancial firms (with all indicators adjusted for inflation using the GDP deflator). Each indicator is indexed to its value as of 2004:Q4.3 Near the label of each indicator, I also report the real, per-annum (p.a.), compound growth rate over the period 2004:Q4 to 2022:Q1.
Note. Aggregate values for S&P 500 nonfinancial firms.
Source: Compustat; S&P Dow Jones Indices.
The blue line shows the real growth in the market capitalization of S&P 500 nonfinancial firms, which grew at an annualized rate of 5.9 percent from 2004:Q4 to 2022:Q1.4 Net income, shown in red, is not far behind, growing at a rate of 5.4 percent. The difference between the growth rates of market capitalization and net income is explained by the fact that price-to-earnings (P/E) multiples expanded over the period.
With this setup, one can answer the question of how important a contributor declining interest and tax rates were to boosting corporate profitability. The green line adds back tax expenses to net income, which results in a lower growth rate of 4.1 percent. Likewise, when both interest and tax expenses are added back to net income, as shown by the purple line, the resulting growth rate is overall significantly lower, at 3.6 percent.5 This suggests that, if interest and tax expenses had not declined as a share of EBIT (as shown in Figure 1), then the real growth rate of corporate profits would have been almost 2 percentage points lower each year (5.4 – 3.6 = 1.8 percentage points). In other words, the relative decline in interest and tax expenses is responsible for a full one-third of all profit growth for S&P 500 nonfinancial firms over the past two decades (1.8 / 5.4 = 1/3). This is a very substantial contribution.6
Importantly, these calculations only take into account the direct, mechanical effect of lower interest and tax expenses on net income. To say that corporate profits would have grown at a 2 percentage point lower rate had interest and tax expenses not declined therefore ignores indirect, or general equilibrium, effects. In particular, one would expect that lower interest and tax rates would themselves have provided a stimulative boost to economic activity and to EBIT. In this sense, had interest and tax rates not declined, the real growth rate of EBIT, and net income, would most likely have been even lower than 3.6 percent.7
The final two lines in Figure 5 show the growth in real sales for S&P 500 nonfinancial firms, in orange, and the growth in real GDP, in black. These grew at annual rates of 2.0 percent and 1.8 percent, respectively. Conceptually, the similarity between these two numbers makes sense—GDP is the aggregate of all final sales in the economy, and it turns out that, over the long run, the sales of S&P 500 nonfinancial firms and GDP grow at a roughly similar pace.8
The difference between EBIT growth and sales growth (3.6 percent vs. 2.0 percent) can be attributed to an improvement in profit margins. In other words, costs grew at a slower rate than sales. Some of the improvement in profit margins may have come from sourcing cheaper inputs from abroad, enabled by increased globalization. Moreover, for output produced within the U.S., growth in labor productivity—i.e., real output per hour worked—exceeded real wage growth since the mid-2000s.9 This means that, for a given cost of labor, firms were able to produce more output, which would also likely have contributed to the improvement in profit margins.10
The longer-run outlook for corporate profits and stock returns
What are the implications of the above analysis for the likely future trajectory of earnings growth and stock returns? Below, I present the argument that the ratio of interest and tax expenses to EBIT is unlikely to fall much further, thus implying substantially lower growth in net income and lower stock returns going forward. My analysis focuses on the longer-term outlook and abstracts from shorter-term fluctuations.
Growth in net income can only come from the following sources: (1) interest expenses can decline relative to EBIT, which in turn can only be driven by lower interest rates or by reductions in leverage; (2) effective tax rates can decline; or (3) EBIT can grow.11
Regarding interest rates, a natural question to ask is how much further they can fall? During the COVID-19 pandemic, risk-free rates reached their effective lower bound, which dramatically lowered corporate interest rates and allowed companies to refinance large quantities of debt at historically low rates. As a result, the ratio of interest expenses to total debt fell to the historically low level of 3.0 percent, as shown in Figure 2. Simply put, there is very limited scope for interest rates to fall much further beyond that ultra-low level. Indeed, market interest rates have since risen notably following the removal of monetary policy accommodation in the wake of elevated inflation readings.
This raises the possibility that perhaps firms could lower their interest expenses by reducing leverage. However, reducing leverage is costly. It would require either issuing equity, which would dilute existing shareholders, or paying down debt, which would involve lower payouts to shareholders in the form of either dividends or buybacks. Both issuing equity or lowering payouts would likely be harmful for stock returns.
Next, net income could increase through a reduction in the effective corporate tax rate. While predicting changes to the tax code is difficult, it seems that a cut in corporate tax rates is quite unlikely in the foreseeable future. As noted above, the Tax Cuts and Jobs Act of 2017 reduced the statutory corporate tax rate from 35 percent to 21 percent. Major reforms to the tax code tend to occur infrequently. Moreover, with the ratio of U.S. debt-to-GDP near all-time highs and inflation at elevated levels, a deficit-financed cut in the corporate tax rate does not appear likely. Indeed, the 15 percent corporate minimum tax that was part of the recently-passed Inflation Reduction Act took a step in the opposite direction.
If interest and tax rates are unlikely to fall any further, then growth in net income can only come from growth in EBIT. If EBIT grows at the same rate as in the past, then this would imply a real growth rate for net income of about 3.6 percent, or around 2 percentage points lower than over the last two decades. There is reason to believe though that even this assumed rate of growth might be somewhat optimistic. For one, EBIT growth in the past likely benefited from the stimulative effects of declining interest and tax rates. With interest and tax rates not expected to fall much further, this stimulative channel is effectively shut off.
Moreover, growth in EBIT can only come from either sales growth or improvement in profit margins (i.e., $${EBIT} = {Sales} \times {Profit\ Margin}$$, where $${Profit\ Margin} = {EBIT}/{Sales})$$. In terms of sales growth, the analysis above suggests that, over the long run, it is reasonable to expect that sales will grow at a similar rate as GDP. Growth in GDP, in turn, can come from either increases in the size of the labor force or from improvements in productivity (i.e., $${GDP} = {total\ hours\ worked} \times {output\ per\ hour\ worked}$$). In this respect, the aging of the population and the possibility of declining rates of immigration are likely to be a drag on labor force growth—and thus GDP and sales growth—in the years ahead. This implies that, for EBIT to grow at the same rate as in the past, productivity and profit margins would need to improve more rapidly just to offset the likely slowdown in labor force growth. Of course, whether such productivity and profit margin improvements materialize is an entirely open question.
Taken all together, the above analysis implies that a reasonable forecast for the longer-run real growth rate of corporate profits is probably in the range of about 3 to 3.5 percent, but it might be even lower.
What does this imply for stock returns? Over the past two decades, the market capitalization of S&P 500 nonfinancial firms increased at a rate of almost 6 percent in real terms. If corporate profit growth is expected to be substantially slower than in the past, then such stock market performance could only be sustained by the perpetual expansion of P/E multiples. Clearly, this is unsustainable. If P/E multiples were to remain at their current levels, then stock prices could only grow at the same rate as profits, which would suggest a real growth rate of about 3 to 3.5 percent.
This raises the question of whether P/E multiples will tend to remain near their current levels, on average, over the longer run. At the time of writing, the forward P/E ratio on the S&P 500 index stood at approximately 17. A value of 16 is essentially equal to its historical median (and mean) level observed since 2002. It is possible that P/E multiples in the future will fluctuate around the same historical median level. On the other hand, if profit growth is slower than in the past, there is good reason to believe that P/E multiples, averaged over time, will themselves contract.
The reason for this is that P/E multiples embed expectations of future earnings. A reduced earnings growth rate means that the entire stream of future earnings will be lower. As a result, the stock price that investors would be willing to pay per dollar of current earnings—i.e., the P/E ratio—should also be lower.
P/E multiples are, of course, also determined by discount rates—i.e., the rate at which markets discount an expected stream of future earnings to arrive at a price. So, if discount rates happen to fall by enough to offset the expected slowdown in earnings growth, then P/E ratios might remain approximately unchanged, on average. The discount rate, in turn, is equal to the risk-free rate plus a risk premium component—with the latter compensating investors for the risk of holding stocks. As already mentioned, risk-free rates reached their effective lower bound during the COVID-19 pandemic and have little scope to fall any further below that point (indeed, they have recently risen). Therefore, with earnings growth expected to slow, only a large enough decline in risk premiums could prevent a contraction in P/E multiples. Simply assuming that this will happen, however, is very optimistic, since it's not clear what could cause investors to be willing to accept materially less compensation for the risk of holding stocks.
The overall conclusion, then, is that—with the expected slowdown profit growth and the associated contraction in P/E multiples—real longer-run stock returns are likely to be notably lower than in the past.
1. I thank Andrew Chen, Emilio Osambela, Dino Palazzo, Francisco Palomino, Michael Palumbo, Steve Sharpe, Nitish Sinha, and Gustavo Suarez for very helpful comments and suggestions. Return to text
2. I exclude financial firms because interest expenses are a primary input for them, and their leverage fell dramatically in response to regulatory reforms following the Global Financial Crisis. Data on S&P 500 historical index constituents is from S&P Dow Jones Indices. These data have the GVKEY field populated going back to 2002:Q1, thus allowing a merge with Compustat. From the latter, I obtain quarterly firm-level data, which I then aggregate. Return to text
3. I take the 4-quarter moving average of each indicator, meaning that 2002:Q4 is the first datapoint. I index to 2004:Q4 to avoid exaggerated results due to the fact that profits were near their trough early in the sample period following the 2001-recession and September 11 terrorist attacks. Return to text
4. For comparison, the real annualized return on the overall S&P 500 index over this period was 5.7 percent. Return to text
5. Since interest expenses are tax deductible, it makes sense to focus on the combined effect. Also, it is worth noting that net income is equal to operating income after depreciation minus interest and tax expenses plus special items and nonoperating income minus minority interest. Here, I have added back interest and tax expenses to net income to arrive at a measure of EBIT. If EBIT is instead measured as operating income after depreciation, then the resulting growth rate is even lower, at 3.3 percent. Other analogous measures, like operating income before depreciation (EBITDA) and cash flow from operations, also grew at 3.3 to 3.4 percent. Return to text
6. The divergence between net income and EBIT is just as notable if one ends the series in 2019:Q4, prior to the onset of the COVID-19 pandemic. Over this period, net income grew at a real rate of 3.8 percent, while EBIT grew at a real rate of 2.1 percent. Return to text
7. This assumes that at least part of the observed decline in interest rates was due to discretionarily accommodative monetary policy and cannot be entirely attributed to purely structural factors, which seems reasonable. Return to text
8. Although they have similar average growth rates, S&P 500 nonfinancial sales growth is more volatile than GDP growth. Return to text
9. I calculate that, from 2004:Q4 to 2022:Q1, real nonfarm business sector labor productivity (output per hour) grew at a rate of 1.4 percent, while over the same period real hourly compensation grew at 0.9 percent. Return to text
10. An assumption here is that labor productivity and wage rates for S&P 500 nonfinancial firms grew at a similar pace to the overall nonfarm business sector. Return to text
11. I.e., $${Net\ Income} = {EBIT} - {Interest\ Expense} - {Tax\ Expense}$$.
So, $${Net\ Income} = {EBIT} \times (1 - {Interest\ Expense}/{EBIT}) \times (1 - {Effective\ Corporate\ Tax\ Rate})$$. Return to text
Smolyansky, Michael (2022). "The coming long-run slowdown in corporate profit growth and stock returns," FEDS Notes. Washington: Board of Governors of the Federal Reserve System, September 06, 2022, https://doi.org/10.17016/2380-7172.3167.
Disclaimer: FEDS Notes are articles in which Board staff offer their own views and present analysis on a range of topics in economics and finance. These articles are shorter and less technically oriented than FEDS Working Papers and IFDP papers.