FEDS Notes
July 15, 2020
The Increasing Deflationary Impact of Consumer Digital Access Services
David M. Byrne and Carol A. Corrado*
1. Introduction
Although U.S. consumer price statistics are prone to upward bias, they remain useful if imperfect accounting has a known and stable effect (Boskin et al., 1998; Moulton, 2018). For example, monetary authorities may set a target for measured inflation higher than their objective for true inflation if official measures are routinely overstated (Bernanke and Mishkin, 1997). Similarly, fiscal authorities may treat reported inflation as a biased measure of the true cost of living when indexing program benefits (Burdick and Fisher, 2007). But, in recent years, an undetected increasing source of upward bias has crept into consumer price measures, confounding their use as an indicator: digital access services.
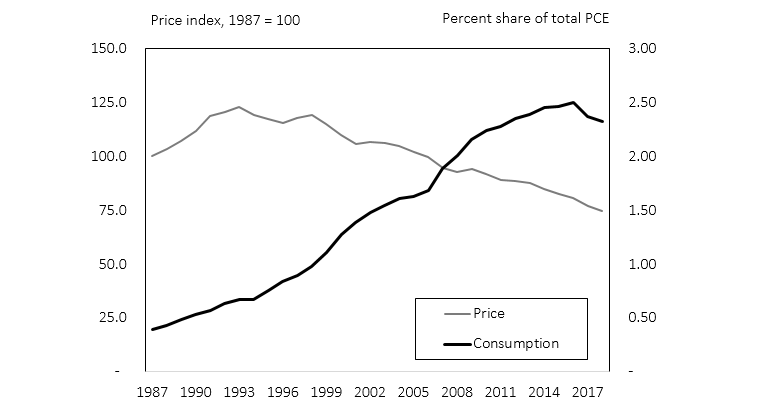
Note. Authors' aggregation of BEA prices for consumer digital access services relative to total PCE price index.
Digital access services deliver data, voice, and video to households over the internet, mobile cellular networks, and cable television networks. They have become a major component of U.S. household consumption (figure 1). In light of cost-saving technical advances in information technology (IT), the modest price decline for these services since the late 1980s is puzzling. We construct a price index with alternative sources and methods and find that prices for consumer digital access services have fallen rapidly, and at an accelerating pace, for 30 years. We argue that to get prices right, it is essential to account for the massive increase in data and programming delivered to users in conjunction with largely stable nominal service fees.
2. Price Index Construction
We construct prices for four types of digital access service by dividing spending by a suitable measure of volume. This approach is predicated on the assumption that each service is homogeneous enough that a simple price per unit can capture secular price trends.1 We discuss alternative approaches in section 4.
For digital access service spending, we use the consumption recorded in the following lines of Bureau of Economic Analysis (BEA) table 2.5.4U. Personal Consumption Expenditures by Type of Product: "Internet access" (line 285); "Cellular telephone services" (line 281); "Cable, satellite, and other live television services" (line 215); and "Video and audio streaming and rental" (line 219).2 In choosing volume indicators for each service, we distinguish between commodities and services delivering differentiated products (table 1).
Table 1. Measures of Volume for Digital Access Services
| Service | Type | Volume Indicator |
|---|---|---|
| Internet | Commodity | Data traffic. |
| Mobile | Commodity | Data traffic (smartphone); talk time (feature phone) |
| Cable Television | Differentiated | Viewing hours weighted by log of channels available. |
| Streaming | Differentiated | Viewing hours weighted by log of programs available. |
- Internet access service operates in a fashion similar to the postal service. Much the same as the letter carrier is not responsible for the information contained in a letter, the internet service provider delivers packets containing content, but is not the creator of the World Wide Web.3 Thus, the natural measure of volume is units of data delivered, namely fixed consumer internet protocol (IP) traffic.4
- Mobile phone service consists of two quite different services. Smartphone service is essentially internet service delivered under different conditions of sale, i.e. via radio transmission, and we employ consumer mobile IP traffic as our indicator of volume. Feature phone service provides the ability to talk, text, and access rudimentary data services. We use talk time as an indicator of overall feature phone use.5
- Cable television service providers deliver a differentiated product in that they take responsibility for the content delivered. Consequently simple viewing hours is not an adequate indicator of volume. We adjust hours of viewing for quality using the log of the national average number of channels per provider. That is, increasing the number of available channels from 10 to 20 yields the same increase in quality as an increase from 100 to 200 channels.6
- Streaming service is highly differentiated as well. Similar to the index for cable service, we adjust viewing hours by a measure of programming availability. In this case, rather than channels, we use (the log of) the number of programs available in the service library.7 Sufficient information on revenue, users, and program library to construct a full history was only obtained for Netflix, but calculations with sporadic data on Hulu and Amazon Prime streaming suggest that Netflix is suitable proxy. We did not obtain data on audio streaming.
3. Results
Inflation for consumer digital access services from 1988 to 2018 is shown in table 2. Internet access service prices fell 36 percent per year on average and slowed substantially in the last ten year period. Prices for mobile access services fell 20 percent per year on average, somewhat slower than the price for internet services, but accelerated as the composition shifted toward smartphone service, for which prices fall faster, in the most recent period.8 Cable access service prices behave quite differently, edging up a little under 1 percent per year over time. In contrast, streaming services, able to leverage innovations in IT capital more effectively than cable (e.g. by using cloud computing services), fall 23 percent per year on average. Combining the four service indexes, our aggregate price index for consumer digital access services fell 12 percent per year from 1988 to 2018. The index accelerates noticeably over time as the composition shifts away from cable services.
Table 2. Consumer Digital Access Services
| Internet Access Services | Mobile Access Services | Cable Access Services | Streaming Services | Total Digital Access Services | Memo: Total PCE | |
|---|---|---|---|---|---|---|
| A. Alternative Price Indexes (Annual Average Percent Change) | ||||||
| 1988-2018 | -35.7 | -20.1 | 0.6 | NA | -11.9 | 1.9 |
| 1988-1997 | -43.8 | 3.3 | 0.5 | NA | -1.7 | 2.8 |
| 1998-2007 | -41.3 | -20.2 | 0.2 | NA | -13.1 | 1.9 |
| 2008-2018 | -23.3 | -41.2 | 1.0 | -22.8 | -20.0 | 1.1 |
| B. Official Price Indexes (Annual Average Percent Change) | ||||||
| 1988-2018 | -2.2 | -3.7 | 4.3 | NA | 1.2 | 2.1 |
| 1988-1997 | -4.6 | -2.1 | 6.2 | NA | 4.5 | 2.9 |
| 1998-2007 | -2.7 | -4.7 | 4.3 | NA | -0.2 | 2.0 |
| 2008-2018 | 0.3 | -4.2 | 2.6 | 1.9 | -0.6 | 1.5 |
| C. Shares (Percent) | ||||||
| Share of Digital Access Service Spending | Share of PCE | |||||
| 1988-2018 | 40.7 | 37.8 | 17.4 | 4.0 | 1.8 | NA |
| 1988-1997 | 23.1 | 73.6 | 3.3 | 0.0 | 0.7 | NA |
| 1998-2007 | 44.4 | 41.3 | 13.4 | 0.9 | 1.5 | NA |
| 2008-2018 | 41.1 | 33.0 | 20.3 | 5.7 | 2.3 | NA |
Source: Bureau of Economic Analysis, GDP table 2.5.4U and authors' calculations.
Note: "NA" is "not applicable". "PCE" is "personal consumption expenditures". Streaming service spending begins in 2007.
Official prices for both internet and mobile access service also move down over time (table 2b), but at a pace an order of magnitude slower than the alternative indexes. Cable access service prices move up somewhat faster than the alternative index, and the official price index for streaming services is essentially flat. Official inflation for access services overall, our aggregate of the indexes used in the national income and product accounts, was 1 percent per year on average in this period, 13 percentage points higher than the alternative index. The gap between the official and alternative inflation measures has increased over time, from a difference of 6 percentage points in the 1988 to 1997 period, to 13 percentage points in the following ten-year period, and to 19 percentage points from 2008 to 2018.
4. Discussion
The alternative index for digital services, constructed at an annual frequency and focused on the characteristic most relevant for each of four types of service, is best interpreted as an indicator of secular price trends. As such, the index has implications for low-frequency changes in aggregate prices. Combining our alternative measure of digital service prices with official prices for the remainder of the index basket, total PCE prices increase ¼ percentage point more slowly on average than the NIPA PCE deflator over the 30-year period beginning in 1987 (table 2). The alternative index rises at an average rate of 1.9 percent while the official index rises at rate of 2.1 percent.
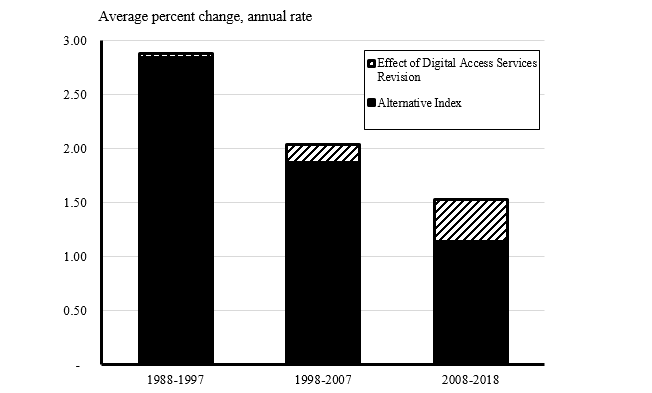
Source. Bureau of Economic Analysis; authors' calculations.
Note. Alternative index is aggregate of authors' index for digital access services and official prices for other items.
Evidently, the choice between these two indexes for digital access services is consequential. Additional sources provide insight into the puzzling tension between the alternative and official indexes.
- Capital theory predicts inflation for capital services will roughly align with investment price growth for the related capital assets (Jorgenson, 1963). Prices for the information technology used to produce digital access services fell 13 percent per year on average from 1986 to 2015 (Byrne and Corrado, 2017a,b), quite similar to the alternative index for digital access services.
- Hedonic analysis, employed in the construction of the offical index, provides a more nuanced approach to accounting for quality change than the "unit value" approach employed in the alternative index.9 For example, studies have found that the type of channels provided by cable networks affects pricing, not just the number of channels (Astine, 2001; Corrado and Ukaneva (2016, 2019)). Price-determining characteristics omitted from the unit value calculation may contribute to the difference between the indexes. Results of internal BLS hedonic studies are not routinely provided to the public, but available research on hedonic prices for internet access service points to modest declines in recent years, akin to the official index (Williams (2008), Greentein and McDevitt (2011), Flamm and Herrera (2017)).
- We speculate that flat item price trajectories may be confounding the official indexes. Casual observation of the pricing practices of major firms in these markets reveals that the component item prices used in the calculation of the index—i.e. prices for specific service plans—are typically unchanged over time.10 This phenomenon presents a challenge for the matched-model index approach used for the official indexes.11 Any change in service quality (per dollar) will only be captured when an item exits the basket and is replaced by another, the point at which hedonic adjustment is employed.12 In the event, the premium or discount paid for the replacement item relative to the exiting item must be apportioned between a difference in quality and pure inflation. If item turnover is infrequent, this approach may not introduce sufficient quality adjustment to produce an accurate index.
Leaving aside technical issues and data quality, ultimately the tension between the approaches stems from differing views on the appropriate units for consumption. The official indexes employ monthly prices paid for services of varying descriptions, implicitly assuming that the unit of consumption is the connection itself. In contrast, the alternative index assumes that each megabyte of data and each program watched represents additional consumption, much the same as using more kilowatts of electricity represents more consumption. The operative question is whether, for example, once you pay for access to the internet for a month, your consumption is the same whether you go online or not. Or, from a production perspective, does the output of internet service providers increase if they transmit more data?
In theory, with agreement on the question of units, the two approaches converge. An index using the alternative approach for fine categories distinguishing all price determining characteristics is conceptually the same as a hedonic index using the price per unit of volume rather than the price per contract. In practice, data availability precludes a test of this proposition. Conversely, if the four coarse service categories employed in this analysis are sufficient to account for quality, constructing the alternative index using price per contract, rather than price per unit of volume, should yield a similar result to the official index. As shown in figure 3, this is in fact the case.
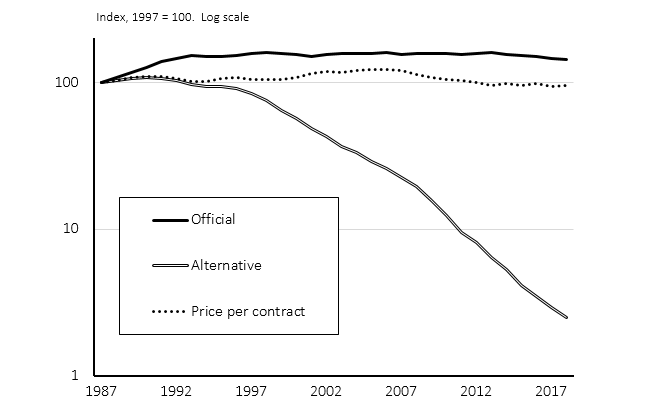
Source. Authors' aggregation of BEA prices and authors' calculations of alternative index and price per user index.
5. Conclusion
Accounting for the volume of data, voice and programming consumed using digital access services yields a price index that has fallen rapidly and at an accelerating pace for 30 years. The markedly different price trajectory for this noteworthy component of the consumption basket amplifies the slowdown in consumer prices in recent years, a fact unremarked upon in previous literature.
References
Abdirahman, Mo, Diane Coyle, Richard Heys, and Will Stewart. 2017. "A Comparison of Approaches to Deflating Telecoms Services Output." Economic Statistics Centre of Excellence (ESCoE) Discussion Paper 4.
Anstine, Diane Bruce. 2001. "How Much Will Consumers Pay? A Hedonic Analysis of the Cable Television Industry." Review of Industrial Organization 19 (2): 129-147.
Bernanke, Ben S. and Frederic S. Mishkin. 1997. "Inflation Targeting: A New Framework for Monetary Policy?" Journal of Economic Perspectives 11 (2): 97-116.
Burdick, Clark and Lynn Fisher. 2007. "Social Security Cost-of-Living Adjustments and the Consumer Price Index." Soc.Sec.Bull. 67: 73.
Bureau of Labor Statistics. "Measuring Price Change in the CPI: Telecommunications Services." Bureau of Labor Statistics, accessed February 9, 2020.
Byrne, David M. and Carol Corrado. Forthcoming. "Accounting for Innovations in Consumer Digital Services: IT Still Matters." In Measuring Innovation in the 21st Century, edited by Carol Corrado, Jonathan Haskel, Javier Miranda and Daniel E. Sichel. Revision of NBER Working Paper (25188) ed. Chicago: University of Chicago Press.
Byrne, David M. and Carol Corrado. 2017. ICT Asset Prices: Marshaling Evidence into New Measures Board of Governors of the Federal Reserve System (U.S.), Finance and Economics Discussion Series: 2017-016.
Byrne, David M. and Carol Corrado. 2017. "ICT Services and their Prices: What do they Tell Us about Productivity and Technology?" International Productivity Monitor (33): 150-186.
Byrne, David M., Stephen D. Oliner, and Daniel E. Sichel. 2018. "How Fast are Semiconductor Prices Falling?" Review of Income and Wealth 64 (3): 679-702.
Corrado, Carol and Olga Ukhaneva. 2019. Hedonic Price Measures for Fixed Broadband Services: Estimation Across OECD Countries, Phase II. OECD/DSTI/CDEP Report to CISP and MADE, Revised (November).
Corrado, Carol and Olga Ukhaneva. 2016. "Hedonic Prices for Fixed Broadband Services: Estimation Across OECD Countries." OECD Science, Technology and Industry Working Papers (2016/07) (OECD Publishing, Paris, https://doi.org/10.1787/5jlp14sgc9hj-en).
Coyle, Diane, Mohamed Abdirahman, Richard Heys, and Will Stewart. 2019. "A Comparison of Deflators for Telecommunications Services Output." .
Flamm, Kenneth and Carlos Herrera. 2017. "Price and Quality Change in US Broadband Service Markets." Available at SSRN 2757429.
Greenstein, Shane. 2002. "Is the Price Right? the CPI for Internet Access."
Greenstein, Shane and Ryan McDevitt. 2011. "Evidence of a Modest Price Decline in US Broadband Services." Information Economics and Policy 23 (2): 200-211.
Jorgenson, Dale W. 1963. "Capital Theory and Investment Behavior." The American Economic Review 53 (2): 247-259.
Leubsdorf, Ben. 2017. "How Cell-Phone Plans with Unlimited Data Limited Inflation." The Wall Street Journal, May 19, 2017.
Macunovich, Diane J. 2010. "Reversals in the Patterns of Women's Labor Supply in the United States, 1977-2009." Monthly Labor Review 133 (11).
Moulton, Brent. 2018. "The Measurement of Output, Prices, and Productivity: What's Changed since the Boskin Commission." Manuscript, Hutchins Center, Brookings Institution.
Nakamura, Emi and Jón Steinsson. 2012. "Lost in Transit: Product Replacement Bias and Pricing to Market." American Economic Review 102 (7): 3277-3316.
* Byrne: Board of Governors of the Federal Reserve Systemu, 20th Street and Constitution Avenue, NW, Washington, DC, 20551 ([email protected]). Corrado: The Conference Board, 845 Third Avenue, New York, N.Y., 10022, and Center for Business and Public Policy, McDonough School of Business, Georgetown University, 37th and O Streets, NW, Washington, DC, 20067 ([email protected]). The views expressed in this article are not represented to be the views of the authors' affiliate institutions. The authors thank David Lebow, Jeremy Rudd, and John Stevens for helpful comments. Return to text
1. Coyle et al. (2019) propose a similar approach for the United Kingdom. Return to text
2. We split mobile phone service using household penetration for smartphones and feature phones and assume smartphone service is roughly four times as expensive as feature phone service. We employ industry sources to separate streaming service from rental of physical media. Return to text
3. Naturally, demand for internet service is derived from demand for the content. This relationship and the consumer IT ecosystem generally is discussed in greater detail in Byrne and Corrado (2020). Return to text
4. Fixed and mobile IP traffic is obtained from Cisco's Visual Networking Index (VNI). Return to text
5. Accounting for the additional volume associated with text messaging would yield faster price declines. Return to text
6. Viewing hours are based on reports form Nielsen Media Research and number of channels on Federal Communications Commission reports. Return to text
7. Viewing hours are based on Sandvine reports for aggregate data use by type and estimated data use per hour based on parameters reported by Netflix. Program library size is based on FCC reports and company statements. We assign feature films the weight of two series episodes and assume series seasons consist of 13 episodes. Return to text
8. The smartphone index falls exceedingly fast—an average of 50 percent per year from 2007 to 2018. Return to text
9. Hedonic quality adjustments are used for internet, wireless, and cable services (BLS, 2020). Return to text
10. Greenstein (2002) observed this issue for internet access services. Return to text
11. Nakamura and Steinsson (2012) identify this phenomenon—unchanging item prices—in the microdata for BLS trade price indexes as contributing to spuriously low "exchange rate pass-through" estimate. Return to text
12. Such an event is reportedly responsible for a sudden 11 percent decline in the CPI for wireless telephone services in 2017 (Leubdorf, 2017). Return to text
Byrne, David M., and Carol A. Corrado (2020). "The Increasing Deflationary Impact of Consumer Digital Access Services," FEDS Notes. Washington: Board of Governors of the Federal Reserve System, July 15, 2020, https://doi.org/10.17016/2380-7172.2619.
Disclaimer: FEDS Notes are articles in which Board staff offer their own views and present analysis on a range of topics in economics and finance. These articles are shorter and less technically oriented than FEDS Working Papers and IFDP papers.