FEDS Notes
May 14, 2021
The Treasury Market Flash Event of February 25, 2021
Alex Aronovich, Dobrislav Dobrev, and Andrew Meldrum1
Introduction
On February 25, 2021, there was an unusual "flash" event in U.S. Treasury markets. The prices of Treasury securities dropped sharply amid strained liquidity conditions, before recovering within about an hour. This event follows several similar episodes in recent years, including the flash event of October 2014, which was discussed in the Joint Staff Report on the U.S. Treasury Market on October 15, 2014 (PDF). Given the key role played by the Treasury market as the largest and most liquid sovereign bond market in the world, it is important for policymakers to understand the nature and causes of these episodes. This Note discusses what happened on February 25, what we currently know about the likely causes, and how it compares with previous similar episodes.
Leading up to the February 2021 episode, liquidity conditions in the Treasury market had largely recovered from the particularly severe episode of illiquidity that followed the onset of the COVID-19 pandemic in March 2020. The yields on Treasury securities had risen substantially from their pandemic-related troughs, in part following news of the arrival of COVID-19 vaccines and expectations of further fiscal support, as well as an increase in the issuance of longer-term Treasury securities. Since the beginning of 2021, the increase in yields became more rapid and market-implied measures of interest rate uncertainty had picked up; at the same time the volume of trading in Treasury securities rose notably.2
On February 25 itself, yields had continued their recent upward trend through the morning. Shortly after 1 p.m. yields spiked sharply higher, which market commentary linked to the release of the results of a 7-year Treasury note auction at 1 p.m. We show that trading conditions in the most liquid parts of the Treasury market deteriorated notably around the same time, with signs that liquidity provision by high-frequency market makers was insufficient to meet the heavy order flow.3 We further show that the episode was much less severe and shorter-lasting than the episode of March 2020, with the cost of trading as measured by bid-ask spreads quickly returning to normal levels. However, as of early April 2021, the total size of posted quotes on electronic order books ("market depth") has not yet fully recovered, which suggests that Treasury market liquidity may remain fragile even amid sizeable ongoing Treasury purchases by the Federal Reserve.
What Happened on February 25?
The prices of Treasury securities (which move inversely with yields) fell through the morning of February 25, amid elevated trading volumes, before dropping sharply lower shortly after 1 p.m., as shown by the black lines in Figure 1. Similar patterns were observed in prices in the Treasury futures market (not shown). The sharp spike mostly reversed within an hour, similar to some previous flash events in the Treasury market, including the flash event of October 15, 2014.
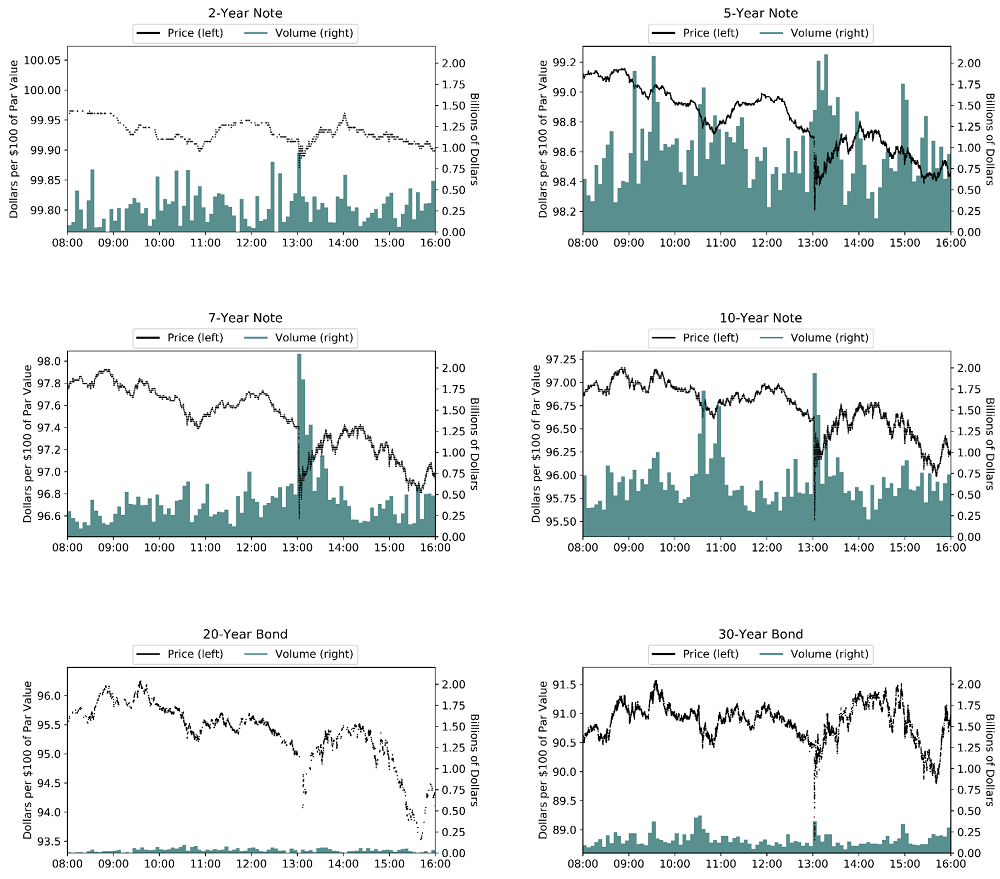
Note: Transaction prices (black dots) are expressed in dollars per $100 of par value. Five-minute total trading volume bars (blue bars) are expressed in billions of dollars. Top left panel shows transaction prices and volumes for the 2-year Treasury note; top right panel for the 5-year Treasury note; middle left panel for the 7-year Treasury note; middle right panel for the 10-year Treasury note; bottom left panel for the 20-year Treasury bond; bottom right panel for the 30-year Treasury bond. Timestamps are Eastern Standard Time.
Source: BrokerTec and authors' calculations.
Market commentary pointed to the proximate trigger for the spike down in prices being the release of the results of a 7-year note auction at 1 p.m.4 The auction tail (the difference between the average and lowest accepted prices) was unusually large, which investors may have interpreted as an indication that the market price of Treasury securities would need to fall further. That in turn may have triggered strong selling pressure; indeed, the spike down in the prices was accompanied by a sharp increase in trading volumes for most tenors (the blue bars in Figure 1 show volumes for the cash market).5 While the downward spike in prices quickly reversed, prices nevertheless resumed their downward trend over the day.
While the increase in trading volumes for most tenors after 1 p.m. was notable, it was hardly unprecedented; and similar spikes in volume have not usually resulted in large flash moves in prices (for example, elevated volumes were observed for some tenors earlier in the day on February 25, when seller-initiated trades persistently exceeded buyer-initiated trades).6 So the flash move after 1 p.m. suggests that the increase in volumes was also accompanied by an unusual deterioration in liquidity conditions. In the remainder of this section, we confirm that conjecture by taking a closer look at quoting and trading activity.
Trading in the most liquid parts of the Treasury cash market and in the Treasury futures market takes place over a "central limit order book." Market makers provide liquidity by posting limit orders—quotes to buy or sell a specified quantity of securities at a specified price—on a centralized order book. Other market participants can also provide liquidity by submitting limit orders or consume liquidity by submitting market orders, that is, instructions to buy or sell a given quantity of securities at the best available price on the order book. The total dollar amount of quotes at the best few prices (or "levels"), commonly referred to as "market depth," is often considered to be a measure of available liquidity; the more quotes are posted on the top levels of the order book, the easier it may be to buy or sell a given quantity of securities in a short period of time without moving the market price materially.
Panels A and B in Figure 2 show cash market depth at the top one and three levels of the order book for the 10-year note and 30-year bond, respectively. Quotes to buy are shown in blue above the horizontal axis, while quotes to sell are shown in red below the horizontal axis. In both cases, the data are plotted at a millisecond frequency and show the maximum depth available in each millisecond. Depth dropped sharply shortly after 1 p.m. pointing to a reduction in the willingness of market makers to post quotes.
However, while market depth is commonly viewed as a measure of liquidity, in some past episodes when depth has fallen sharply, the costs of trading as measured by the bid-ask spreads between the best available buy and sell quotes have not increased markedly. Even if market makers reduce the amount of quotes posted to the order book, if they continue to replenish quotes rapidly in response to incoming orders, and if orders are broken into sufficiently small chunks, then there may be little observable impact on trading costs.7 This appears to have been the case for tenors up to 10 years on February 25. To see this for the 10-year note, consider the black dots in the upper panel of Figure 2.A, which show the total size of all executed orders to buy (above the axis) and sell (below the axis) the 10-year note. The total size of executed orders generally remained well inside the posted depth after 1 p.m., so bid-ask spreads (shown in the lower-left panel) were fairly stable.
However, for longer tenors (the upper panel of Figure 2.B shows the same measures for the 30-year bond) the total size of executed orders often exceeded depth at the top few levels of the order book, meaning that some transactions were taking place at relatively unfavorable prices, so measured bid-ask spreads (the lower panel) repeatedly widened temporarily, until the order book was replenished, when spreads tightened again. Thus, the volatility of spreads increased, as well as the average level. As discussed by Dobrev and Meldrum (2020), a coincident drop in market depth and increases in the level and volatility of spreads indicates that the speed of order book replenishment was insufficient to meet incoming order flow without leading to higher trading costs. That in turn suggests a reduction in the activity of market makers that post quotes at high frequencies using automated algorithms.8 Those high-frequency market makers likely include so-called principal trading firms, but also other market participants, including bank dealers as well as some hedge funds.9
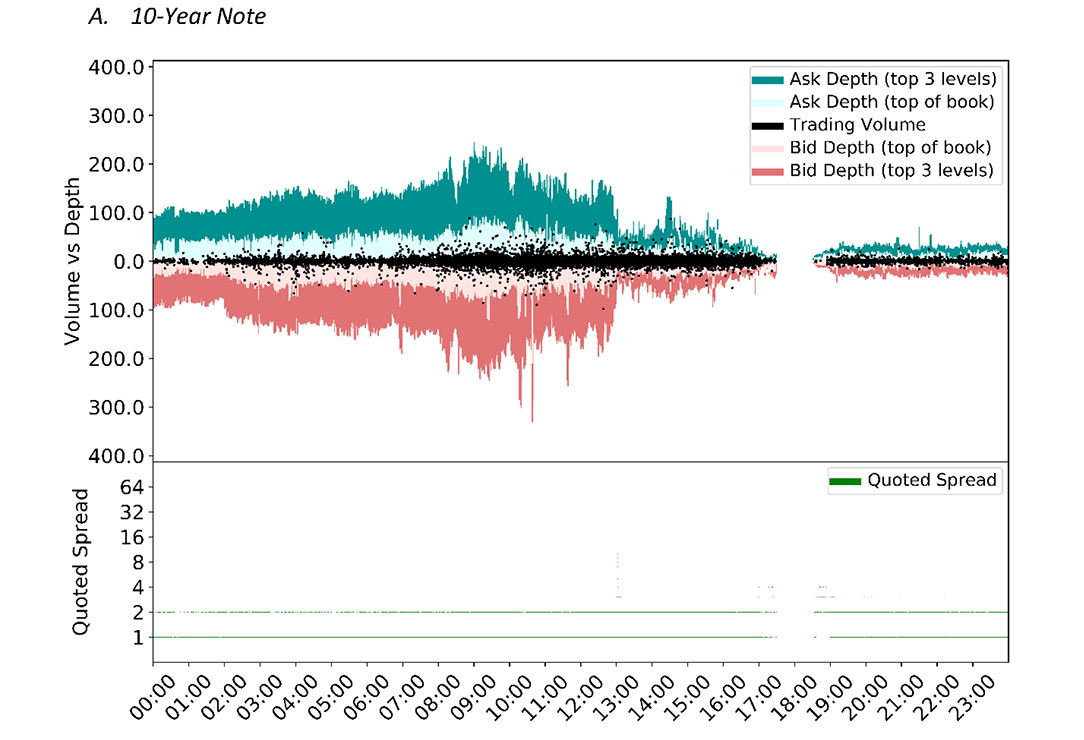
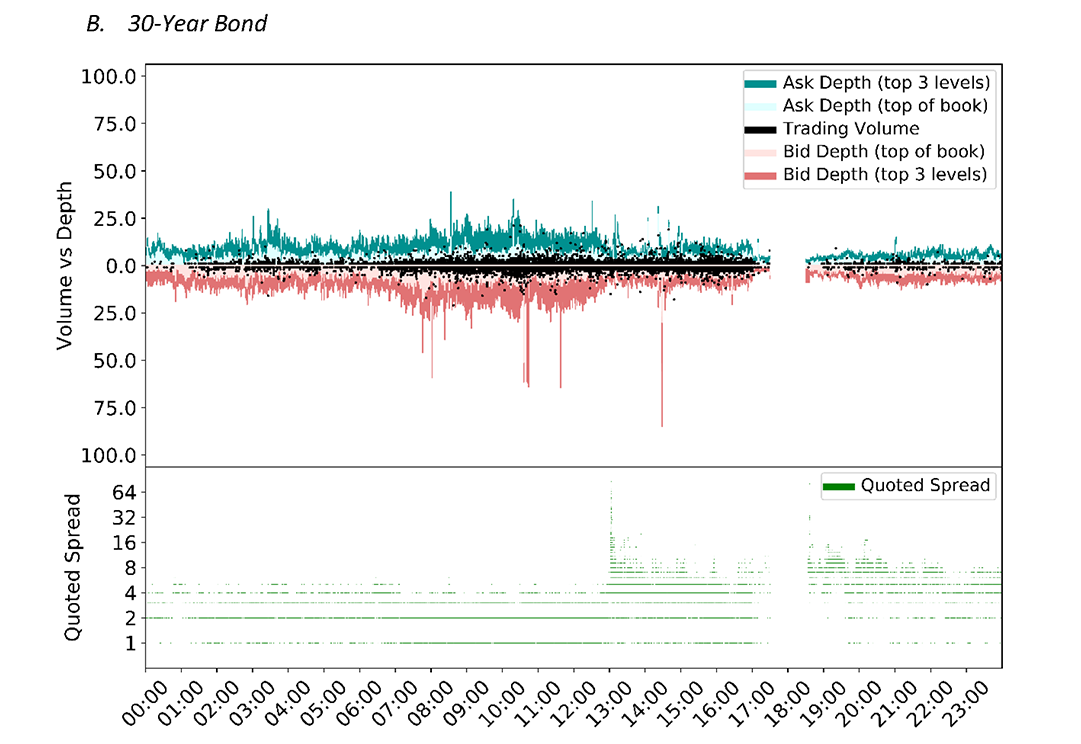
Note: For further methodological notes see Dobrev and Meldrum (2020).
Source: BrokerTec and authors' calculations.
Why Did the February 2021 Flash Event Happen?
While it seems fairly clear that the Treasury auction on February 25 was the proximate trigger, the reasons that this caused selling pressure and a withdrawal of high-speed liquidity provision are hard to piece together with certainty. This is in part because we cannot deduce from the available data how automated trading algorithms work, what data they take as inputs, and when market participants might turn particular algorithms on and off.
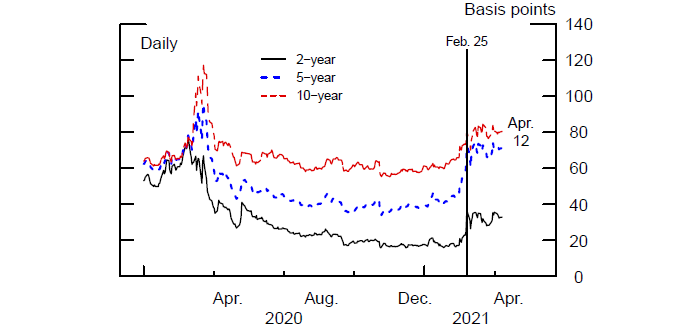
However, a couple of factors are likely relevant. First, the February 25 episode came against a backdrop of rising yields (and therefore falling prices) on longer-term Treasury securities and greater uncertainty about future yields amid heightened trading volumes. The pace with which longer-term yields (shown in Figure 3) were increasing had been particularly rapid over the previous month, and there had also been a notable increase in forward-looking measures of interest rate volatility (shown in Figure 4), particularly for the 5-year rate. This backdrop seems likely to have been an important factor that influenced both how market makers managed their risk exposures and how market participants interpreted the signal about future yields from the February 25 auction results.
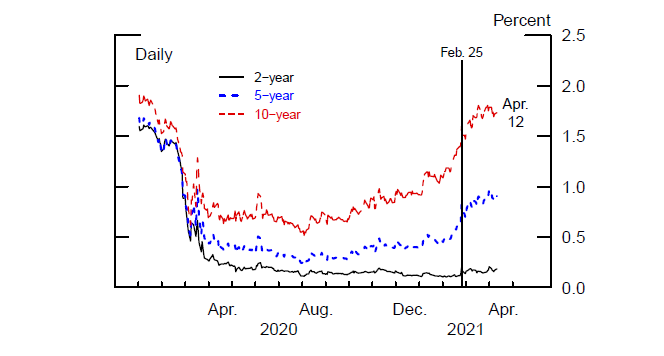
Note: Yields are for notional par Treasury securities with semiannual coupons obtained from a smoothed yield curve estimated from off−the−run Treasury coupon securities.
Source: Federal Reserve Bank of New York and Board staff calculations.
Note: Implied volatility is derived from 2-year, 6-month-ahead; 5-year, 6-month-ahead; and 10-year, 6-month-ahead swaptions.
Source: Barclays.
Second, high-frequency market makers may have felt that their algorithms were temporarily less reliable at determining the "correct" price. In general, high volatility need not be a bad thing for high-speed algorithmic market makers; if they can react more quickly to incoming data than other market participants, a period of high volatility may even present additional profit opportunities. However, that relies on their algorithms continuing to reliably determine the correct price even in turbulent market conditions, which in turn relies on stable relationships between different prices. While we do not know the details of the algorithms used by market participants, market commentary suggests that a breakdown in correlations between asset prices was a factor that caused some market participants to step back from posting quotes.10
Comparison to Past Similar Events
Figure 5 puts the February 25 episode into context by comparing it with the episode of market dysfunction that followed the onset of the COVID-19 pandemic in March 2020. Panel A shows daily time series of market depth, daily average bid-ask spread and intraday volatility of the bid-ask spread for the 2-year (the green dotted line), the 5-year (the red line), and the 7-year notes (the blue dashed line), while Panel B shows the same measures for the 10-year note (the green dotted line), the 20-year bond (the red line), and the 30-year bond (the blue dashed line). Market depth declined sharply for all maturities on February 25, reminiscent of the declines observed following the onset of the COVID-19 pandemic in March 2020. However, the severity of the impact on spreads in February 2021 was far less than that in March 2020, particularly for longer maturities, while the subsequent recoveries in spreads have been much faster.
While market depth has largely recovered for most maturities since the February 2021 flash event, it remains relatively low for the 5-year note. This is an unusual pattern, because depth tends to recover quickly for shorter maturities following episodes of illiquidity. However, it seems consistent with the relatively large recent increase in uncertainty around the 5-year horizon, as discussed in the previous section. Of note, the experience of March 2020 suggests that while depth remains relatively low, the risk of an increase in trading costs may be elevated; the sharp spike in the level and volatility of bid-ask spreads at that time was preceded by a similar period of low market depth during which market functioning was more heavily reliant on high-speed liquidity replenishment.
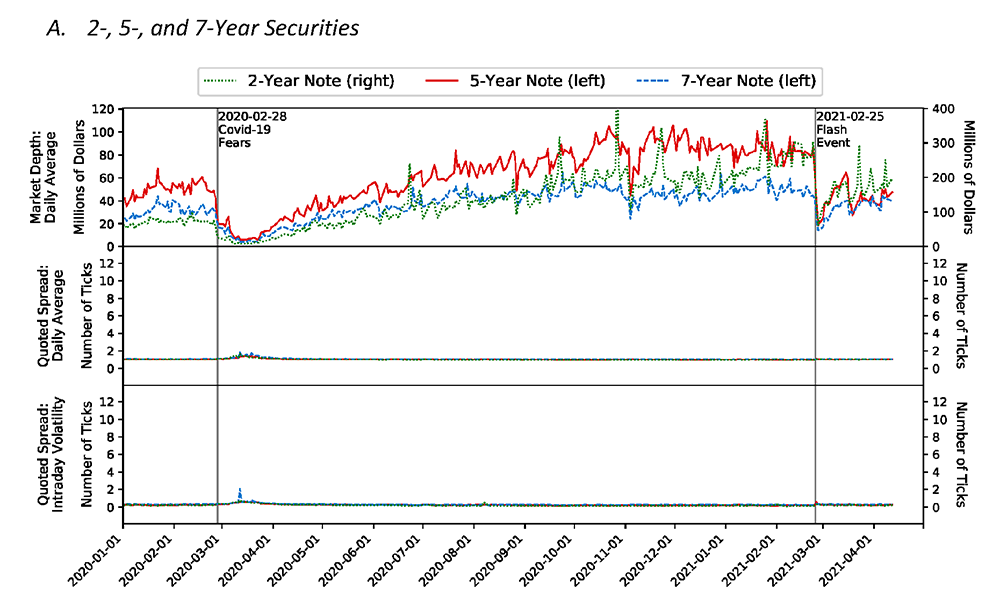
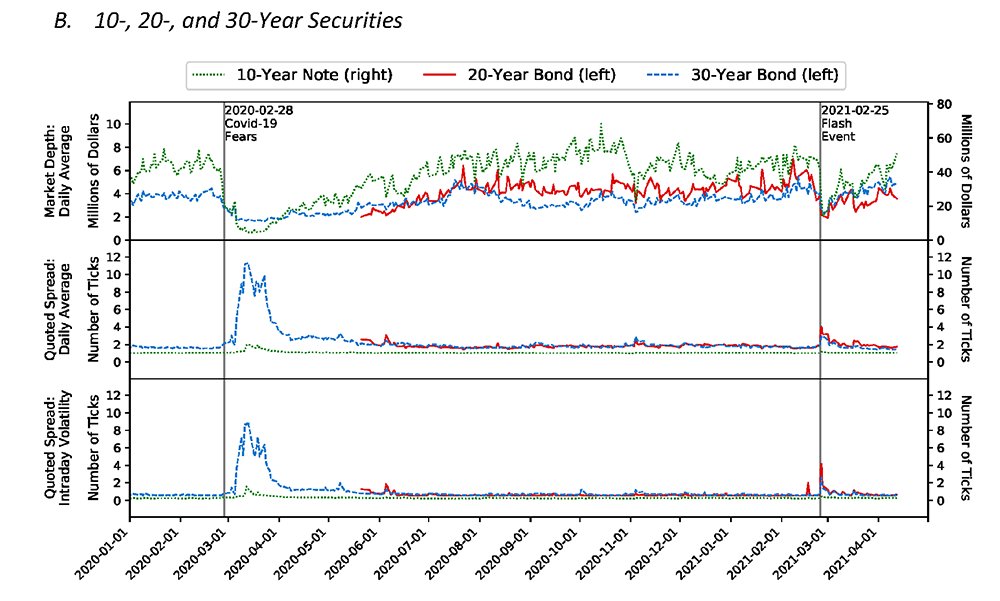
Note: For further methodological notes see Dobrev and Meldrum (2020). The 20-year bond was first issued in May 2020.
Source: BrokerTec and authors' calculations.
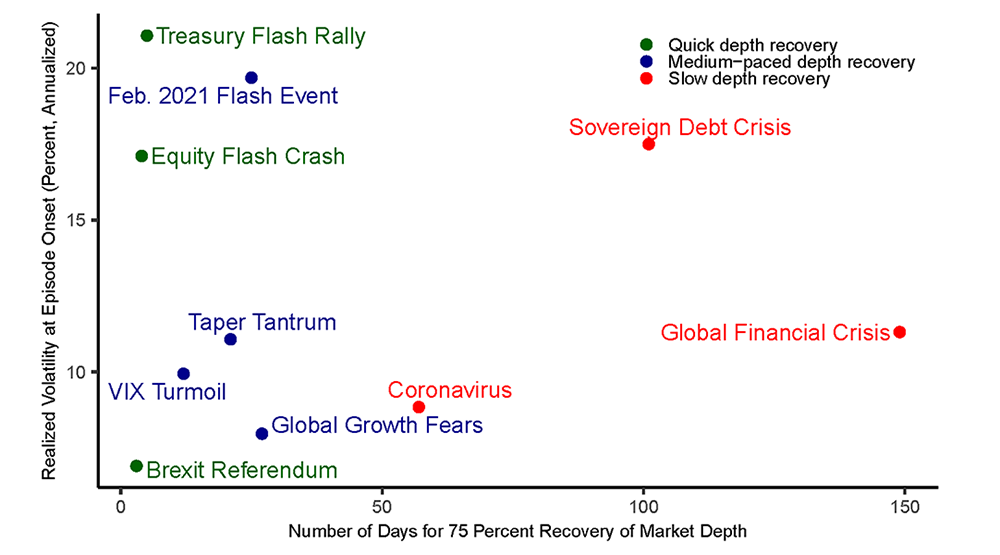
We next put the duration of the episode into broader context by comparing it with nine other episodes (listed in Table 1) when depth in the Treasury market has dropped notably and suddenly during the past several years. For these purposes, we focus on the time it takes for depth to recover after the episode. Figure 6 shows the evolution of depth for the 10-year Treasury note on the days around the ten events.11 To assist in illustrating the speed of recovery, Table 1 reports the number of business days it took for a 3-day moving average of depth to recover at least 75 percent of the initial decline (defined as the difference between the average depth over three days preceding the episode and depth on the start day of the episode). We can separate the events into three categories:
- The left panel of Figure 6 and the upper panel of Table 1 show events with a quick depth recovery within a few days. Two of these three events were associated with other flash moves in prices—the equity flash crash of May 2010 and the Treasury flash rally in October 2014—when sharp movements in asset prices that were not associated with a clear fundamental trigger reversed quickly. The third followed the Brexit referendum, which delivered a surprise result but did not have a major impact on the uncertainty around Treasury yields.
- The center panel of Figure 6 and the center panel of Table 1 show events with a medium-paced recovery within a month or so. These events seem to be characterized by more substantial economic and financial market uncertainty, and include the June 2013 "taper tantrum" in the Treasury market, the February 2018 "VIX turmoil" when the volatility of stock prices rose sharply, and the episode of growing concerns among investors about the global growth outlook in August 2019. Based on the trajectory of depth recovery, the February 2021 episode appears to belong to this category, which appears consistent with the recent increase in uncertainty about longer-term interest rates.
- The right panel of Figure 6 and the lower panel of Table 1 show events with an even slower depth recovery taking months. These events had a more severe impact on financial markets, and include the Global Financial Crisis (dated here to coincide with the bankruptcy of Lehman Brothers in September 2008), the episode of investor concern about European sovereign debt positions in August 2011, and the market turmoil following the onset of the COVID-19 pandemic in March 2020.
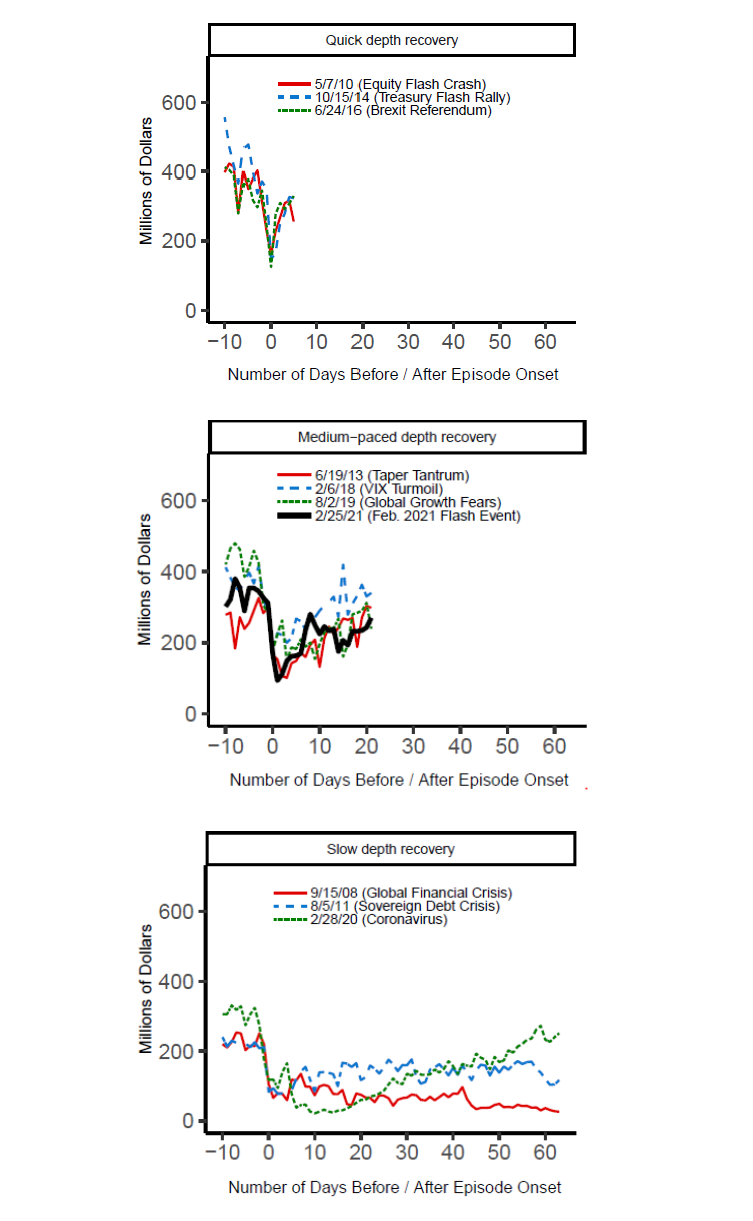
Note: Market depth is computed as the average of the cumulative sum of the posted quote sizes at the first five bid and ask levels of the order book for the 10-year on-the-run Treasury note. The event date is taken to be the largest initial drop in depth surrounding well-known episodes of market stress. Quick, medium-paced, and slow depth recovery lines are cut off at one business week, one business month, and three business months, respectively, to show the different nature of these events.
Source: BrokerTec and authors’ calculations.
Table 1. Time for Market Depth Recovery for the On-the-Run 10-Year Treasury Note Following Episodes of Market Stress
| Event | Date | Number of Business Days until 75 Percent Depth Recovery† | |
|---|---|---|---|
| Quick Depth Recovery | Equity Flash Crash | 5/7/2010‡ | 4 |
| Treasury Flash Rally | 10/15/2014 | 5 | |
| Brexit Referendum | 6/24/2016 | 3 | |
| Medium-Paced Depth Recovery | Taper Tantrum | 6/19/2013 | 21 |
| VIX Turmoil | 2/6/2018 | 12 | |
| Global Growth Fears | 8/2/2019 | 27 | |
| Flash Event | 2/25/2021 | 25 | |
| Slow Depth Recovery | Global Financial Crisis | 9/15/2008 | 149 |
| Sovereign Debt Crisis | 8/5/2011 | 101 | |
| Coronavirus | 2/28/2020 | 57 |
Note: † The drop in market depth is calculated as the difference of depth after its initial drop on each event date and a three-day average of depth one day prior to the event date. The reported day counts are taken with respect to the first day when a three-day moving average of depth has recovered 75 percent of the initial drop in market depth. ‡ While the equity flash crash occurred on May 6, 2010, it took place near the end of the day and Treasury market depth continued to react sharply in the following day.
Source: BrokerTec and authors’ calculations.
In summary, although the available sample of episodes of notable sudden drops in market depth is small, and the above characterization is somewhat subjective, it does appear that the amount of economic uncertainty accompanying each episode has a bearing on the time it takes for market depth to recover. That observation raises the question of whether there is a systematic relationship between the recovery time and some observed measure of uncertainty. In particular, standard market microstructure theories emphasize the negative relationship between the realized volatility of asset prices and market depth (see, for example Nguyen, Engle, Fleming and Ghysels (2020)). However, Figure 7 shows that there is little correlation between the level of the realized volatility of the 10-year Treasury yield at the start of the episode and the time taken for market depth for the 10-year Treasury to recover to 75 percent of its pre-episode level.12 Unreported results also show there is little correlation between the same measure of volatility and the initial decline in depth. Thus, it appears that volatility may not by itself be a particularly good predictor of episodes of Treasury market illiquidity, or their severity and persistence.13 Furthermore, the time it takes for liquidity to recover may also depend in part also on actions taken by policy makers.
Figure 7. Depth Recovery Times and Volatility Spikes for the On-the-Run 10-Year Treasury Note following Different Episodes of Market Stress
Note: Day counts are measured in business days. Realized volatility at the onset of each episode is taken to be the maximum realized volatility between the day before the episode and the day of the episode. The drop in market depth is calculated as the difference of depth after its initial drop on each event date and a three-day average of depth one day prior to the event date. The reported day counts are taken with respect to the first day when a three-day moving average of depth has recovered 75 percent of the initial drop in market depth.
Source: BrokerTec and authors' calculations.
Although market depth has taken over a month to partially recover following the February 2021 episode, with longer-lasting impacts for short-and-medium dated securities than long-dated securities, measures of the cost of trading such as the level and volatility of bid-ask spreads subsided back to their prior levels within a few days (as they did following most of the episodes discussed above). This suggests that there was only a fairly short period where the velocity of order book replenishment by high-speed market makers was not always sufficient to meet order flow without moving prices and quoted spreads materially. However, the fact that market depth generally takes longer than spreads to fully recover suggests that liquidity may remain fragile for a period after such episodes, because liquidity provision appears to be more heavily reliant on high-speed replenishment by market makers to meet trading demand.14
The Impact on Futures Markets
While the above analysis has focused on the cash part of the Treasury market where on-the-run securities are traded for spot delivery, activity in that part of the market is tightly linked to the futures part of the market where Treasury securities are traded for future delivery. As documented by the Joint Staff Report on the U.S. Treasury Market on October 15, 2014 (PDF) and Dobrev and Schaumburg (2015a, 2015b and 2018), there is substantial high-speed cross-market trading between cash and futures markets, including by participants who attempt to take advantage of relative mispricing between the markets. That raises the question of whether the deterioration in cash market liquidity also spilled over to the futures market.
Figure 8 shows daily time series of market depth, average bid-ask spreads, and the volatility of bid-ask spreads for three different Treasury futures contracts traded on the Chicago Mercantile Exchange. While depth also dropped notably in the futures market, the impact on bid-ask spreads was negligible, suggesting that order book replenishment remained sufficiently fast such that there was no material increase in trading costs. The finding that the futures market was less affected than the cash market is consistent with what we observed in March 2020, as documented previously by Dobrev and Meldrum (2020).15 However, in contrast to the systemic shock to liquidity in March 2020, unreported results show that the impact of the February 2021 event on other futures markets, including those for key equity indices and foreign exchange rates, was also limited.
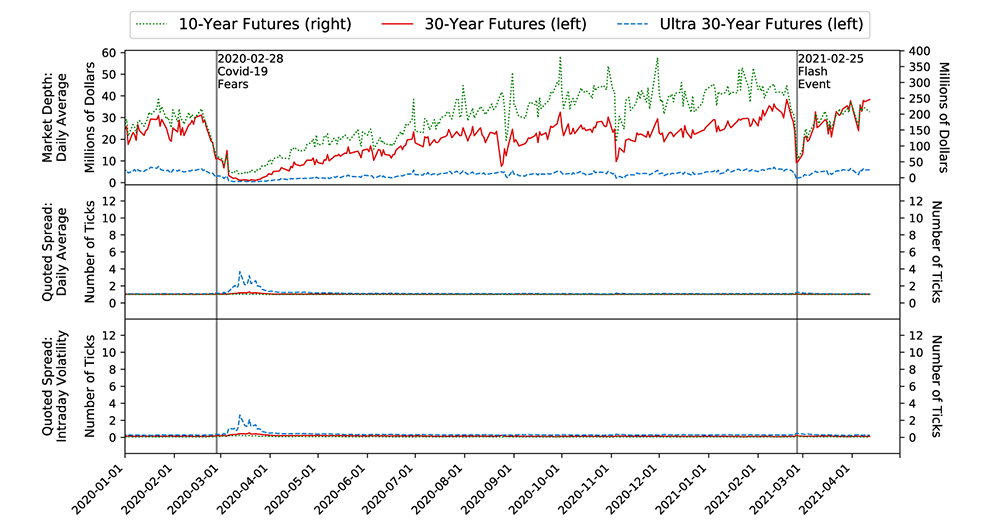
Note: For further methodological notes see Dobrev and Meldrum (2020).
Source: Refinitiv, Datascope Tick History, and authors' calculations.
Conclusion
The Treasury market flash event of February 25, 2021 underscores the pivotal role of high-speed liquidity provision in the most liquid electronic parts of the Treasury market. We find evidence that the sharp drop in prices that day was accompanied by a sudden drop in market depth and a brief deterioration in high-speed liquidity provision amid elevated transaction volumes, albeit to a much lesser extent than during the episode of severe illiquidity in March 2020. Similar to some previous episodes accompanied by moderately elevated economic and financial market uncertainty, market depth has recovered steadily since February 25 at a pace comparable to that observed following other such episodes, while high-speed liquidity provision appears to have rebounded fairly quickly. That said, market depth has taken over a month to partially recover, which suggests that Treasury market liquidity has been more heavily reliant on high-speed replenishment to meet trading demand and may remain fragile.
References
Andersen T. G., D. Dobrev, E. Schaumburg (2012). "Jump-robust Volatility Estimation Using Nearest Neighbor Truncation." Journal of Econometrics 169, pp. 75-93.
Baker L., L. McPhail, and B. Tuckman (2020). "The Liquidity Hierarchy in the US Treasury Cash and Futures Market." Journal of Fixed Income, 30 (1), pp. 90-99.
Bank for International Settlements (2018). "Monitoring of Fast Paced Electronic Markets." Markets Committee Report, No 10.
Bank for International Settlements (2020). "FX Execution Algorithms and Market Functioning." Markets Committee Report, No 13.
Brain, D., M. De Pooter, D. Dobrev, M. Fleming, P. Johansson, C. Jones, F. Keane, M. Puglia, L. Reiderman, T. Rodrigues, and O. Shachar (2018). "Unlocking the Treasury Market through TRACE." FEDS Notes. Washington: Board of Governors of the Federal Reserve System, September 28, 2018, https://doi.org/10.17016/2380-7172.2251.
Brainard, L. (2018). "The Structure of the Treasury Market: What Are We Learning?" Speech delivered at "The Evolving Structure of the U.S. Treasury Market" Fourth Annual Conference, Federal Reserve Bank of New York, December 3, 2018.
Dobrev, D., and A. Meldrum (2020). "What Do Quoted Spreads Tell Us About Machine Trading at Times of Market Stress? Evidence from Treasury and FX Markets during the COVID-19-Related Market Turmoil in March 2020." FEDS Notes. Washington: Board of Governors of the Federal Reserve System, September 25, 2020, https://doi.org/10.17016/2380-7172.2748.
Dobrev D. and E. Schaumburg (2015a). "High-Frequency Cross-Market Trading in U.S. Treasury Markets." Federal Reserve Bank of New York Liberty Street Economics, August 19, 2015.
Dobrev D. and E. Schaumburg (2015b). "The Liquidity Mirage." Federal Reserve Bank of New York Liberty Street Economics, October 9, 2015.
Dobrev, D. and E. Schaumburg (2018). "High-Frequency Cross-Market Trading: Model Free Measurement and Applications (PDF)." Working Paper, Federal Reserve Bank of Atlanta Workshop on "Financial Stability Implications of New Technology", October 18-19, 2018.
Duffie, D. (2020). "Still the World's Safe Haven? Redesigning the U.S. Treasury Market after the COVID-19 Crisis (PDF)." Hutchins Center Working Paper 62.
Fleming, M. (2016). "U.S. Treasury Market Action on Election Night 2016." Federal Reserve Bank of New York Liberty Street Economics, October 26, 2018.
Fleming, M. and F. Ruela (2020). "How Liquid is the New 20-Year Treasury Bond?" Federal Reserve Bank of New York Liberty Street Economics, July 1, 2020.
Jacod J., Y. Li, P. A. Mykland, M. Podolskij, and M. Vetter (2009). "Microstructure noise in the continuous case: The pre-averaging approach." Stochastic Processes and their Applications 119, pp 2249-2276.
Joint Staff Report (2015). "The U.S. Treasury Market on October 15, 2014 (PDF)." U.S. Department of the Treasury, Board of Governors of the Federal Reserve System, Federal Reserve Bank of New York, U.S. Securities and Exchange Commission, and U.S. Commodity Futures Trading Commission.
Nguyen G., R. Engle, M. Fleming and E. Ghysels (2020). "Liquidity and Volatility in the U.S. Treasury Market." Journal of Econometrics, 217, pp. 207-229.
Schrimpf, A., H.-S. Shin, and V. Sushko (2020). "Leverage and Margin Spirals in Fixed Income Markets during the COVID-19 Crisis." BIS Bulletin 2, April 2, 2020.
Schaumburg, E. and R. Yang (2015). "Liquidity during Flash Events." Federal Reserve Bank of New York Liberty Street Economics, August 18, 2015.
Smith, C., E. Platt, and R. Wigglesworth (2021). "U.S. Treasury Bond Wobble Heightens Concerns over Health of $21tn Market." Financial Times, March 3, 2021.
St. John, H. J. Younger, and S. Aggarwal (2020). "The Life Aquatic: Deeper Depth in the Treasury Market Infrastructure." J.P. Morgan Fixed Income Strategy, June 5, 2020.
St. John, H., J. Younger, J. Barry, C. W. Paiva, P. White and N. Matejkova (2021). "Same, but Different: Treasury Market Microstructure Stumbles." J.P. Morgan Fixed Income Strategy, February 26, 2021.
Vissing-Jorgensen, A. (2021). "The Treasury Market in Spring 2020 and the Response of the Federal Reserve (PDF)." Working paper, April 5, 2021.
1. We thank Ellen Correia Golay, Michiel De Pooter, Michael Fleming, Frank Keane, Don Kim, and Jake Schurmeier for helpful comments and suggestions. Return to text
2. Data on Treasury trading volumes are available from the Financial Industry Regulatory Authority, at https://www.finra.org/finra-data/treasury-weekly-aggregates. Return to text
3. In this Note, we focus on electronic trading in on-the-run Treasury securities and Treasury futures contracts, which are the most liquid parts of the Treasury market. In contrast to the March 2020 episode, trading conditions in off-the-run Treasury securities appeared relatively unaffected. Return to text
4. See, for example, Smith, Platt, and Wigglesworth (2021). Return to text
5. The exception to the pattern of elevated trading volumes was for the 20-year bond, for which volumes dropped to zero for about 5 minutes. Trading conditions in the 20-year bond appeared worse than in the 30-year bond on February 25, as shown by the large jumps between transaction prices ("price gapping") in the lower panels of Figure 1. Market commentary suggests that the strains for the 20-year bond were likely amplified by the fact that the episode occurred during the "when-issued" period before the issuance of the security, when the market is usually less liquid. The 20-year security is also relatively new and is generally less liquid (see, for example, Fleming and Ruela (2020)). Return to text
6. These earlier spikes in volumes were even more notable when expressed relative to the average volumes at the same time of the trading day on other Treasury auction days. For further details on how trading activity and imbalance between buyer-initiated and seller-initiated trades can help explain price or yield changes in Treasury markets, see for example Fleming (2018). Return to text
7. This behavior of high-speed market makers was discussed previously by Brainard (2018) and Dobrev and Meldrum (2020), among others. See also Bank for International Settlements (2018, 2020) for a broader discussion regarding implications for market functioning and monitoring market liquidity in electronic markets. Return to text
8. This result is consistent also with prior evidence based on another measure of the high-speed trading share of total liquidity provision by St. John and others (2021) and St. John, Younger, and Aggarwal (2020). Return to text
9. Brain and others (2018) provide more discussion about the different types of participants in the Treasury market. Return to text
10. Market commentary also pointed to this factor as contributing to the episode of illiquidity in March 2020. Return to text
11. We focus on the 10-year Treasury note as the most liquid on-the-run security in terms of risk-adjusted trading volume according to Baker, McPhail and Tuckman (2020). Return to text
12. To attain robustness to microstructure noise we employ the pre-averaged realized volatility estimator by Jacod, Li, Mykland, Podolskij and Vetter (2009). For further implementation details see Andersen, Dobrev and Schaumburg (2012). Return to text
13. This evidence provides further support for prior findings by Nguyen, Engle, Fleming and Ghysels (2020) to the effect that market liquidity may be important to explaining volatility dynamics but not vice versa. Return to text
14. In this respect, it is noteworthy that the most substantial deterioration in liquidity in the March 2020 episode, examined in depth by Duffie (2020), Schrimpf, Shin and Sushko (2020), and Vissing-Jorgensen (2021), among others, followed a period when market functioning had been orderly despite low depth for some time. Return to text
15. This also adds to prior evidence by Baker, McPhail and Tuckman (2020) to the effect that futures markets tend to remain more liquid than cash markets during times of stress. Return to text
Aronovich, Alex, Dobrislav Dobrev, and Andrew Meldrum (2021). "The Treasury Market Flash Event of February 25, 2021," FEDS Notes. Washington: Board of Governors of the Federal Reserve System, May 14, 2021, https://doi.org/10.17016/2380-7172.2909.
Disclaimer: FEDS Notes are articles in which Board staff offer their own views and present analysis on a range of topics in economics and finance. These articles are shorter and less technically oriented than FEDS Working Papers and IFDP papers.