FEDS Notes
November 25, 2019
The U.S. Syndicated Term Loan Market: Who holds what and when?
Seung Jung Lee, Dan Li, Ralf R. Meisenzahl, and Martin J. Sicilian1
Introduction
The large increase in leveraged term loan originations in the syndicated lending market recently has called into question whether banks are sufficiently prepared for a significant downturn in economic activity stemming from problems in the corporate sector. Banks face risks from a variety of channels in this dynamic market, which has become more reliant on an originate-to-distribute model over the past two decades with the rapid growth of participation in these syndicated loans from institutional investors such as CLOs and mutual funds (Aramonte, Lee, and Stebunovs (forthcoming) and Irani, Iyer, Meisenzahl, and Peydró (2018)). First, with some portion of the term loans remaining on banks' balance sheets, banks are susceptible to losses from increases in loan defaults and mark-to-market losses from declines in the secondary loan prices.2 Second, during the loan syndication process—that is, before a loan is originated—banks are exposed to sudden insufficient demand by other nonbank investors for these loans. In such cases, banks are forced to retain large share of these loans on their balance sheets.3 This so-called "pipeline risk," especially as it relates to committed funds prior to launching a deal, has been well documented in the industry and in the literature (Bruche, Malherbe, and Meisenzahl (2017)). This note looks carefully at the transition of ownership of syndicated term loans immediately after a deal is launched based on the Shared National Credit data.4 We shed further light on who eventually ends up investing in these loans and the consequences of the materialization of pipeline risk during the origination process forcing banks to initially hold larger loan shares.5
Leveraged loans in the Shared National Credit data
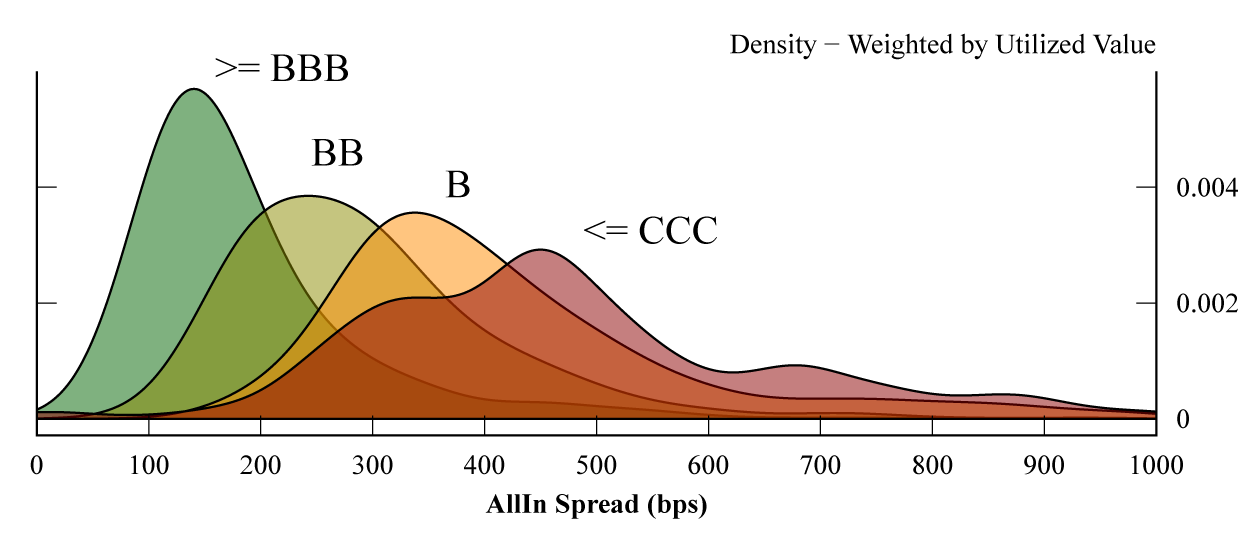
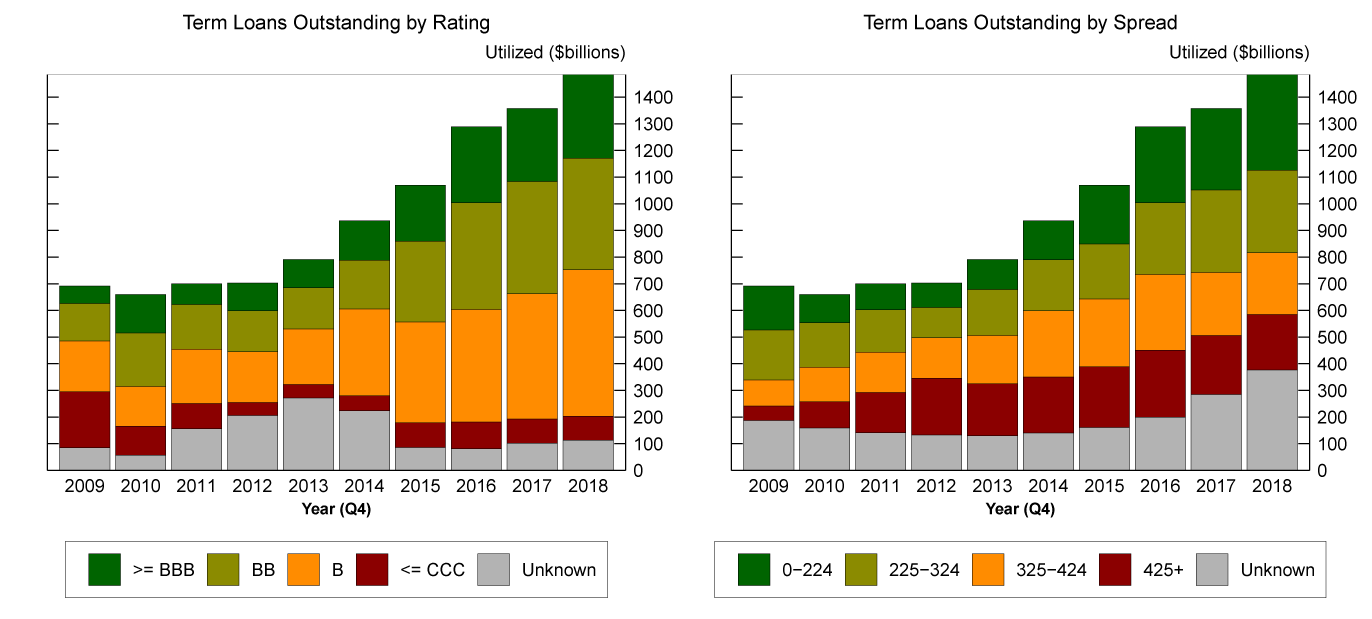
We first link the Shared National Credit data to ratings and pricing data from supervisory data and proprietary data using the same methods used in Calem, Correa, and Lee (forthcoming) and Cohen et al. (2018). We can then categorize loans by their risk profiles. We use the internal borrower ratings of the administrative agent ("agent")—the bank in charge of collecting and dispersing interest payments and relevant information. Figure 1 shows that the ratings and loan spreads are highly correlated. In the left panel of Figure 2, we then categorize loans according to the ratings. If we define leveraged loans as noninvestment-grade loans (BB or lower), the total leveraged loans outstanding is about $1.2 trillion as of the end of 2018. The large increase over the past decade has been driven by a dramatic increase in B-rated loans. In the right panel, we categorize loans according to the pricing of the loan.6 Following industry norm, we also classify a loan to be a "highly leveraged loan" if the issuance spread is 225 basis points or more above LIBOR. By this definition, the outstanding amount of leveraged loans is slightly lower.7 In both cases, the leveraged segment appears to have grown dramatically in the past decade.
Source: Shared National Credit and Refinitiv LPC DealScan.
Note: Legend entries appear in order from top to bottom.
Source: Shared National Credit and Refinitiv LPC DealScan.
Post-syndication distribution of Loan Shares
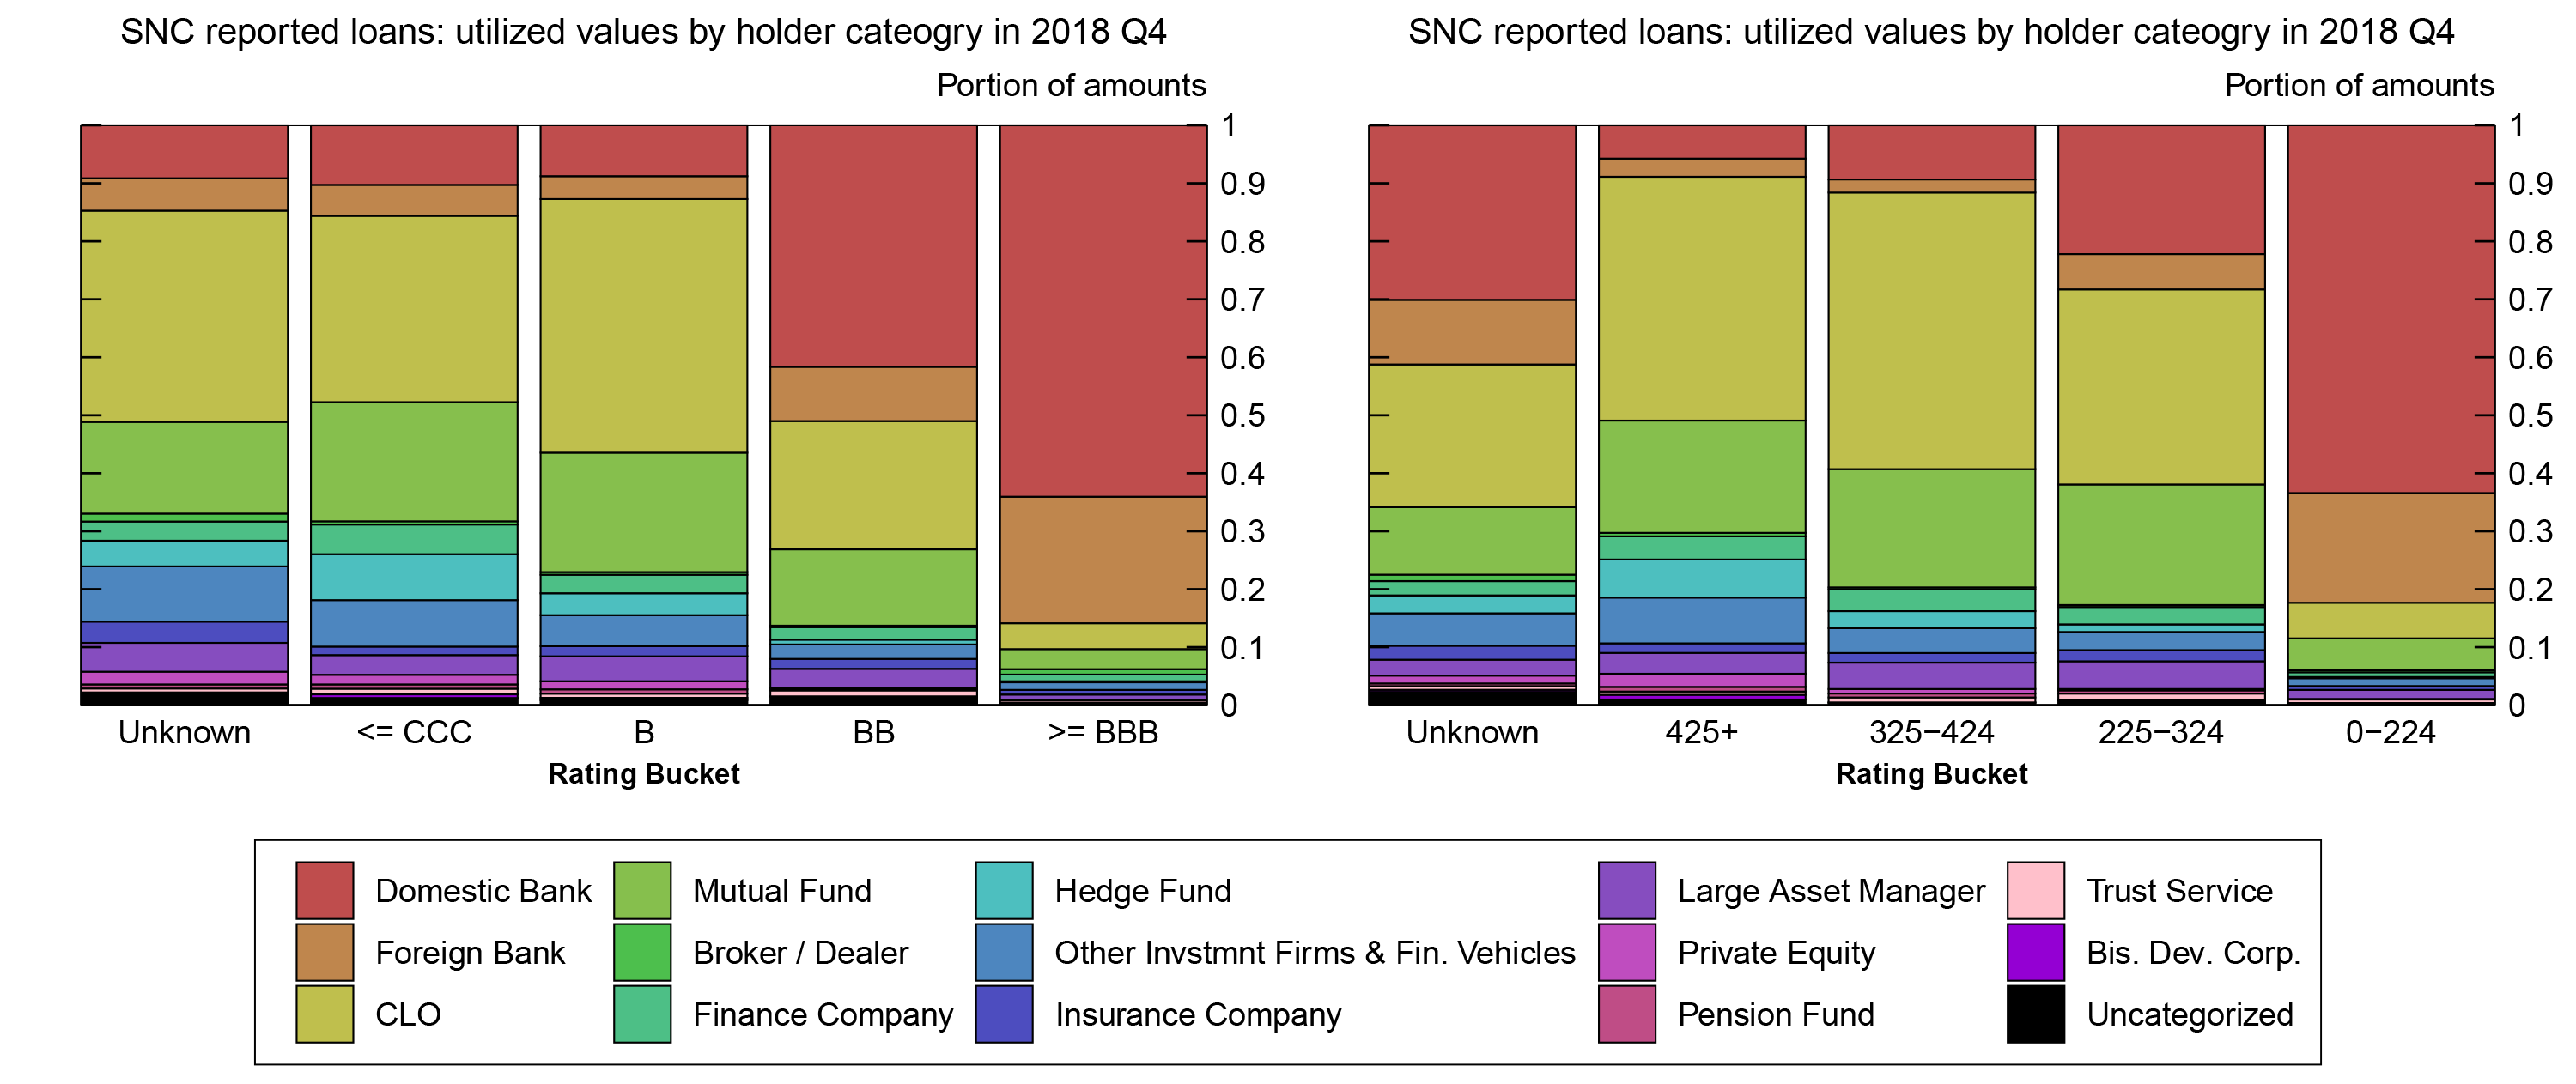
Figure 3 shows types of lenders for loans of various riskiness using data as of the end of 2018.8 Loans that are either above investment grade or have spreads lower than 225 basis points, which are on average larger in loan size, are primarily held by banks. In contrast, further down the risk profile, loans with ratings of B or spreads between 325 and 425 basis points are primarily held by CLOs.9 Mutual funds, on the other hand, appear to invest more evenly across different types of leveraged loans. Finally, we can see alternative lenders, such as hedge funds, investing in some of the highest risk/spread loans. These types of holding patterns have been relatively consistent throughout the past decade (not shown).
Note: Legend entries appear in order from top to bottom.
Source: Shared National Credit, Refinitiv LPC DealScan, National Information Center, LPC Collateral, CreditFlux, MorningStar, Emerging Portfolio Fund Research, various Securities and Exchange Commission filings (such as ADV filings), Investment and Pensions Europe, Pitchbook, SNL Financial, and the Employee Benefits Security Administration.
Given that the SNC data is a snapshot of loan holdings at quarter end, and loans were issued at different points throughout the quarter, we can gauge the speed in which these leveraged term loans are sold off to various lenders after origination. We take all loans originated within a particular quarter and group them into buckets based on when in the quarter they were originated. We then aggregate all the different types of lenders holding the loan based on the "days since origination" distribution. This gives us an idea of which types of lenders are holding the loans closer to or farther away from the origination date.
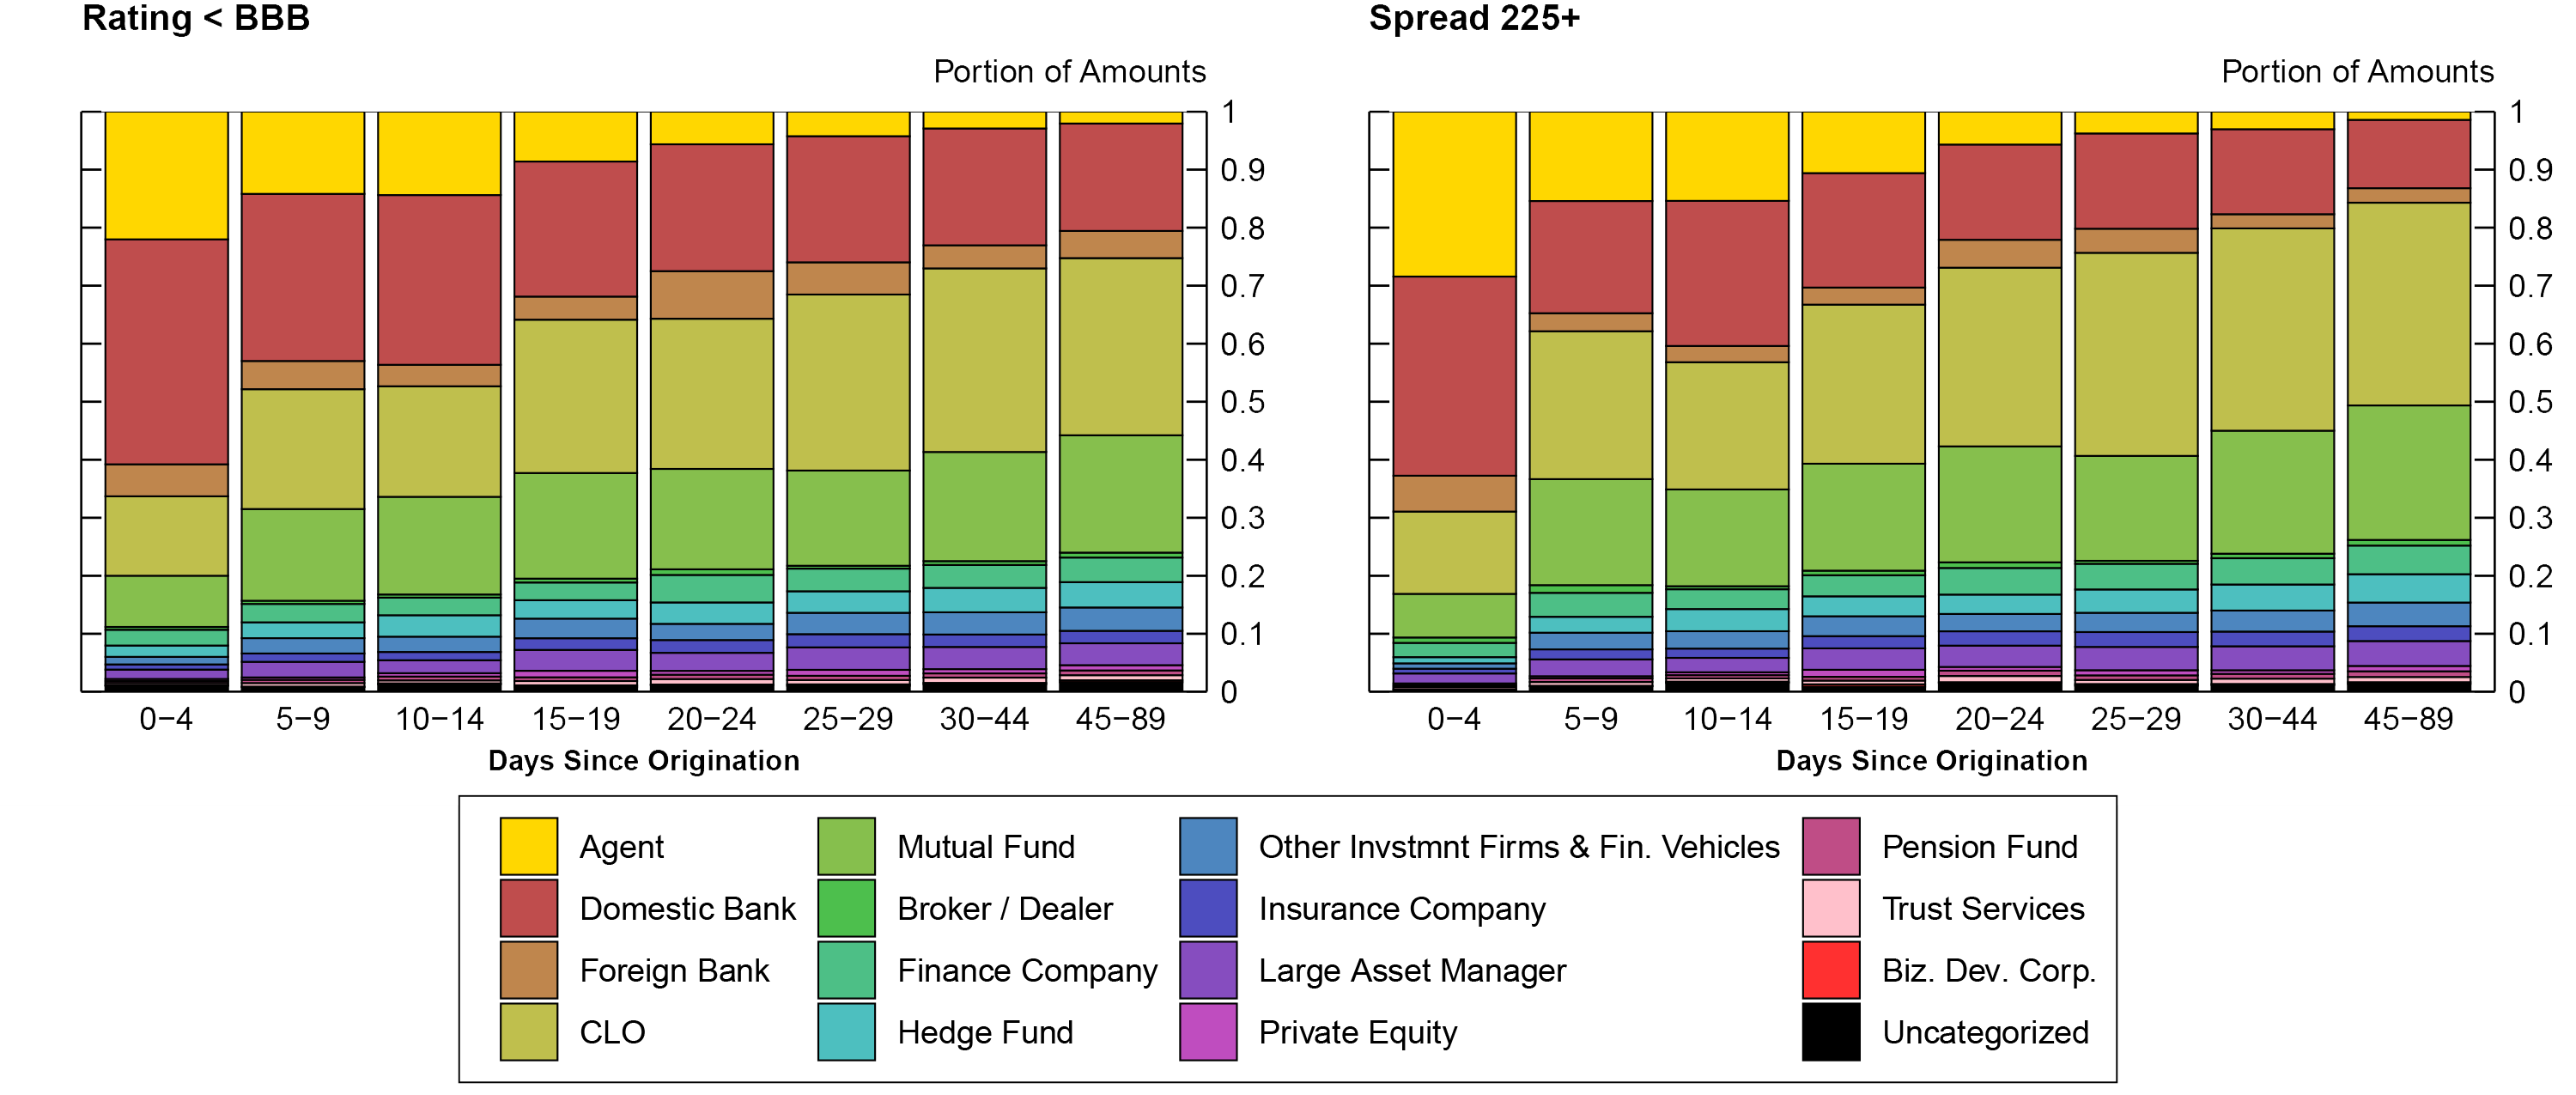
Figure 4 provides a glimpse of how loans are sold off, on average, from banks to various different types of investors in the leveraged term loan market within the first three months of issuance. The left panel shows only non-investment grade loans and the right panel shows loans with spread greater than 225 basis points. In both panels, we see that various banks (including the agent bank in yellow) hold the vast majority of the loans shortly after origination date, but then sell large shares of them off to institutional investors relatively quickly. It takes about a month and a half for banks to end up holding only about 25 percent of speculative grade loans and only about 15 percent of the loans associated with spreads greater than 225 basis points above LIBOR.10 Our finding suggests that the originate-to-distribute process extend beyond the origination date. The risk that these loans cannot be sold off to the target investors has so far only been documented for the agent bank (Bruche, Malherbe, and Meisenzahl, 2017) but figure 4 shows that this risk extends to all banks in the syndicate. In particular, banks distribute loans with higher credit risk in normal conditions. Consequently, a market shutdown would force banks to hold these riskier loans on their balance sheets.
Note: Legend entries appear in order from top to bottom.
Source: Shared National Credit, Refinitiv LPC DealScan, National Information Center, LPC Collateral, CreditFlux, MorningStar, Emerging Portfolio Fund Research, various Securities and Exchange Commission filings (such as ADV filings), Investment and Pensions Europe, Pitchbook, SNL Financial, and the Employee Benefits Security Administration.
Figure 5 provides a snapshot of how this extended pipeline risk has evolved in the past decade. The left panel plots the weighted-average days in which it takes for a speculative-grade loan to be distributed to nonbank lenders such that the bank share drops below 30 percent. The right panel plots the same dynamics but for loans with spreads above 225 basis points reaching bank shares of 20 percent as banks eventually hold an even smaller portion of the highly leveraged credits. Both panels indicate that the speed in which banks are able to sell off these leveraged loans after origination has fluctuated over the past decade. In particular, banks had trouble selling off these loans during 2015 and 2016 when the credit market was volatile. Despite the market disruptions at the end of 2018, for the entire year of 2018, on average, the speed at which leveraged loans are sold off to institutional investors was one of the fastest over the sample period.
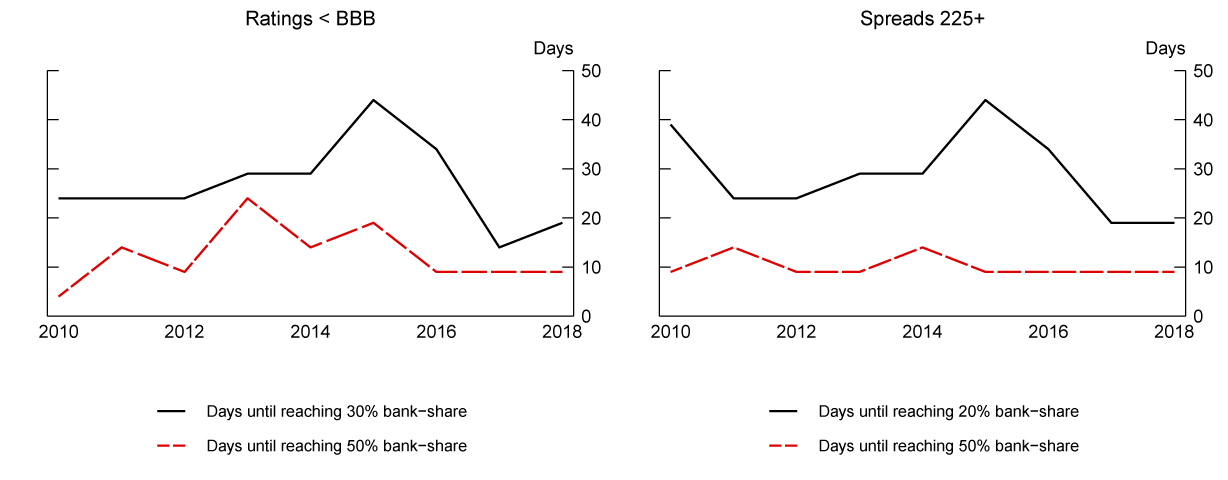
Source: Shared National Credit and Refinitiv LPC DealScan.
Conclusion
In this note, in the context of the rapid rise of leveraged loans, we document how different types of institutional lenders invest in syndicated term loans of different risk profiles. Banks generally target higher rated loans and loans with lower spreads to hold on their balance sheets, while CLOs target mostly B-rated loans. Banks continue to distribute leveraged term loans to nonbank investors well after the loans are originated. There are signs that the speed in which banks sell off these loans have increased over the past couple of years. Although the total amount of leveraged loans that could end up on banks' balance sheets may not be too large even in a severe market downturn, the banks may be forced to hold the riskiest loans on their balance sheets. In addition to the loans in the pipeline that has yet to be originated and the leveraged loans that are likely to increase through the drawdown in credit lines in the revolver loan segment, the risks associated with the potential inability of banks to sell off leveraged loans adds another layer of risk to banks' balance sheets that requires monitoring.
References
Aramonte, Sirio, Seung Jung Lee, and Viktors Stebunovs (forthcoming). "Risk Taking and Low Longer-term Interest Rates: Evidence from the U.S. Syndicated Term Loan Market," Journal of Banking & Finance.
Bruche, Max, Frédéric Malherbe, and Ralf R. Meisenzahl (2017). "Pipeline Risk in Leveraged Loan Syndication," Finance and Economics Discussion Series 2017-048. Board of Governors of the Federal Reserve System (U.S.).
Calem, Paul, Ricardo Correa, and Seung Jung Lee (forthcoming). "Prudential Policies and Their Impact on Credit in the United States," Journal of Financial Intermediation.
Cohen, Gregory J., Melanie Friedrichs, Kamran Gupta, William Hayes, Seung Jung Lee, W. Blake Marsh, Nathan Mislang, Maya Shaton, and Martin Sicilian (2018). "The U.S. Syndicated Loan Market: Matching Data," Finance and Economics Discussion Series 2018-085. Board of Governors of the Federal Reserve System (U.S.).
Irani, Rustom M., Raymakal Iyer, Ralf R. Meisenzahl, and José-Luis Peydró (2018). "The Rise of Shadow Banking: Evidence from Capital Regulation," Finance and Economics Discussion Series 2018-039. Board of Governors of the Federal Reserve System (U.S.).
Irani, Rustom M., and Ralf R. Meisenzahl (2017). "Loan Sales and Bank Liquidity Management: Evidence from a U.S. Credit Register," Review of Financial Studies, vol. 30, no. 10, pp. 3455-3501.
Lee, Seung Jung, Lucy Qian Liu, and Viktors Stebunovs (forthcoming). "Risk-Taking Spillovers of U.S. Monetary Policy in the Global Market for U.S. Dollar Corporate Loans," Journal of Banking and Finance.
Liu, Emily and Tim Schmidt-Eisenlohr (2019). "Who Owns U.S. CLO Securities?," FEDS Notes. Washington: Board of Governors of the Federal Reserve System, July 19, 2019, https://doi.org/10.17016/2380-7172.2423.
Marsh, Blake, and Seung Jung Lee (2019). "What's Driving Leveraged Loan Spreads?," Macro Bulletin, Federal Reserve Bank of Kansas City, pp. 1-5.
1. Seung Jung Lee ([email protected]) is a Section Chief in the Division of International Finance of the Federal Reserve Board of Governors, Dan Li ([email protected]) is an Assistant Director in the Division of Monetary Affairs of the Federal Reserve Board of Governors, Ralf Meisenzahl ([email protected]) is a Senior Economist at the Federal Reserve Bank of Chicago, and Martin Sicilian ([email protected]) is at Stanford University Law School. We thank Mary Chen, Jessica Goldenring, Charles Press, and Zack Saravay for excellent research assistance and data work. We thank seminar participants at the Federal Reserve Board for helpful comments. The note reflects the views of the authors and should not be interpreted as reflecting the views of the Board of Governors of the Federal Reserve System or anyone else associated with the Federal Reserve System. Return to text
2. Irani and Meisenzahl (2017) document large declines in secondary market prices of leveraged loans and that banks sold loans at these lower prices during the 2007-09 financial crisis. Return to text
3. In some deals, banks are not required to originate the loan if syndication fails. However, the largest leveraged loans finance leveraged buyouts or M&A activity and banks have to originate those loans even if demand by investors is low. Return to text
4. The Shared National Credit data is submitted by banks through the Shared National Credit (SNC) Program, The SNC program was established in 1977 to provide an efficient and consistent review and classification of SNC, which includes any loan and or/formal loan commitment extended to borrowers by a federally supervised institution, its subsidiaries, and affiliates is shared by three or more unaffiliated supervised institutions. We use quarterly data (with gaps) submitted by 30 CCAR banks, which include syndicated credits that they agented from 2009:Q4 to 2018:Q4. Although the SNC Program has reviewed credits with loan commitment amounts above different thresholds during this time period, in this note, we use all available syndicated term loan data submitted by the 30 CCAR agent banks, including those that did not meet the threshold. Return to text
5. Some of this is discussed in Lee, Liu, and Stebunovs (forthcoming). Return to text
6. This is based on the loan-level match between Refinitiv LPC DealScan and SNC data as in Cohen et al. (2018). Return to text
7. Marsh and Lee (2019) indicate that spreads for risky credits have trended down. Therefore, we may be underestimating the increase in risky credits according to the spread metric of credit risk. Return to text
8. We map lenders in SNC to lists of different categories of lenders from SNC, National Information Center, LPC Collateral, CreditFlux, MorningStar, Emerging Portfolio Fund Research, various Securities and Exchange Commission filings (such as ADV filings), Investment and Pensions Europe, Pitchbook, SNL Financial, and the Employee Benefits Security Administration. Return to text
9. Liu and Schmidt-Eisenlohr (2019) provides details on the different types of holders of U.S. CLO securities. Return to text
10. Many CLOs are issued in offshore financial centers like the Cayman Islands. In order not to have federal income tax liability, they cannot invest in loans at origination. In addition, passive investors, such as mutual funds cannot participate in the origination of loans. Return to text
Lee, Seung Jung, Dan Li, Ralf R. Meisenzahl, and Martin J. Sicilian (2019). "The U.S. Syndicated Term Loan Market: Who holds what and when?," FEDS Notes. Washington: Board of Governors of the Federal Reserve System, November 25, 2019, https://doi.org/10.17016/2380-7172.2473.
Disclaimer: FEDS Notes are articles in which Board staff offer their own views and present analysis on a range of topics in economics and finance. These articles are shorter and less technically oriented than FEDS Working Papers and IFDP papers.