FEDS Notes
September 20, 2019
Tracking the Labor Market with "Big Data"
Tomaz Cajner, Leland Crane, Ryan Decker, Adrian Hamins-Puertolas, and Christopher Kurz
Payroll employment growth is one of the most reliable business cycle indicators. Each postwar recession in the United States has been characterized by a year-on-year drop in payroll employment as measured by the BLS Current Employment Statistics (CES) survey, and, outside of these recessionary declines, the year-on-year payroll employment growth has always been positive. Thus, it is not surprising that policymakers, financial markets, and the general public pay a great deal of attention to the CES payroll employment gains reported at the beginning of each month.
However, while the CES survey is one of the most carefully conducted measures of labor market activity and uses an extremely large sample, it is still subject to significant sampling error and nonsampling errors.1 For example, when the BLS first reported that private nonfarm payroll gains were 148,000 in July 2019, the associated 90 percent confidence interval was +/- 100,000 due to sampling error alone.
An Alternative Measure of Payroll Employment
In principle, one could improve the reliability of CES numbers by increasing the sample size as the sampling variance declines in proportion with the sample size; indeed, Krueger and Fortson (2003) provide empirical evidence that as the sample size of the CES survey increased nearly fourfold between 1979 and 1995, the magnitude of sampling variability declined accordingly. However, increasing the sample size comes at substantial cost.2 As an alternative, complementary data from private payroll providers can lead to more accurate, timely, and detailed information on the labor market.
One such source of alternative labor market data is the payroll-processing company ADP, which covers 20 percent of the private workforce. These are the data that underlie ADP's monthly National Employment Report (NER), which forecasts BLS payroll employment changes by using a combination of ADP-derived data and other publicly available data. In our research, we explore the information content of the ADP microdata alone by producing an estimate of employment changes independent from the BLS payroll series as well as from other data sources.3
A potential concern when using the ADP data is that only the firms which hire ADP to manage their payrolls will appear in the data, and this may introduce sample selection issues.4 These selection issues are mitigated by reweighting the ADP data by establishment size and industry to match the characteristics of the universe of establishments along these dimensions. Reassuringly, our reweighted ADP-FRB employment series (the blue line shown in figure 1) is correlated with the CES series (the red line in figure 1), and also has a similar mean and variance.5
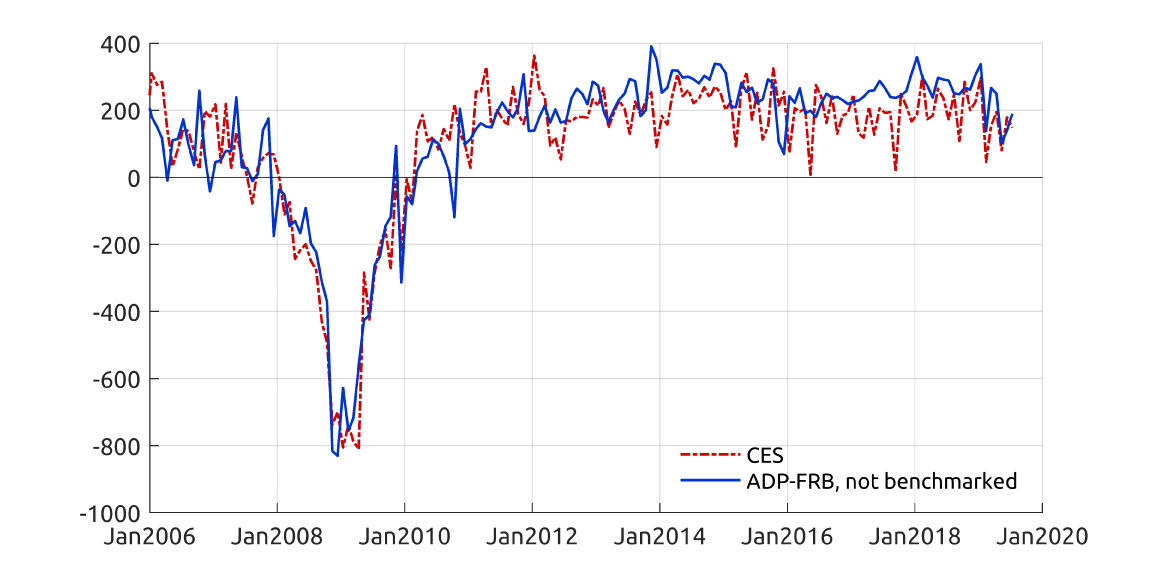
Source: U.S. Department of Labor, Bureau of Labor Statistics; ADP microdata; internal calculations.
Combining the Information Content of CES and ADP-FRB data
As shown in figure 1, CES and ADP-FRB monthly employment gains track each other over time but typically differ in any given month. This is to be expected as both employment gains estimates are sample based and thus subject to measurement error. A natural question is then whether we can create a more precise estimate of employment gains by pooling the information in CES and ADP-FRB payroll employment data. We proceed by combining the information in the two series using a statistical tool called the Kalman filter. The resultant measure of underlying employment gains is the black line in figure 2, plotted along with the model-based confidence interval. A similar exercise that excludes ADP-FRB data and only uses CES data yields a confidence interval that is about 20 percent wider. Notably, the Kalman filter independently places roughly equal weight on the CES series and the ADP-FRB series, consistent with the fact that CES and ADP-FRB data cover roughly equal-sized samples from the establishment population.6 Finally, in our work we find that the estimated underlying employment gains contain information about future readings of payroll employment.
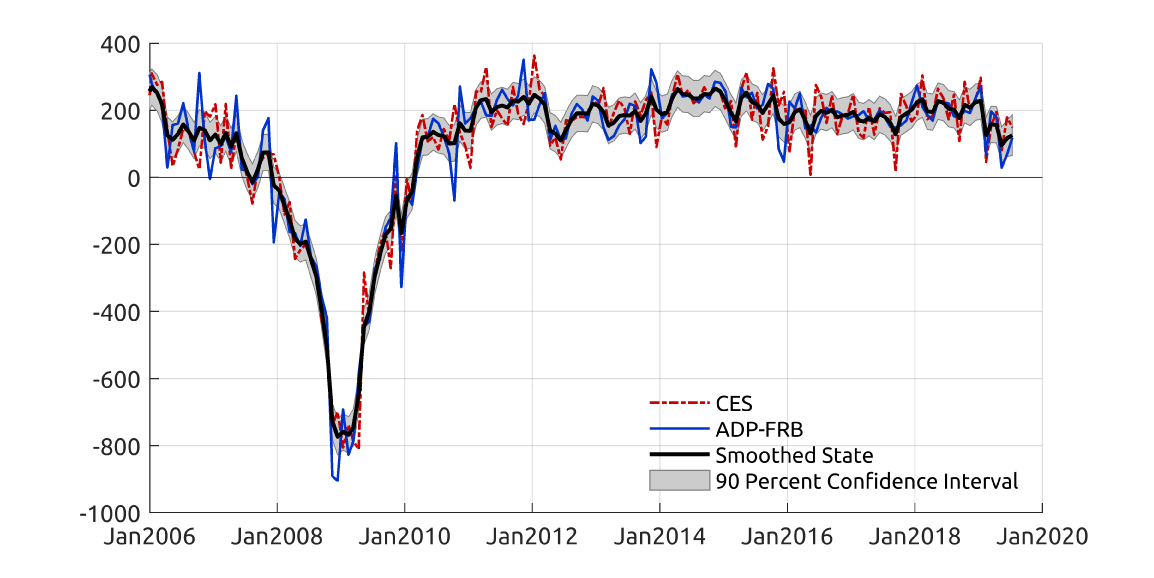
Source: U.S. Department of Labor, Bureau of Labor Statistics; ADP microdata; internal calculations.
Summary
We argue that combining information in CES and ADP-FRB data reduces the measurement error inherent in both data sources. In particular, we infer underlying employment gains by using a Kalman filter model and find that the optimal predictor of the underlying gains puts approximately equal weight on the CES and the ADP-FRB series.
References
Cajner, Tomaz, Leland D. Crane, Ryan A. Decker, Adrian Hamins-Puertolas, and Christopher Kurz (2019): "Improving the Accuracy of Economic Measurement with Multiple Data Sources: The Case of Payroll Employment Data," NBER WP 26033.
Krueger, Alan B., and Kenneth N. Fortson (2003): "Do Markets Respond More to More Reliable Labor Market Data? A Test of Market Rationality," Journal of the European Economic Association, 1(4): 931–957.
1. Sampling error arises because the estimate of payroll employment is based on responses from a sample of employers, not a census. Nonsampling error arises because of issues such as respondent errors, errors in data processing, and bias due to nonresponse. Return to text
2. For example, the BLS estimates that increasing the CES sample size by 85,000 businesses would require an additional annual cost of $16 million. See https://www.bls.gov/sae/additional-resources/bls-report-to-congress-on-ces-methodology-for-metropolitan-statistical-areas-2015.pdf. Return to text
3. See Cajner, Crane, Decker, Hamins-Puertolas, and Kurz (2019). In that paper, we find that the ADP-FRB series outperformed CES for predicting final annual employment gains (as reflected in the CES benchmark revision) in four of the ten years from 2008 to 2017, with particular advantages for tracking the employment decline associated with the Great Recession. Moreover, the ADP-FRB series reduced forecast errors for monthly CES employment gains, even after accounting for market expectations. Return to text
4. When accessing the microdata, we follow a number of procedures to ensure confidentiality. Business names are not present in the data we access. Return to text
5. Our final ADP-FRB series is annually benchmarked to QCEW data, after the latter become available, by applying a benchmark procedure analogous to the one used by the CES. Figure 1 plots the ADP-FRB series before benchmarking to show that the similarity between CES and ADP-FRB employment gains is not due to benchmarking. Return to text
6. For comparison, the same exercise with the CES payroll employment series and the employment series from the CPS household survey (adjusted to match the scope of the payroll series) puts a weight of well over 90 percent on the CES payroll series. Return to text
Cajner, Tomaz, Leland D. Crane, Ryan A. Decker, Adrian Hamins-Puertolas, and Christopher Kurz (2019). "Tracking the Labor Market with "Big Data"," FEDS Notes. Washington: Board of Governors of the Federal Reserve System, September 20, 2019, https://doi.org/10.17016/2380-7172.2441.
Disclaimer: FEDS Notes are articles in which Board staff offer their own views and present analysis on a range of topics in economics and finance. These articles are shorter and less technically oriented than FEDS Working Papers and IFDP papers.