FEDS Notes
October 18, 2023
U.S. Families' Experiences of the COVID-19 Pandemic: Evidence from the Survey of Consumer Finances
Jesse Bricker, Sarena Goodman, Kevin Moore, Sarah Reber, Alice Henriques Volz, and Richard Windle with assistance from YeJin Ahn1
Between 2019 and 2022, the COVID-19 pandemic caused severe disruptions to the U.S. labor market and broader economic activity, leading to unprecedented levels of fiscal support. Nonetheless, over this period, net changes in major economic indicators were consistent with a robust economy, and according to the 2022 Survey of Consumer Finances (SCF), U.S. families experienced broad-based improvements in their finances, particularly with respect to net worth (Aladangady et al., 2023).2
The SCF is a detailed triennial survey of U.S. family finances that, on its own, is not particularly well-suited to capture between-survey dynamics at the unprecedented scale of the pandemic. In anticipation of a need to better understand these dynamics, the 2022 SCF added questions to capture families' pandemic experiences ("COVID-19 questions").3 These questions included a longer lookback period than is typical for the SCF—asking families to consider their experiences since "the onset of the pandemic in early 2020"—and probed families' health and employment status, relief on required payments, experiences of financial hardship, receipt of early stimulus benefits, and child-related responsibilities.
This FEDS Note summarizes high-level findings from the COVID-19 questions, showcasing differences in families' experiences of the first years of the pandemic across income and education groups and connecting these differences to income and net worth measured in the SCF. In particular, lower-income families and families with lower levels of educational attainment were more likely to experience a reduction in work, which could reflect their lower incidence of telework and higher incidence of a severe COVID-19 infection. These differential employment experiences appear to map well to between-survey income growth across the income distribution, especially after accounting for unemployment benefits, which were temporarily expanded over this period. In contrast, growth in net worth exhibited an inverse-U shape over the income distribution and, for most groups, exceeded income growth, largely reflecting asset price appreciation. On net, mean net worth among families that experienced pandemic-related setbacks was reduced relative to other families, particularly at the bottom of the income distribution, but still generally at levels that could cushion against future shocks.
I. Families' Experiences of the COVID-19 Pandemic
In the earliest stages of the pandemic, the economy came to a grinding halt, upending the U.S. labor market. For example, early lockdowns led many businesses to close or scale back operations, and the unemployment rate spiked. Still, demand for certain types of workers, such as those in essential industries, increased. On the supply side, heightened health concerns or new household demands may have weighed on families' ability to (or interest in) work.4 Altogether, the pandemic had potential to positively or negatively affect a family's overall employment situation. The first set of COVID-19 questions asked the survey respondent to describe their employment status and, if applicable, that of their spouse or partner during the pandemic, using any number of 10 possible responses for each individual. Table 1 condenses these responses into mutually exclusive categories to characterize a family's overall experience—a reduction in work, an increase in work, or no change in work—and reveals that the majority of families reported no change in their work status.5 Unsurprisingly, the next-most frequent experience—reported by one-third of families—is a reduction in work, with the remaining less than 10 percent of families reporting an increase in work. As with other indicators explored in this FEDS Note, the incidence of these employment experiences exhibits a gradient in economic well-being, measured by the family's income in a typical year (that is, their "usual income"), as well as the educational attainment of the SCF reference person.6 Specifically, lower-income and less-educated families were more likely to have experienced a reduction in work, while higher-income and more-educated families were more likely to have experienced both no change in work status and an increase in work.
Table 1: Families' Pandemic Experiences, by Family Characteristics
| All | Percentile of usual income | Education of SCF reference person | |||||||||
|---|---|---|---|---|---|---|---|---|---|---|---|
| Less than 20 | 20-39.9 | 40-59.9 | 60-79.9 | 80-89.9 | 90-100 | No high school diploma | High school diploma | Some college | College degree | ||
| Percent of families in group | |||||||||||
| Employment Experience | |||||||||||
| Work reduction | 29% | 30% | 35% | 30% | 26% | 24% | 19% | 35% | 34% | 30% | 23% |
| Work increase | 6% | 6% | 5% | 6% | 9% | 7% | 7% | 3% | 5% | 6% | 8% |
| No change | 65% | 64% | 60% | 64% | 65% | 69% | 74% | 61% | 61% | 64% | 69% |
| Telework | |||||||||||
| New Telework | 19% | 2% | 9% | 16% | 30% | 34% | 42% | 2% | 7% | 15% | 33% |
| Any Telework | 29% | 3% | 13% | 23% | 46% | 53% | 68% | 5% | 12% | 22% | 51% |
| Health Experience | |||||||||||
| Hospitalization | 4% | 5% | 5% | 4% | 3% | 5% | 2% | 8% | 4% | 5% | 2% |
| Persistent symptoms | 17% | 19% | 20% | 19% | 16% | 14% | 11% | 24% | 20% | 19% | 14% |
| Stimulus | |||||||||||
| Unemployment benefits | 16% | 11% | 20% | 20% | 17% | 16% | 9% | 10% | 20% | 18% | 14% |
| Direct stimulus payment | 78% | 80% | 89% | 85% | 85% | 75% | 30% | 82% | 87% | 82% | 70% |
| Paycheck Protection Program (PPP) loan | 4% | 2% | 2% | 1% | 4% | 7% | 13% | 3% | 2% | 2% | 6% |
| 2019–22 percent growth for group | |||||||||||
| Real mean income | 15% | 8% | 5% | 5% | 9% | 14% | 22% | -8% | 0% | -6% | 18% |
| Real mean income (excl. unemployment benefits) | 14% | 7% | 3% | 4% | 8% | 13% | 22% | -9% | -1% | -7% | 18% |
| Real mean net worth | 23% | -2% | 39% | 51% | 30% | 28% | 18% | 10% | 17% | 24% | 14% |
Note: COVID-19 question categories defined over the Survey of Consumer Finances (SCF) respondent (and their spouse or partner, if applicable). Employment experience classifications use the first response to the employment status question from each person. "No change" in employment refers to either no change or the small percentage of families (less than 2 percent of families in each grouping we consider) that reported both a reduction and increase across spouses or partners. Hospitalization and persistent symptoms are not mutually exclusive categories. Telework leverages the full menu of possible responses to employment status (as opposed to just the first response). Income is measured for the calendar year before the survey.
Source: Here and in subsequent figures, Board of Governors of the Federal Reserve System. Division of Research and Statistics, Microeconomic Surveys (2023). “Survey of Consumer Finances,” https://doi.org/10.17016/datasets.001.
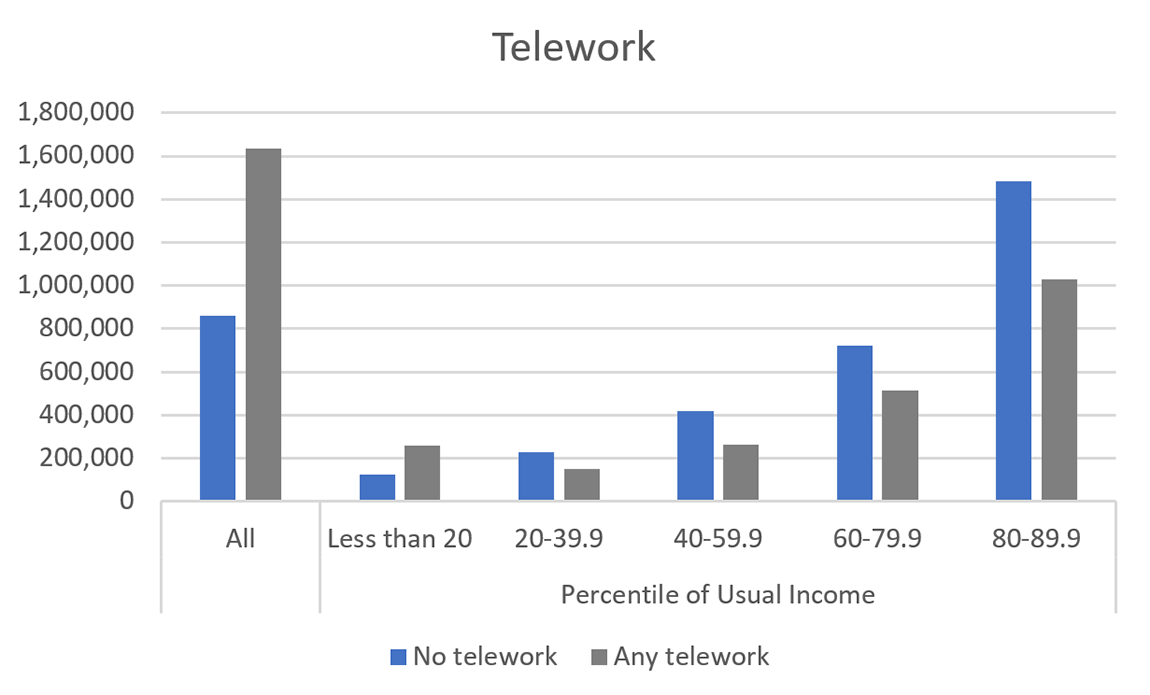
Some employers responded to the pandemic lockdowns by shifting workers to telework, enabling continuity of operations while minimizing the spread of COVID-19.7 Correspondingly, teleworking families generally faced reduced risks of infection and job loss, insulating them from potential reductions in work stemming from these factors.8 Two of the possible responses to the COVID-19 employment questions pertained specifically to telework: respondents could select that they (or their spouse or partner) moved to a new telework schedule or that they continued to telework. Nearly one-third of families reported telework, with two-thirds of these families reporting a new telework schedule.9 Income gradients for telework are quite strong, with 3 percent of the bottom quintile of the usual income distribution teleworking, compared with 68 percent of the top decile. Over 50 percent of families with a college degree teleworked versus 5 percent of families without a high school degree. Notably, while these telework gradients appear to have already existed before the pandemic, they were amplified considerably after its onset, as the incidence of families that reported a new telework schedule also rises with both income and education.10
Underlying the chaos in the labor market was the new serious health risk posed by the emergence of COVID-19, whereby a severe infection, among a number of other concerns, could have directly affected a family's employment status. To identify whether a family experienced a severe health infection, the COVID-19 questions probed whether the respondent or their spouse or partner was hospitalized due to COVID-19, which speaks to an acute (potentially shorter-term) shock, or experienced persistent symptoms from a COVID-19 infection, which speaks to a longer-term shock.11 Across all families, 4 percent reported a hospitalization while over 17 percent reported persistent symptoms. The strong gradient in economic well-being is again present, with lower-income and less-educated families more likely to experience each type of health shock. For example, 2 percent of families in the top decile of the usual income distribution were hospitalized and 11 percent had persistent symptoms, while 5 percent of families in the bottom quintile were hospitalized and 19 percent had persistent symptoms. The differences are even more stark by educational attainment, with 2 percent of families that had a college degree having been hospitalized (versus 8 percent of families without a high school degree) and 14 percent of such college-educated families experiencing persistent symptoms (versus 24 percent of families without a high school degree).
The incidence of a severe COVID-19 infection moves in the opposite direction of the incidence of telework, as one might expect. More generally, it parallels the incidence of negative employment changes, suggestive of a causal link between a severe COVID-19 infection and labor supply (Goda and Soltas, 2023). In its core survey, the SCF asks respondents to rate their health status and, if applicable, that of their spouse or partner.12 Within all usual income and education groups, these health ratings are lower for families that experienced a severe COVID-19 infection (not shown), indicative of a prolonged effect on a family's activities, including work.13 Indeed, families that reported a fair or poor health status that appeared to be connected to a severe COVID-19 infection were more likely to indicate a negative change in their employment status over the pandemic than other families that reported a fair or poor health status (also not shown).
As a potential buffer against the economic and health disruptions brought about by the pandemic, the federal government provided multiple rounds of stimulus, the earliest of which included direct payments, a temporarily expanded and more generous unemployment insurance (UI) program, and the Paycheck Protection Program (PPP), which allowed business owners to apply for funds to maintain their workforce.14 The COVID-19 questions probed whether families received money from each of these three programs. Around 16 percent of families reported receipt of unemployment benefits, with modestly higher incidence in the middle of the distribution than in the tails.15 Unsurprisingly, about 80 percent of families reported receiving stimulus payments, with incidence relatively stable across the income distribution but dropping off precipitously toward the top. In contrast to the distribution of the other two programs, PPP loans were more concentrated at the top, reflecting patterns in business ownership (Aladangady et al., 2023).
II. Implications for Income and Net Worth
All of these considerations are useful context for changes in income and wealth between the 2019 and 2022 surveys. In particular, growth in mean income (measured for the calendar year before the survey, so 2018 and 2021, respectively, for the most recent two surveys) was generally either absent or more modest among lower-income and less-educated families and very strong at the top, resembling the distribution of pandemic experiences over income and education.16 These differences are even more pronounced when excluding unemployment benefits, which, in their exceptional generosity over this period, buoyed income growth among lower income families.17 At the extreme is families in the second usual income quintile, among whom unemployment benefits added over 2 percentage points to mean income growth, explaining nearly half of it.
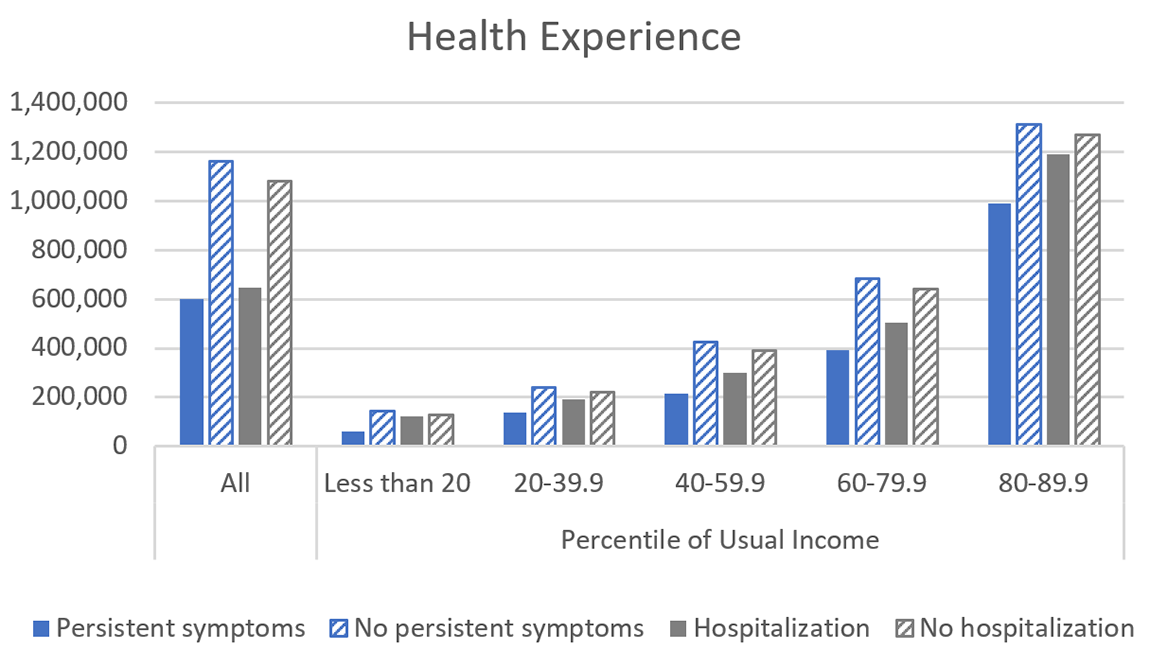
Indeed, mean income was lower for families that reduced their employment, non-teleworking families, and families that experienced either type of severe COVID-19 infection (figure 1, left bars).18 That said, as table 1 shows, families in these groups were more concentrated in the bottom segments of the usual income distribution, warranting a more granular analysis. Within each income group, mean income remained lower for families whose employment decreased relative to families in the baseline employment group—those whose employment did not change—as well as families whose employment increased and for non-teleworking families relative to teleworking families, but the differences were much more modest than the overall figures (figure 1, right bars).19 Mean income was also generally, but not always, lower for families that experienced a severe COVID-19 infection, which could suggest health shocks transmitted to income primarily through the employment channel.20
2022 dollars
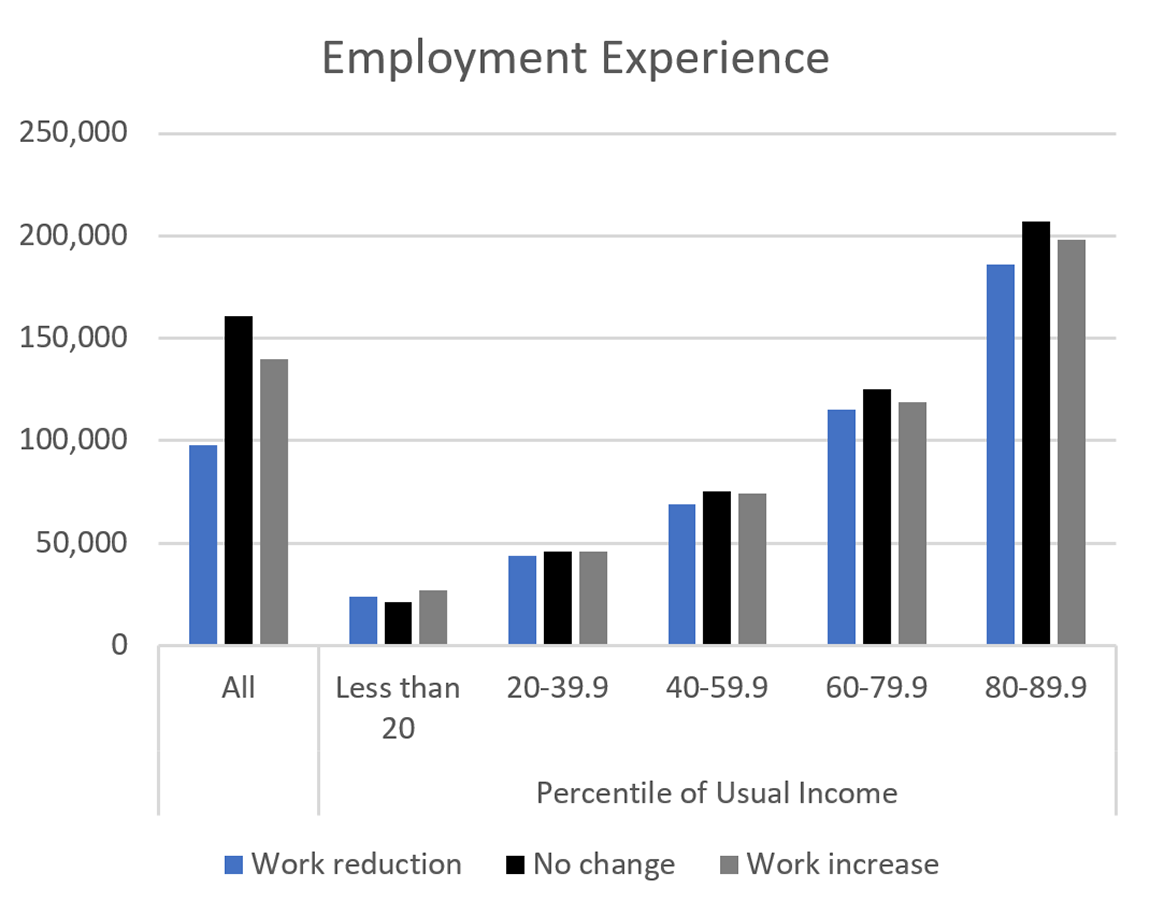
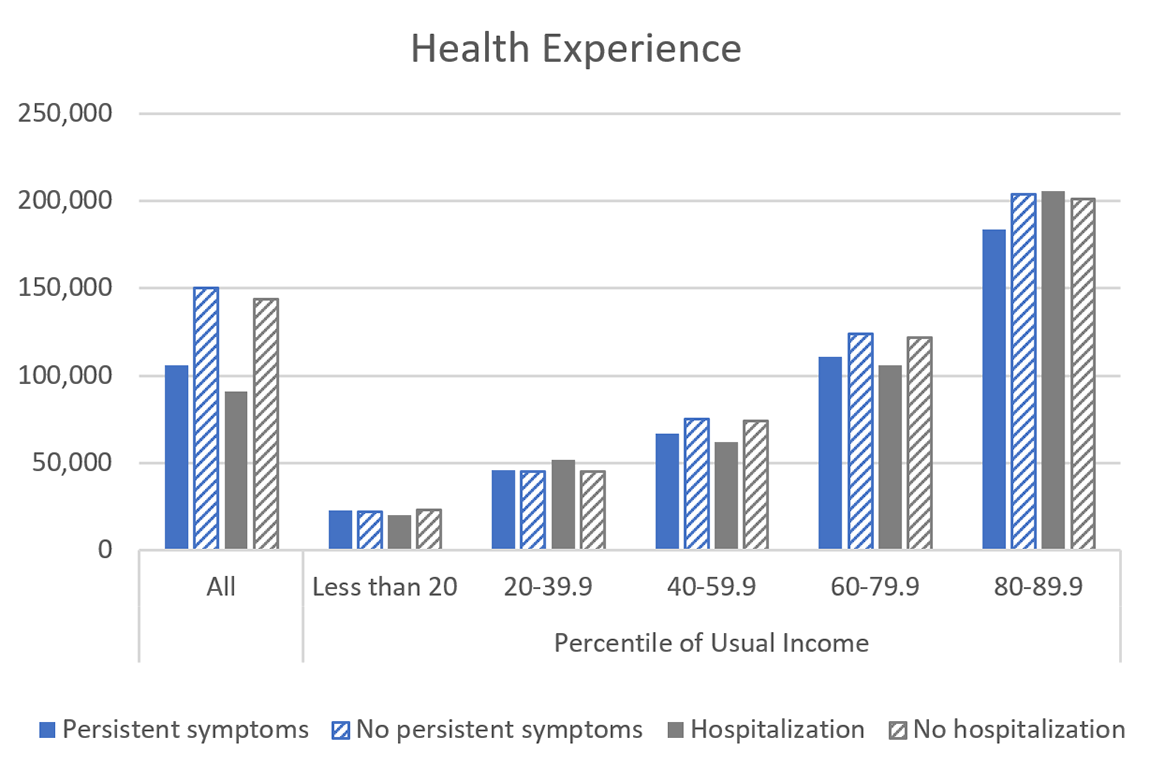
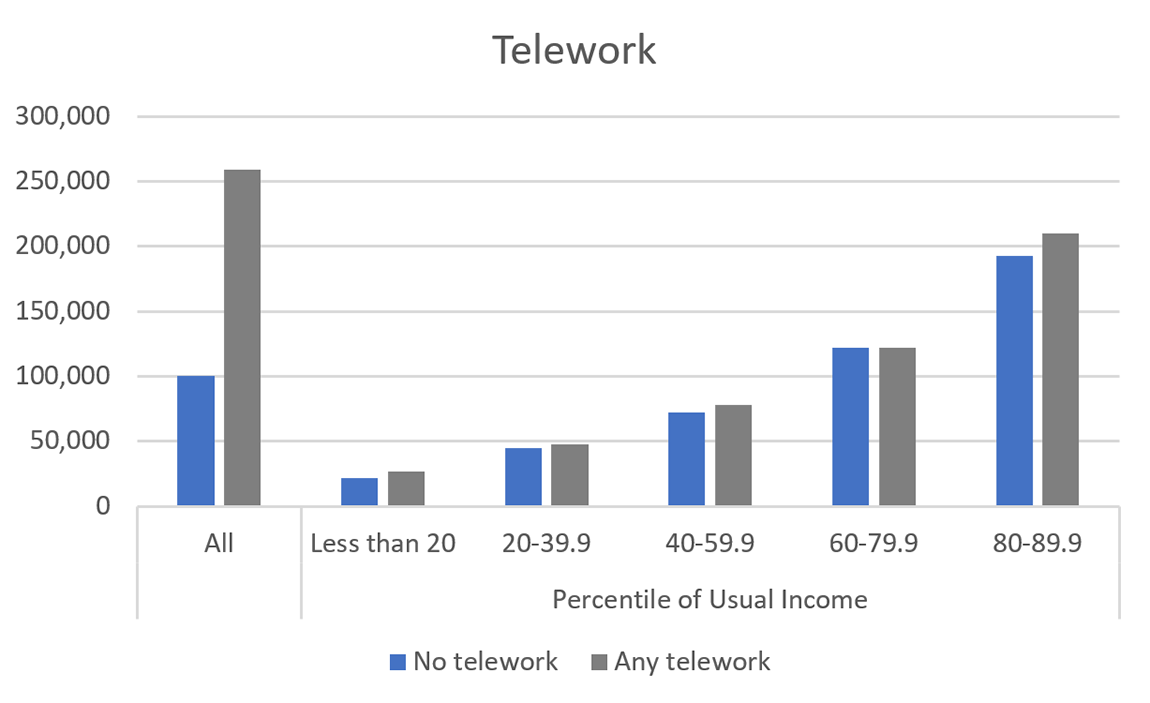
Note: The key in each panel identifies series in order from left to right. All families are included in the "all" category, but for illustrative purposes, the figures do not separately present the top decile. COVID-19 question categories are defined for the Survey of Consumer Finances (SCF) respondent (and their spouse or partner, if applicable). Employment experience classifications use the first response to the employment status question from each person. "No change" in employment refers to either no change or the small percentage of families (less than 2 percent of families in each grouping we consider) that reported both a reduction and increase across spouses or partners. Hospitalization and persistent symptoms are not mutually exclusive categories. Telework leverages the full menu of possible responses to employment status (as opposed to just the first response). Income is measured for the calendar year before the survey.
Compared with growth in mean income, growth in mean net worth (measured at the time of the survey) over the income distribution follows more of an inverse-U shape and, in most instances, far exceeded growth in income (table 1, bottom panel). These patterns primarily reflect sizable increases in house and equity prices between 2019 and 2022, assets that are generally not held by families in the bottom quintile of the income distribution and that are relatively less important to those in the top decile. Asset price appreciation, along with generous early stimulus measures, buffered families' balance sheets from the shocks that they differentially experienced and, for some groups, also helped strengthen them relative to 2019. While it is unclear whether the improvement in balance sheets between 2019 and 2022 will sustain, particularly given that families that were more likely to experience pandemic-related setbacks had weaker income growth, just over 90 percent of families that experienced a reduction in work over the pandemic were employed at the time of the 2022 SCF interview.21
Mean net worth, like mean income, was lower for families that reduced their employment, non-teleworking families, and families that experienced either type of severe COVID-19 infection (figure 2). Some of these relationships appear to be more heavily influenced by the distribution of employment changes and telework status across usual income groups: across income groups, families whose employment decreased and non-teleworking families often had higher net worth, on average, than those that increased their employment and those that teleworked.22 That said, as in the overall figures, mean net worth among families whose employment decreased, by income group, was consistently below that of families in the baseline employment group. Notably, the difference between these two groups is largest in the bottom quintile, where families whose employment decreased had just over one-half the mean net worth of families whose employment did not change. In all other income groups, families whose employment decreased had about two-thirds or more of the mean net worth of families whose employment did not change. With respect to health status, across all income groups, families that experienced a severe infection, on average, had lower net worth than families that did not, with larger differences throughout the distribution for the measure based on persistent symptoms than for the one based on hospitalization.23 On balance, the evidence appears to suggest that families that experienced pandemic-related shocks had, on average, less financial cushion in 2022 than their peers (potentially due to drawing down their reserves over the pandemic) but that even for these families, a fair amount of cushion was available.
2022 dollars
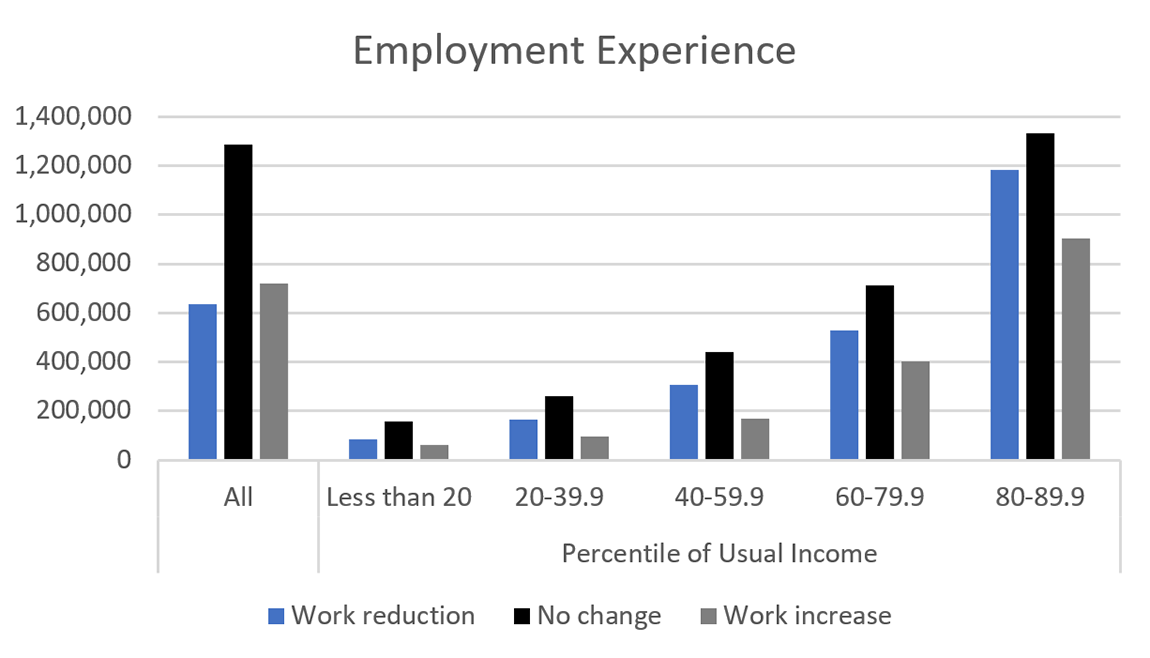
Note: The key in each panel identifies series in order from left to right. All families are included in the "all" category, but for illustrative purposes, the figures do not separately present the top decile. COVID-19 question categories are defined for the Survey of Consumer Finances (SCF) respondent (and their spouse or partner, if applicable). Employment experience classifications use the first response to the employment status question from each person. "No change" in employment refers to either no change or the small percentage of families (less than 2 percent of families in each grouping we consider) that reported both a reduction and increase across spouses or partners. Hospitalization and persistent symptoms are not mutually exclusive categories. Telework leverages the full menu of possible responses to employment status (as opposed to just the first response).
III. Concluding Remarks
This analysis presents a first look at findings on families' employment, health, and finances from the 2022 SCF COVID-19 questions. While no major income or education group was fully spared—a reflection of the widespread havoc that the pandemic unleashed on the U.S. economy—each dimension analyzed reveals a clear distributional pattern, indicating that lower-income and less-educated families bore the brunt of the corresponding disruptions. Nonetheless, the evidence is, on balance, mostly reassuring with respect to key measures of families' economic well-being from the core SCF, even for those that disproportionately experienced pandemic-related setbacks. That said, while, as of 2022, such families generally appeared to have had a fair amount of financial cushion to weather future setbacks, they had notably less than other families, particularly at the bottom of the income distribution, warranting further study. There are also many other unexplored avenues for future research within the SCF, including compositional questions concerning differential experiences by age, race, and ethnicity, as well as an analysis of the other COVID-19 questions that were not considered in this note (for example, areas of hardship, child-related responsibilities).24
Work Cited
Aladangady, Aditya, Jesse Bricker, Andrew C. Chang, Sarena Goodman, Jacob Krimmel, Kevin B. Moore, Sarah Reber, Alice Henriques Volz, and Richard A. Windle (2023). "Changes in U.S. Family Finances from 2019 to 2022: Evidence from the Survey of Consumer Finances," Washington: Board of Governors of the Federal Reserve System, October, https://doi.org/10.17016/8799
Aladangady, Aditya, Andrew C. Chang, and Jacob Krimmel (2023). "Greater Wealth, Greater Uncertainty: Changes in Racial Inequality in the Survey of Consumer Finances," FEDS Notes. Washington: Board of Governors of the Federal Reserve System, October 18.
Barrero, Jose Maria, Nicholas Bloom, and Steven J. Davis (2021). "Why Working from Home Will Stick," NBER Working Paper Series 28731. Cambridge, Mass.: National Bureau of Economic Research, April, https://www.nber.org/papers/w28731.
Ganong, Peter, Pascal Noel, and Joseph Vavra (2020). "US Unemployment Insurance Replacement Rates During the Pandemic," Journal of Public Economics, vol. 191.
Goda, Gopi S., and Evan J. Soltas (2023). "The Impacts of Covid-19 Absences on Workers," Journal of Public Economics, vol. 222.
Helppie-McFall, Brooke, and Joanne W. Hsu (2021). "Financial Profiles of Workers Most Vulnerable to Coronavirus-related Earnings Loss in the Spring of 2020," Financial Planning Review, Volume 3, Issue 4.
Appendix: COVID-19 Questions added to the 2022 Survey of Consumer Finances
Survey respondents were asked the following questions after those gathering information on members of the family and before those on expectations for the economy:
The COVID-19 pandemic significantly affected American households. We would like to ask you the following questions about the experiences you (and your family living here) had after the onset of the pandemic in early 2020.
X19000/X19001/X19002/X19003/X19004/X19005/X19006/X19007/X19008/X19009
Which of the following describes your employment status during the pandemic?
CODE ALL THAT APPLY: CODE RESPONSES IN THE ORDER THEY ARE GIVEN.
1. Permanently lost a job or closed a business
2. Became temporarily unemployed or temporarily closed a business
3. Started a new job or established a new business
4. Began a new telework schedule
5. Continued teleworking
6. Continued reporting to a place of business
7. Continued to be unemployed or out of the labor force
8. Reduced hours
9. Increased hours
10. Entered retirement
-7. OTHER
X19010/X19011/X19012/X19013/X19014/X19015/X19016/X19017/X19018/X19019
Which of the following describes your (husband's/wife's/spouse's/partner's) employment status during the pandemic?
CODE ALL THAT APPLY: CODE RESPONSES IN THE ORDER THEY ARE GIVEN.
1. Permanently lost a job or closed a business
2. Became temporarily unemployed or temporarily closed a business
3. Started a new job or established a new business
4. Began a new telework schedule
5. Continued teleworking
6. Continued reporting to a place of business
7. Continued to be unemployed or out of the labor force
8. Reduced hours
9. Increased hours
10. Entered retirement
-7. OTHER
0. Inap. (No spouse/partner)
X19020/X19021/X19022/X19023/X19024/X19025/X19026
During the pandemic, some households had difficulty paying their bills. Did you (or your husband/wife/spouse/partner) renegotiate payments for, or otherwise receive forbearance or relief on, any of the following loans or accounts?
CODE ALL THAT APPLY: CODE RESPONSES IN THE ORDER THEY ARE GIVEN.
1. Mortgage
2. Rent
3. Auto loans
4. Credit cards
5. Student loans
6. Other loans
7. Utilities
-1. None of these
IF ANY OF X19020-X19026=1 THEN ASK X19027:
X19027. For how many months did you (or your husband/wife/spouse/partner) receive mortgage forbearance?
NUMBER OF MONTHS:
-2. Renegotiated payments
0. Inap (X19020-X19026^=1)
IF ANY OF X19020-X19026=2 THEN ASK X19028:
X19028. For how many months did you (or your husband/wife/spouse/partner) receive rent relief?
NUMBER OF MONTHS:
-2. Renegotiated payments
0. Inap (X19020-X19026^=2)
X19029/X19030/X19031
Did you (or your husband/wife/spouse/partner) receive any of the following during the pandemic?
CODE ALL THAT APPLY: CODE RESPONSES IN THE ORDER THEY ARE GIVEN.
1. Unemployment insurance or UI benefits
2. Stimulus payment(s) from the government
3. Paycheck Protection Program or PPP loan(s)
-1. None of these
IF ANY OF X19029-X19031=1 THEN ASK X19032:
X19032. For how many total months did you (and your husband/wife/spouse/partner) receive unemployment insurance (UI) benefits? (Include period that benefits were delayed if eventually paid).
IF BOTH R AND SPOUSE RECEVIED UI BENEFITS: TAKE THE TOTAL NUMBER OF MONTHS FOR EACH INDIVIDUALLY AND ADD THEM TOGETHER.
NUMBER OF MONTHS:
0. Inap (X19029-X19031^=1)
X19033/X19034/X19035/X19036/X19037/X19038/ X19039
Did you (or your husband/wife/spouse/partner) experience any of the following challenges during the pandemic?
CODE ALL THAT APPLY: CODE RESPONSES IN THE ORDER THEY ARE GIVEN.
1. Missed a regular payment on rent or mortgage
2. Missed a regular payment on a credit card, auto loan, or other debt
3. Missed a regular payment on utilities
4. Delayed a payment on, or were unable to pay, a medical bill
5. Struggled to afford food 6. Had trouble buying food even though you had money
-1. No hardship
-7. Other hardship (specify)
IF NUMBER OF CHILDREN > 0 THEN ASK X19040- X19045:
The pandemic disrupted childcare and added virtual instruction responsibilities for many households that may have made working difficult.
X19040. What was the most significant impact of increased child-related responsibilities on your employment: did you stop working, work fewer hours, work the same numbers of hours, but were less focused, change jobs, or no disruption?
1. Stopped working
2. Worked fewer hours
3. Worked the same amount but was less focused
4. Changed jobs
5. No disruption
0. Inap. (No children in home)
X19041. What was the most significant impact of increased child-related responsibilities on your (husband's/wife's/spouse's/partner's) employment: did your (husband/wife/spouse/partner) stop working, work fewer hours, work the same numbers of hours, but was less focused, change jobs, or no disruption?
1. Stopped working
2. Worked fewer hours
3. Worked the same amount but was less focused
4. Changed jobs
5. No disruption
0. Inap. (No spouse/partner; No children in home)
X19042 X19043/X19044/X19045
Did you do any of the following in response to childcare or schooling disruptions during the pandemic?
CODE ALL THAT APPLY: CODE RESPONSES IN THE ORDER THEY ARE GIVEN.
1. Move to be closer to family or friends for help
2. Have family members move to you so they could help
3. Enroll in a school that had in-person classes
4. Hire or share a nanny or educator
-1. None of these
0. Inap. (No children in home)
X19046 Have you (or your husband/wife/spouse/partner) ever been diagnosed with COVID-19?
INCLUDE POSITIVE RESULTS FROM EITHER LAB OR SELF-ADMINISTERED TESTS
1. Yes
5. No
IF X19046=1 THEN ASK X19047 & X19048:
X19047. Were you (or your husband/wife/spouse/partner) ever hospitalized due to COVID-19?
1. Yes
5. No
0. Inap. (X19046=5)
X19048. Have you (or your husband/wife/spouse/partner) suffered any persistent symptoms due to your COVID-19 infection, such as shortness of breath or fatigue?
1. Yes
5. No
0. Inap. (X19046=5)
X19049 Did someone who was living with you during the pandemic die from COVID-19 or an illness that you suspect was COVID-19?
1. Yes
5. No
1. Division of Research and Statistics, Board of Governors of the Federal Reserve System. The analysis and conclusions set forth are those of the authors and do not necessarily reflect the views of the Board of Governors or the Federal Reserve staff. Return to text
2. Aladangady et al. (2023) is the Federal Reserve Board's official report that accompanies the 2022 release of its Survey of Consumer Finances (SCF). It focuses on the financial positions of U.S. families in 2022 relative to previous surveys and, for the most part, simply alludes to pandemic-related turbulence between the 2019 and 2022 surveys. Unless otherwise specified, this FEDS Note uses the net worth, income, and other definitions from that report, including adjusting all dollar values to 2022 dollars using the "current methods" version of the consumer price index for all urban consumers (CPI-U-RS). Return to text
3. These questions were drafted in 2021 to enable inclusion in the 2022 SCF, which was fielded between April 2022 and April 2023. Most interviews—around three-fourths—were conducted in 2022, with the remainder conducted in early 2023. See appendix for the SCF COVID-19 questions. Return to text
4. In addition, the temporarily expanded unemployment insurance program—which included a supplemental benefit that, in many instances, meant beneficiaries could receive more than 100 percent of their pre-pandemic wages (Ganong, Noel, and Vavra, 2020)—introduced an added disincentive to work for some period of time that may have led to a reduction in work. Return to text
5. This characterization is based on the first option that the respondent selected for themselves and, if applicable, their spouse or partner (although including the second option does not materially affect conclusions). Reduced hours, a job or business loss, and entry into retirement are classified as a "work reduction;" increased hours and a new job or business are classified as a "work increase;" and continuing to report (either in-person or via telework) and continuing to be unemployed or out of the labor force are classified as "no change." Less than 2 percent of families in any group reported changes in opposite directions between the respondent and their spouse or partner, and these families are included in the "no change" category. Return to text
6. In any given year, a family's income may deviate from their "usual income" because of a recent spell of unemployment, a bonus from an employer, a capital loss or gain on investments, or other transitory factors. Usual income is measured in the survey after income has been reported, if respondents indicate their income in the survey reference year was unusually high or low compared with what they would expect in a normal year. Return to text
7. Barrero, Bloom, and Davis (2021) estimate that nearly half of paid work hours shifted to remote status during 2020 after the onset of the pandemic. Return to text
8. Further, the expansion of telework, which grants more flexibility than in-office work, could have led to work increases. Return to text
9. This characterization is based on any report of telework or new telework, respectively, between the respondent and spouse or partner, whether or not it was the first option selected in response to the employment question(s). Return to text
10. This finding is in line with predictions based on the 2019 SCF (Helppie-McFall and Hsu, 2021). Return to text
11. Interestingly, 62 percent of families that reported a hospitalization due to COVID-19 also reported persistent symptoms, whereas 14 percent of families that reported persistent symptoms also reported a hospitalization. Return to text
12. The health status question offers four ratings—excellent, good, fair, and poor—and for these calculations, if the respondent and their spouse or partner differed, the family is categorized as the worse of the two. Return to text
13. For example, over 50 percent of families that experienced a hospitalization due to COVID-19 reported their health status as fair or poor, versus around 30 percent of families that did not. In each of the bottom two quintiles of usual income, nearly two-thirds of families that experienced a hospitalization reported their health status as fair or poor, versus less than half of families that did not. Return to text
14. Payment relief programs offered an additional buffer to these disruptions. Ten percent of families reported receiving relief on housing—that is, mortgage or rent—payments, and 13 percent of families reported receiving relief on auto or other installment loan, credit card, or utility payments, with 17 percent of families overall receiving some form of payment relief. (Student loans, most of which were automatically placed in forbearance, are excluded from this calculation.) More families in the bottom segments of the distribution received relief of each type. Return to text
15. This pattern departs from the one observed for work reduction among families along two dimensions. First, the UI incidence is expectedly more muted throughout, even as eligibility expanded. Second, families in the bottom quintile of the income distribution and families without a high school degree had much lower UI rates than work reductions, perhaps reflecting a higher incidence of irregular or informal employment within these groups. Return to text
16. The SCF income measure reflects a family's before-tax income for the full calendar year preceding the survey. This measure aggregates reported income from specific sources—most of which correspond to items on an income tax form—including wages, self-employment and business income, taxable and tax-exempt interest, dividends, realized capital gains, unemployment insurance, food stamps and other related support programs provided by the government, pensions and withdrawals from retirement accounts, Social Security, alimony and other support payments, and miscellaneous sources. In the 2022 SCF, some of these sources capture pandemic-related fiscal support that families received in 2021, including, for example, enhanced unemployment and food stamp benefits. That said, as the SCF did not systematically collect information on stimulus payments that families received from the government when probing 2021 income, such payments are excluded from the SCF income measure. Return to text
17. Wage income explains at least half of mean income growth within each of the higher-income groups. Other income sources that are less accessible to lower-income groups, such as realized capital gains, also helped drive up their income. Return to text
18. Figures 1 and 2 include all families in the "all" category but, for illustrative purposes, do not separately present the top decile. For this group, mean income (net worth) by employment experience was $479,000 ($4,756,000), $562,000 ($4,189,000), and $759,000 ($7,347,000) for work reduction, work increase, and no change, respectively; mean income (net worth) by health experience was $599,000 ($5,407,000), $704,000 ($6,787,000), $444,000 ($6,204,000), and $696,000 ($6,637,000) for persistent symptoms, no persistent symptoms, hospitalization, and no hospitalization, respectively; and mean income (net worth) by telework was $625,000 ($8,227,000) and $739,000 ($5,501,000) for no telework and any telework, respectively. Return to text
19. Among families in the bottom quintile, mean income for families whose employment did not change was lower than mean income for families whose employment decreased, reflecting the relatively large share of families in that segment that reported they remained out of the labor force during the pandemic. Return to text
20. For example, families in the second usual income quintile that experienced a severe COVID-19 infection of either type earned more, on average, than families in the same quintile that did not. This relationship persists when removing unemployment benefits. Return to text
21. The share of families that experienced a reduction in work but were employed at the time of their interview was still a handful of percentage points below the employment share of families that experienced a positive employment change, partially reflecting the inclusion of families that entered retirement in the "work reduction" category. Two-thirds of families that experienced a hospitalization were employed at the time of the interview (versus 75 percent that did not), and 80 percent of families that had persistent symptoms were employed at the time of the interview (versus 73 percent of families that did not). These figures are derived from questions in the core SCF regarding the respondent's (and their spouse or partner's) employment status. Return to text
22. While this pattern could imply that, as of 2022, families that saw reductions in work or families that were less insulated from shocks had more financial cushion to weather future setbacks than families in these other groups, the higher level of net worth primarily reflects increased housing and business wealth, illiquid assets that may be less suited to help smooth families' consumption through such setbacks. Return to text
23. For the measure based on persistent symptoms, the difference is again largest in the bottom quintile, but for the hospitalization measure, the difference is largest in the middle quintile. The differences across the distribution for the measure based on persistent symptoms were generally slightly larger than those from the comparison between decreased employment and the baseline employment group. Return to text
24. In a companion piece, Aladangady, Chang, and Krimmel (2023) show that racial and ethnic gaps in net worth shrunk between the 2019 and 2022 surveys, though non-White families became increasingly financially uncertain, which could reflect differential pandemic-related experiences. Return to text
Bricker, Jesse, Sarena Goodman, Kevin Moore, Sarah Reber, Alice Henriques Volz, and Richard Windle (2023). "U.S. Families Experiences of the COVID-19 Pandemic: Evidence from the Survey of Consumer Finances," FEDS Notes. Washington: Board of Governors of the Federal Reserve System, October 18, 2023, https://doi.org/10.17016/2380-7172.3406.
Disclaimer: FEDS Notes are articles in which Board staff offer their own views and present analysis on a range of topics in economics and finance. These articles are shorter and less technically oriented than FEDS Working Papers and IFDP papers.