FEDS Notes
October 04, 2023
U.S. Interest Rates and Emerging Market Currencies: Taking Stock 10 Years After the Taper Tantrum
Nira Harikrishnan, Benjamin Silk, and Emre Yoldas1
In 2013, a shift in expectations of market participants for the timing of the tapering of the Federal Reserve's asset purchases, and its ramifications for normalization of U.S. monetary policy, led to sharp increases in longer-term U.S. Treasury yields and volatility in broader financial markets. The episode came to be known as the "taper tantrum" because the strong market reaction came in response to Federal Reserve communications that were largely consistent with market analysts' expectations.2 During the taper tantrum, increases in longer-term Treasury yields were also associated with a significant tightening of financial conditions in emerging market economies (EMEs) and a notable depreciation of EME currencies. The taper tantrum was one of many events in the post-Global Financial Crisis (GFC) era where EME currencies depreciated notably against the dollar, including last year when increases in U.S. interest rates gained pace amid increased inflationary pressures. In this note, we analyze episodes of large and sustained depreciations of EME currencies to understand the role of U.S. interest rates versus other broad factors. We also shed light on the role of search for yield and investor positioning during the taper tantrum. Our event study consists of seven of the largest EME currency depreciation episodes in the post-GFC era in addition to the taper tantrum. Figure 1 plots an equally weighted index of the value of the U.S. dollar against 18 floating EME currencies, with the episodes marked by gray shading.3
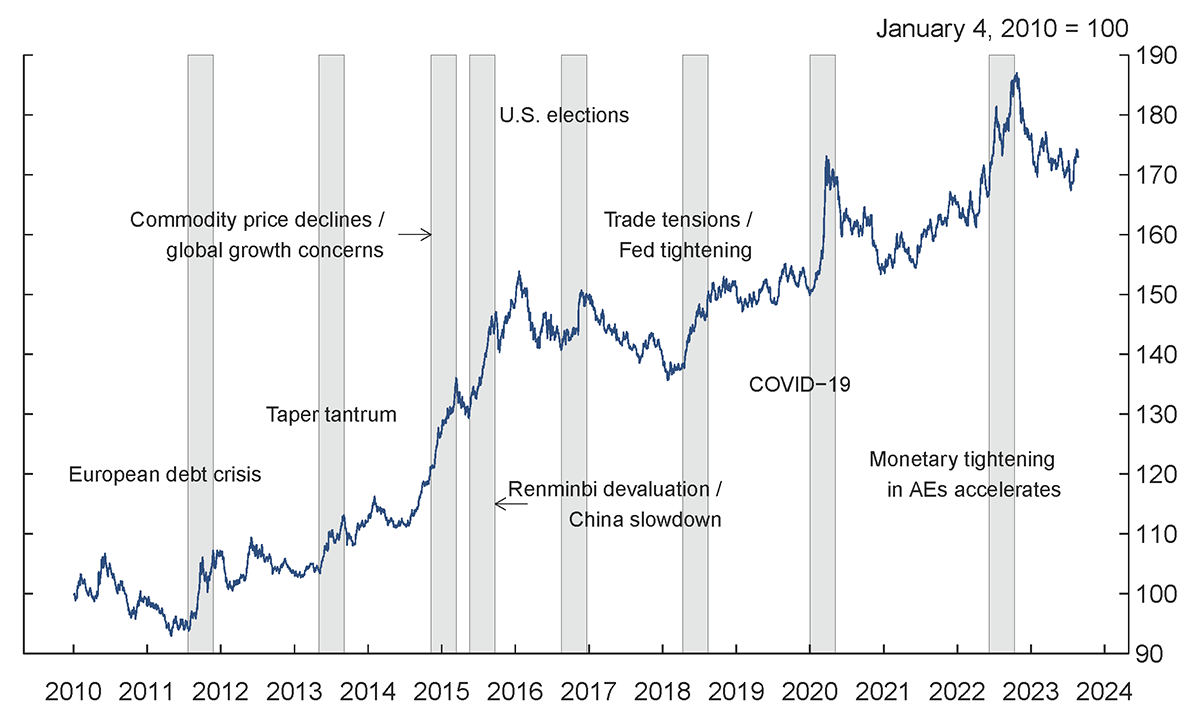
Note: An index of U.S. dollar against an equally weighted average of 18 floating EME currencies listed in the appendix (Jan. 4, 2010 to Aug. 25, 2023). Higher values indicate dollar strength. Shaded areas show episodes of large EME currency depreciations. All episodes have a length of four months.
In general, higher U.S. Treasury yields boost the exchange value of the dollar against EME currencies but changes in risk premiums and other factors can also play an important role. To analyze the role of risk premiums, we consider two broad types of shocks identified based on the comovement of the 10-year U.S. Treasury yield with the VIX index and a measure of U.S. high-yield corporate spreads. Monetary shocks lead to positive comovement; for example, higher interest rates driven by inflationary pressures or perceptions of a more aggressive Federal Reserve reaction function weigh on the growth outlook and reduce risk-taking in financial markets. In contrast, growth/risk shocks drive negative comovement; higher values of the VIX index/high-yield spread are associated with lower U.S. Treasury yields when negative growth/risk shocks drive financial markets as investors prefer safer assets and expect monetary easing in response to lower growth (or increased downside risks to growth), and vice versa. In the case of monetary shocks driving U.S. yields higher, both the interest-rate and risk premium channels work in the direction of EME currency weakness. In contrast, the two channels work in opposite directions in case of growth/risk shocks. For example, a negative growth shock could cause dollar appreciation against EME currencies even as U.S. yields fall because the premiums that investors require to hold risky assets generally rise, and this effect could more than offset the downward pressures on the dollar due to the lower U.S. yields. Similarly, if a positive growth/risk shock drives U.S. yields higher, the effects on EME currencies may be dampened by compressing risk premiums. In table 1, we summarize the types of shocks and their predicted effects on the dollar against EME currencies.
Table 1: Different Economic Shocks, U.S. Yields, and U.S. Dollar against EME Currencies
| Interest-rate channel | Risk channel | Total Effect | |
|---|---|---|---|
| Higher U.S. Yields driven by Monetary Shock | + | + | + |
| Lower U.S. Yields driven by Monetary Shock | - | - | - |
| Higher U.S. Yields driven by Growth/Risk Shock | + | - | ? |
| Lower U.S. Yields driven by Growth/Risk Shock | - | + | ? |
Table 2 lists the episodes and reports changes in the relevant variables. In addition to the aforementioned indicators, we also report changes in commodity prices and changes in the dollar against advanced economy (AE) currencies to gain further insights. First, we observe that negative growth/risk shocks were prevalent in four of the eight episodes: the European debt crisis of 2011, commodity price declines/global growth concerns during 2014-2015, the devaluation of the Chinese renminbi and slowdown in Chinese economy in 2015, and the COVID pandemic more recently. In all these events, the VIX index rose and high-yield spreads widened while the 10-year U.S. Treasury yield fell. The risk premium channel strongly dominated movements in EME currencies during these episodes as the dollar rose about 12 to 14 percent against the equally weighted EME currency index despite lower U.S. yields. These episodes were also associated with significant decreases in commodity prices, reflecting global growth concerns as well as dollar-denominated pricing of commodities.4 In general, lower commodity prices weigh on currencies of commodity exporters, a significant share of the EMEs we analyze, as expected export revenues and economic growth decline in these economies. Hence, in addition to the relative importance of risk premiums, the declines in commodity prices explain in part the larger depreciation of EME currencies than AE currencies during these events.
Table 2: Changes in Key Indicators during the EME Currency Depreciation Episodes
| Event | Dollar against EME Currencies | 10-year Treasury Yield | VIX Index | High-yield Spread | Commodity prices | Dollar against AE Currencies |
|---|---|---|---|---|---|---|
| European debt crisis (2011) | 13.8 | -100 | 17 | 249 | -14.2 | 9.5 |
| Taper tantrum (2013) | 8.8 | 137 | 2 | 16 | -1.4 | 3.8 |
| Commodity price declines / Global growth concerns (2014/15) | 12.5 | -29 | 3 | 41 | -16.5 | 11.4 |
| Renminbi devaluation / China slowdown (2015) | 12.2 | -10 | 9 | 157 | -15.3 | 5.9 |
| U.S. Elections (2016) | 6.7 | 98 | -1 | -98 | 0.5 | 7.9 |
| Trade tensions / Fed tightening (2018) | 9.1 | 8 | -6 | 3 | -7.9 | 7.9 |
| COVID-19 (2020) | 13 | -124 | 19 | 400 | -23.5 | 6 |
| Monetary tightening in AEs accelerates (2022) | 11.4 | 87 | 10 | 94 | -15.7 | 11.5 |
| Median | 11.8 | -0.8 | 6 | 68 | -14.8 | 7.9 |
Note: Dollar against EME currencies, commodity prices, and dollar against AE currencies are measured in percent. VIX index is measured in percentage points. 10-Year U.S. Treasury yield and U.S. High Yield Corporate Spreads are measured in basis points.
In contrast to these episodes, investor expectations for expansionary fiscal policy following the U.S. elections in 2016 drove the 10-year U.S. Treasury yield higher and VIX index/high-yield spreads lower, representing a positive growth/risk shock. Dollar appreciation in this episode is consistent with the interest-rate channel dominating. Interestingly, the average EME currency depreciated less than the average AE currency against the dollar, which is the opposite of what we observe for the previously discussed negative growth/risk events, once again highlighting the importance of the risk premium channel for EME currencies.
Only two episodes were dominated by monetary shocks: the taper tantrum and the period from early June to mid-October of last year when monetary tightening by the Federal Reserve and other major central banks accelerated amid signs of elevated and persistent inflationary pressures. The increases in the VIX index and high-yield spreads were modest during the taper tantrum, suggesting that the interest-rate channel was relatively strong while the risk-taking channel of monetary policy played a bigger role in the recent episode. Interestingly, the monetary shock had not induced a sizeable and broad-based depreciation in EME currencies in 2022 until tightening gained pace and commodity prices registered a decline comparable to those seen in events dominated by negative growth/risk shocks. The declines in commodity prices in part reflected increased investor concerns about the global growth outlook and reversed the appreciation of commodity-exporter EME currencies that occurred earlier in the year.5
Among the eight events we examine, the 2018 episode stands out in that changes in the VIX index and high yield spreads were modest and mixed while in the 10-year Treasury yield was little changed, suggesting an unusual type of shock affecting EME currencies. The trade policy developments between the United States and its trading partners likely played an important role during this episode of EME currency depreciation as the dollar also rose against AE currencies by about a similar magnitude.6
To develop a deeper understanding of the role of different drivers of EME exchange rates and distinct aspects of the taper tantrum, we next conduct a cross sectional analysis. We evaluate several potential drivers, all measured prior to the events under consideration so they can be considered as predetermined characteristics that can explain responses to different types of shocks. First, we consider exposures of EME currencies to common risk factors, including U.S. Treasury yields, by estimating the following time-series regressions for each episode:
$$$$ \Delta y_{it} = \alpha_i +\beta_{i1}\Delta VIX_t + \beta_{i2}\Delta HYS_t + \beta_{i3} \Delta UST_t + \epsilon_{it}, \text{for}\ i = 1 , \cdots , \text{N}, $$$$
where $$ N $$ denotes the number of currencies, $$ y_{i} $$ is the natural logarithm of the bilateral exchange rate measured as EME currency per dollar, HYS indicates high-yield corporate spreads, and UST indicates the 10-year U.S. Treasury yield. We use five years of weekly data prior to the onset of each episode to estimate these regressions for each currency. On average, all three betas are positive indicating that reduced risk appetite (reflected in increases in VIX and HYS) is associated with EME currency weakness and, after controlling for risk appetite, higher U.S. yields boost the dollar as we conjectured above. The cross-sectional analysis involves calculating the correlations between depreciation of EME currencies during the episode with the estimated betas, i.e. we calculate $$ Corr ( \Delta \tilde{y}_i , \hat{\beta}_{ij} ) $$ for $$j$$=1,2,3 and $$i$$, where $$ \Delta \tilde{y}_i $$ denotes the depreciation of the $$i$$th currency during the episode.
The federal funds rate had been near zero for almost five years prior to the taper tantrum while interest rates in EMEs remained relatively high. Indeed, a simple carry strategy of long positions in EME currencies against the dollar provided a cumulative return of about 28 percent from end of 2008 through April 2013.7 In addition, option-implied volatility of U.S. interest rates and EME exchange rates against the dollar were subdued by historical norms just before the onset of the taper tantrum.8 So it was an environment where an unexpected change in U.S. interest rates had significant potential to cause the unwinding of carry trades and rapid depreciation of EME currencies. To analyze the potential role of search for yield and investor positioning during the taper tantrum compared with other episodes, we consider two indicators. The first is a measure of the attractiveness of carry trades: ex ante carry return relative to volatility.9 The second measure is an indicator of investor positioning in EME currencies: excess foreign exchange holdings of institutional investors from State Street Corporation's custodial data. Though this indicator provides a partial view of the overall investor positioning, it has the advantage of being a direct measure.
Economic fundamentals in EMEs are also an important potential channel that can amplify shocks that affect asset prices broadly. To capture EME fundamentals, we use a vulnerability score based on several macroeconomic indicators: current account deficits, gross government debt, average inflation, change in bank credit relative to GDP, external debt, and foreign exchange reserves.10 Finally, as another potential source of vulnerability, we use deviation of the real effective exchange rate (REER) from its 10-year average as a simple valuation measure. We conjecture that a REER level above its longer-run average may be a symptom of excessive investor optimism and can lead to a sharp revaluation in the face of shocks.
The results of our empirical analysis are summarized in Table 3, where we report cross-sectional correlations between EME currency depreciation and potential drivers.11 On average, the VIX beta has the highest explanatory power, with an average correlation coefficient of 0.45, largely reflecting the strong correlations during episodes dominated by negative growth/risk shocks. Indeed, the correlations are 0.8 and 0.63 in the two largest depreciation events, the European det crisis of 2011 and the COVID pandemic. Interestingly, the Treasury-yield betas have high positive correlation with EME currency depreciation in the events where negative growth/risk shocks drove asset prices. The implication is that the risk channel overwhelms the interest-rate channel in such episodes and the Treasury-yield betas change dramatically. In addition, the Treasury-yield betas have no significant explanatory power in the two events where monetary shocks dominated. So it appears that this simple beta measure does not capture ex-ante exposure to the risk of higher U.S. interest rates.
Vulnerability score is positively correlated with depreciation in almost all the events that we analyze and has the second highest explanatory power after the VIX index. Given the important role of risk premiums we uncovered above, this association between macroeconomic vulnerability and depreciation suggests that perceived riskiness of EME currencies is strongly linked with economic fundamentals.12
Correlation of depreciation with deviation of REER from its long-run average changes sign across the events and is negative on average. Hence, investors typically demanded higher risk premiums in the face of large shocks to hold currencies of countries with depressed valuations. Only during the European debt crisis and taper tantrum REER deviation has a mild positive correlation with depreciation, suggesting that prior investor optimism may have amplified the moves during these events.
On average, the ex-ante carry return measure and the investor positioning indicator have no explanatory power with an important exception, the taper tantrum. It is the only event where the carry return and positioning have both significant positive correlation with depreciation. Indeed, the carry return measure has the highest explanatory power among all potential drivers we examine for the taper tantrum. These results are consistent with our conjecture that search for yield and investor positioning may have exacerbated the interest rate channel during the taper tantrum.13 Corroborating this, the aggregate excess positioning measure was higher prior to the taper tantrum than in any of the subsequent episodes. This may reflect typically negative returns on carry trades in the years following the taper tantrum as persistent depreciation of EME currencies eroded the gains from yield differentials. Decreases in aggregate investor positioning may explain in part why there was no strong reaction in EME currencies initially as the 10-year Treasury rose notably from historically low levels in the first half of 2022.
Table 3: EME Currency Characteristics and Depreciation
| Event | UST beta | VIX beta | HYS beta | Excess positioning | Carry returns | REER Deviation | Vulnerability score |
|---|---|---|---|---|---|---|---|
| European debt crisis (2011) | 0.23 | 0.8 | 0.23 | -0.09 | 0.02 | 0.23 | 0.55 |
| Taper tantrum (2013) | 0.1 | -0.13 | 0.21 | 0.41 | 0.7 | 0.23 | 0.61 |
| Commodity price declines / Global growth concerns (2014/15) | 0.07 | 0.4 | 0.53 | -0.18 | 0.05 | -0.58 | 0.35 |
| Renminbi devaluation / China slowdown (2015) | 0.32 | 0.53 | 0.39 | -0.4 | 0.31 | -0.55 | 0.37 |
| U.S. Elections (2016) | 0.22 | 0.12 | -0.33 | -0.03 | -0.21 | -0.07 | 0 |
| Trade tensions / Fed tightening (2018) | 0.67 | 0.49 | 0.13 | -0.05 | -0.08 | -0.18 | 0.37 |
| COVID-19 (2020) | 0.68 | 0.63 | 0.55 | -0.02 | 0.27 | -0.67 | 0.46 |
| Monetary tightening in AEs accelerates (2022) | -0.03 | 0.28 | 0.19 | 0.26 | -0.1 | -0.4 | 0.3 |
| Median | 0.23 | 0.45 | 0.22 | -0.04 | 0.04 | -0.29 | 0.37 |
Note: UST denotes the 10-year U.S. Treasury yield, HYS denotes high-yield corporate spread, and REER Deviation is the difference between REER and its 10-year average prior to each event.
In conclusion, our analysis shows that the relationship between U.S. yields and EME currencies during major depreciation episodes strongly depends on the underlying economic shocks, reinforcing findings from recent studies in a different context.14 Evidence from both time series and cross-sectional data emphasize the risk-channel as a crucial driver of EME exchange rates in the post-GFC era during these large depreciation events. In six of the eight episodes we examine, EME currency depreciation was accompanied with a decrease in risk appetite in broader financial markets. In most cases, it was negative growth/risk shocks that drove these moves while the risk-taking channel of monetary policy was instrumental in the case of the taper tantrum and especially the recent tightening episode. The taper tantrum was not a particularly large shock for EME currencies by the standards of the post-GFC years, but it was unique in terms of the role of search for yield and investor positioning. In addition, we find that perceived riskiness of EME currencies is tightly linked with macroeconomic fundamentals in these economies.
References
Ahmed, S., Coulibaly, B. and Zlate, A., 2017. International financial spillovers to emerging market economies: How important are economic fundamentals?. Journal of International Money and Finance, 76, pp.133-152.
Farrell, D., Eckerd, G., Zhao, C. and O'Brien, M., 2020. Tracking Spillovers During the Taper Tantrum: Evidence from Institutional Investor Transactions in Emerging Markets. Available at SSRN: https://dx.doi.org/10.2139/ssrn.3640801.
Fischer, S., 2017. Monetary Policy Expectations and Surprises. Board of Governors of the Federal Reserve System. https://www.federalreserve.gov/newsevents/speech/fischer20170417a.htm
Fratzscher, M., Schneider, D. and Van Robays, I., 2014. Oil prices, exchange rates and asset prices. European Central Bank Working Paper Series No. 1689.
Hassan, T.A. and Zhang, T., 2021. The economics of currency risk. Annual Review of Economics, 13, pp. 281-307.
Hoek, J., Kamin, S. and Yoldas, E., 2022. Are higher US interest rates always bad news for emerging markets?. Journal of International Economics, 137, 103585.
Hoek, J., Kamin, S. and Yoldas, E. 2021. Are Rising U.S. Interest Rates Destabilizing for Emerging Market Economies?, FEDS Notes. Washington: Board of Governors of the Federal Reserve System, June 23, 2021, https://doi.org/10.17016/2380-7172.2930.
Perez-Segura, A. and R.J. Vigfusson (2016). The Relationship Between Oil Prices and Inflation Compensation, IFDP Notes. Washington: Board of Governors of the Federal Reserve System, April 06, 2016. https://doi.org/10.17016/2573-2129.19
Stein, J., 2014. Challenges for Monetary Policy Communication. Board of Governors of the Federal Reserve System. https://www.federalreserve.gov/newsevents/speech/stein20140506a.htm
Appendix
A. Data
The 18 floating EME currencies included in the analysis are the Brazilian real, Chilean peso, Colombian peso, Czech koruna, Hungarian forint, Israeli shekel, Indian rupee, Indonesian rupiah, Korean won, Mexican peso, Malaysian ringgit, Peruvian sol, Philippine peso, Polish zloty, Russian ruble, Thai baht, Turkish lira, and South African rand. The Turkish lira and Russian ruble are excluded from the sample after 2017 and 2021, respectively, as idiosyncratic developments dominated the movements in these currencies. We use the following currencies to calculate the AE average shown in Table 2: Australian dollar, British pound, Canadian dollar, euro, Japanese yen, Norwegian krone, New Zealand Dollar, Swedish krona, and Swiss franc.
Spot and forward exchange rates, VIX index, U.S. Treasury yields, commodity prices (Bloomberg Commodity Index), historical carry returns, and real effective exchange rates (J.P. Morgan Real Broad Effective Exchange Rate Indexes) were all obtained from Bloomberg. U.S. high-yield corporate spreads (ICE BofA US High Yield Index Option-Adjusted Spread) were obtained from FRED, Federal Reserve Bank of St. Louis. Components of the vulnerability index are sourced from Haver Analytics, the International Monetary Fund, CIEC, and Bank for International Settlements.
Data on investor positioning in EME currencies were obtained from State Street Corporation's custodial holdings. The holdings represent the flows of aggregated portfolios that account for nearly 11 percent of the world's tradable securities. The data are daily and separated by currency and weighted by clients' assets under management. Total and excess holdings are available for foreign exchange positions, where excess holdings reflect deviations relative historical benchmark levels.
B. Depreciation Episodes
European Debt Crisis (07/22/2011 – 11/25/2011)
- The European debt crisis intensified in the second half of 2011 as concerns over fiscal sustainability spread to larger euro-area countries. Spreads of Spanish and Italian bonds over German equivalents spiked and reached historic highs in November.
- Though a resolution was reached in early August, the U.S. debt ceiling crisis may have also contributed to increased risk aversion in global financial markets during this time.
- Moreover, economic data in both the euro area and U.S. were generally weak and led to downward revisions to growth forecasts and perceptions of increased downside risks to global growth.15
Taper tantrum (05/02/2013 – 09/05/2013)
- At its May meeting, the FOMC introduced language in its policy statement regarding a potential change in the pace of asset purchases. Though initial reaction was muted, the 10-year U.S. Treasury yield rose noticeably in the following days.
- Subsequently, Chairman Ben Bernanke's remarks at his congressional testimony on May 22 and the press conference following the June FOMC meeting were interpreted as signaling the future tapering of the Federal Reserve's asset purchases. Although these communications were largely in line with expectations reported in the FRBNY Survey of Primary Dealers, they resulted in sharp increases in the 10-year U.S. Treasury yield.
Commodity price declines / global growth concerns (11/10/2014 – 03/16/2015)
- Booming U.S. oil production and OPEC's November 2014 decision to not cut oil production drove large decreases in oil prices. The price of Brent crude oil fell about 35 percent to 53 dollars per barrel over the episode.
- Though the drop in oil prices was mostly supply-driven, contemporaneous large declines in industrial metals prices suggest demand also played a role. Indeed, Perez-Segura and Vigfussion (2016) find that while supply-induced changes drove oil prices during the summer and early fall of 2014, lower global demand played an important role in late 2014 and early 2015.
- At the same time, the European Central Bank reduced its policy rate to negative territory and embarked on large scale asset purchases in the face of falling inflation expectations and increased downside risks. The euro depreciated about 25 percent against the dollar from March 2014 to March 2015, with about half of the depreciation occurring during the episode under consideration. Currencies of eastern European EMEs with strong ties to the euro-area economy depreciated notably against the dollar.
Renminbi devaluation / China slowdown (05/20/2015 – 09/23/2015)
- The devaluation of the renminbi and sharp declines in Chinese equity prices spilled over to global financial markets and led to concerns about global growth.
- Commodity prices declined 15 percent; asset prices of commodity exporters and EMEs with close links to China came under pressure.
- China's surprise devaluation also resulted in a significant in increase in economic policy uncertainty in China.16
U.S. Elections (08/16/2016 – 12/20/2016)
- The U.S. elections led to significant shift in market expectations for increased fiscal stimulus, higher U.S. inflation, and somewhat tighter monetary policy. Two- and 10-year U.S. Treasury yields rose 47 basis points and 99 basis points to 1.22 and 2.56 percent, respectively, while the 5-year inflation swap rate increased about 60 basis points to 2.1 percent.
Trade tensions / Fed tightening (04/11/2018 – 08/15/2018)
- U.S authorities imposed tariffs on Chinese exports in various categories in February and March. Tensions increased further when China announced retaliatory tariffs on U.S. exports in April. Further tariffs were imposed by U.S. in early July and China retaliated again.
- The renminbi depreciated 11 percent against the dollar and Chinese equities declined 15 percent during the episode.
- The trade tensions arose against the backdrop of Federal Reserve monetary policy tightening, with 2-year U.S. Treasury yield rising 30 basis points over the period.
COVID-19 (01/02/2020 – 05/07/2020)
- Public health restrictions, collapsing global economic activity, and strong investor demand for safe liquid assets led to large declines in EME asset prices and capital outflows from EMEs.
Acceleration of monetary tightening in advanced economies (06/08/2022 – 10/12/2022)
- With high and persistent inflation in many countries across the globe, synchronous tightening by major central banks led to concerns about global growth and weighed on risk appetite. Policy rates increased at a historically fast pace: the federal funds rate increased 300 basis points from early June to early November while comparable overnight rates rose 200 basis points in the euro area and the U.K. over the same period.
- Commodity prices declined notably, partially reversing increases following Russia's invasion of Ukraine and the resulting disruptions in commodity markets.
1. We thank Jasper Hoek and Shaghil Ahmed for helpful comments and Ashlyn Cenicola for help with construction of vulnerability scores. Return to text
2. See Stein (2014) and Fischer (2017) for a detailed discussion of this point. Return to text
3. We provide a detailed description of our data and the depreciation episodes in the Appendix. Return to text
4. Dollar-denominated pricing makes commodities more expensive in local currency terms when dollar appreciates, which in turn reduces demand for these commodities. For example, Fratzscher, Schneider, and Van Robays (2014) find that a 1 percent appreciation of the dollar on a trade-weighted basis leads to a 0.75 percent decline in oil prices. Return to text
5. Pro-active monetary tightening and relatively high interest rates may have also contributed to this resilience in some EME currencies during the first half of 2022. Nonetheless, subsequent broad-based depreciation of EME currencies from early June to mid-October shows that global forces can overwhelm such factors. Return to text
6. See for example, Monetary Policy Report, July 2018, Board of Governors of the Federal Reserve System. https://www.federalreserve.gov/monetarypolicy/files/20180713_mprfullreport.pdf. Return to text
7. Based on an equally weighted average return on carry return indexes of 17 EME currencies against the dollar compiled by Bloomberg. Return to text
8. The ICE BofA MOVE Index was at an all-time low in early May of 2013 while J.P. Morgan 1-month EM FX volatility index was at the 10th percentile of its historical distribution. Return to text
9. To calculate the ex-ante carry return we use 3-month forward and spot exchange rates and assume that the investor expects no change in the spot exchange rate (i.e. a random walk). Volatility is obtained from at-the-money currency options with 3-month to expiry. Return to text
10. See Ahmed, Coulibaly, and Zlate (2017). Return to text
11. As the cross-sectional sample size is small relative to potential drivers we consider, we do not conduct multiple regression analysis and instead report bivariate correlations. The results should be interpreted with appropriate caveats. In particular, significant bivariate correlations do not guarantee statistical significance in a multiple regression setting as a subset of variables may dominate. Return to text
12. A strand of the academic literature links currency risk premiums with economic fundamentals. See Hassan and Zhang (2021) for a comprehensive survey. Return to text
13. Consistent with this evidence, Farrell, Eckerd, Zhao, and O'Brien (2020) find a significant role for intuitional investor flows in driving EME currencies during the taper tantrum. Return to text
14. Hoek, Kamin, and Yoldas (2021, 2022) use high frequency data around FOMC meetings and U.S. employment report dates and show that higher U.S. interest rates stemming from stronger U.S. growth generate only modest spillovers to EME financial markets, while those stemming from hawkish Fed policy or inflationary pressures are much more disruptive. Return to text
15. See, for example, Citi Economic Surprise Indexes and JPMorgan Forecast Revisions Indexes for the euro area and the U.S. Return to text
16. See https://www.policyuncertainty.com/index.html for economic policy uncertainty indexes for China. Return to text
Harikrishnan, Nira, Benjamin Silk, and Emre Yoldas (2023). "U.S. Interest Rates and Emerging Market Currencies: Taking Stock 10 Years After the Taper Tantrum," FEDS Notes. Washington: Board of Governors of the Federal Reserve System, October 04. 2023, https://doi.org/10.17016/2380-7172.3385.
Disclaimer: FEDS Notes are articles in which Board staff offer their own views and present analysis on a range of topics in economics and finance. These articles are shorter and less technically oriented than FEDS Working Papers and IFDP papers.