FEDS Notes
July 28, 2023
What determines passthrough of policy rates to deposit rates in the euro area?
Todd Messer and Friederike Niepmann 1
Introduction
Interest rates on bank deposits are sticky and move only sluggishly following changes in central bank policy rates. As deposits are typically the largest share of bank liabilities, deposit rate stickiness plays a key role for bank funding costs and profitability.
This note examines passthrough from European Central Bank (ECB) policy rates to bank deposit rates across euro-area banking sectors.2 We first review bank deposits in the euro area and show that, historically, passthrough from policy rates into deposit rates has been sluggish and, depending on the maturity of deposits, incomplete. Taking a closer look at the current tightening episode, which began with the ECB's first rate hike in July 2022, passthrough into deposit rates has been even more sluggish compared to previous tightening episodes. High levels of excess reserves appear to be an important factor in explaining this sluggishness even after accounting for the effect of imperfect banking competition.3 We conclude that the relatively low rate of passthrough today is likely because banks have little incentive to attract additional deposits while liquidity is abundant relative to their capacity to expand lending.
An Overview of Deposits in the Euro Area
Figure (1) displays the evolution of deposit rates in the euro area for two sectors, households and nonfinancial corporations (NFCs), and two maturities, overnight and time.4 ECB monetary policy is reflected in the deposit facility rate, a key ECB policy rate.
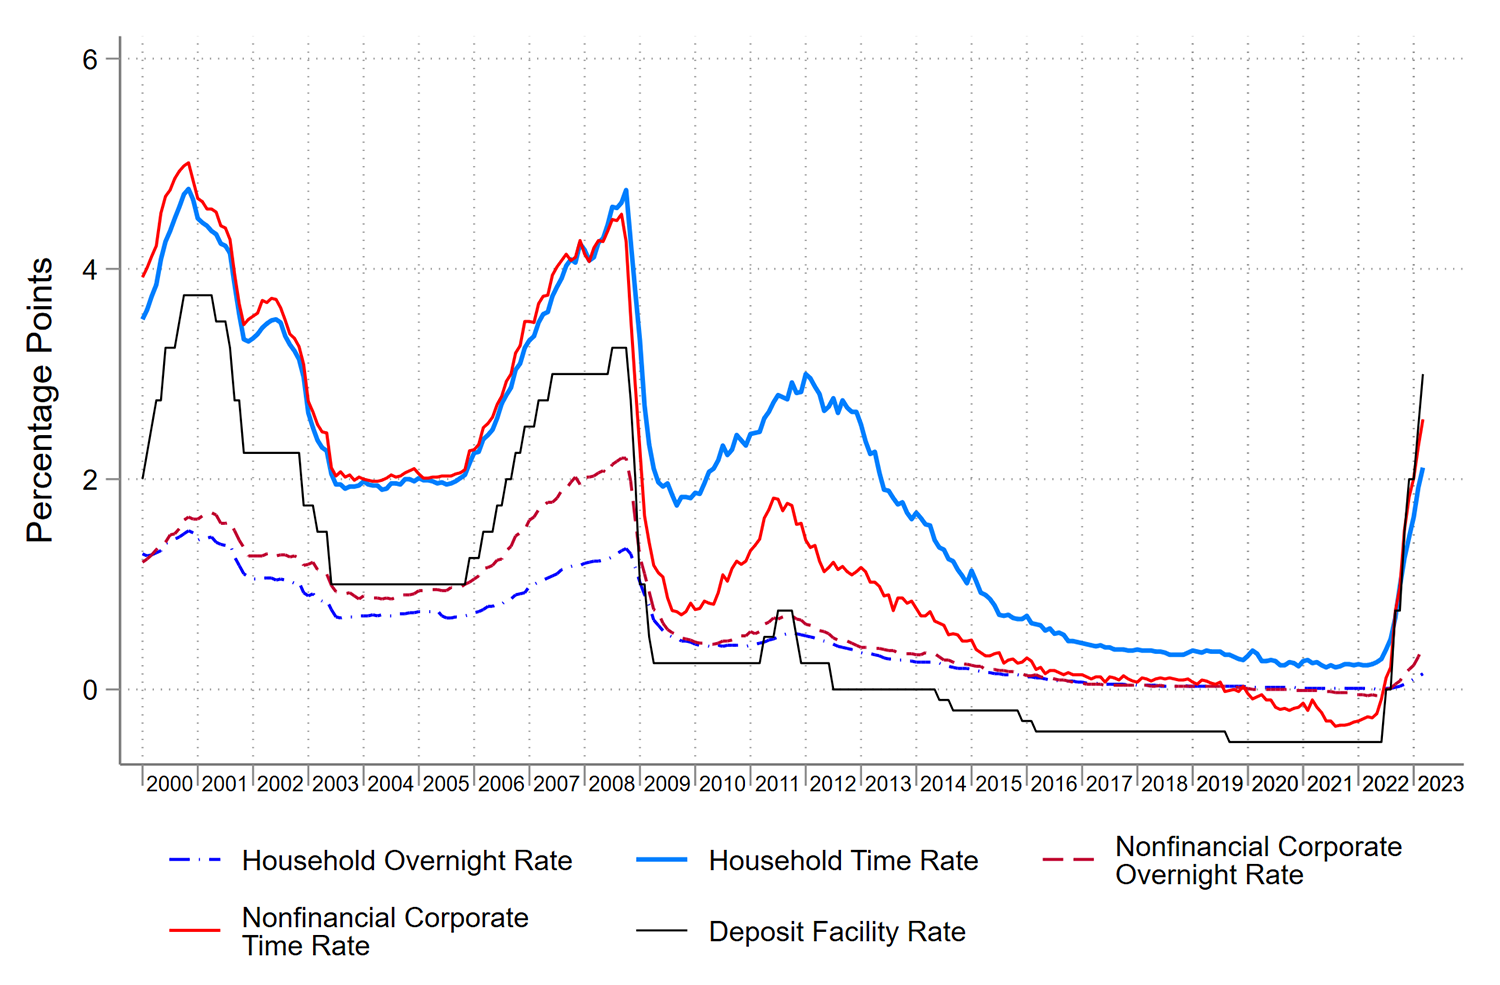
Note: This figure displays the evolution of household and NFC time and overnight deposit rates, as well as the ECB's main deposit facility rate, from January 2000 to March 2023. The thin solid black line denotes the deposit facility rate, a key ECB policy rate. The thick blue line denotes household time deposit rates, while the thin blue dash-dotted line denotes household overnight deposit rates. The medium-weighted red line denotes NFC time deposit rates, while the red dashed line denotes NFC overnight deposit rates.
Source: ECB.
Several stylized facts emerge from the chart.
- There is strong co-movement across all four deposit rate series in response to movements in the ECB policy rate.
- Despite the strong co-movement, the sensitivity of deposit rates to policy rates differs by maturity and sector.
- Overnight deposit rates (across both sectors) are less sensitive than time deposits to changes in the deposit facility rate.
- The sensitivity of household deposit rates to changes in policy rates is generally lower than that of NFC deposits rates.5
In line with these facts, the rise in policy rates over the period 2005-2007 was associated with a more rapid increase in time deposit rates compared with overnight deposit rates. In addition, the reduction in policy rates after the global financials crisis (GFC) led to a large fall in overnight rates for NFCs, while the decline for households was more moderate. Because banks were reluctant to charge households negative interest rates, the NFC overnight rate eventually dropped below the household overnight rate and into negative territory.6 As policy rates declined and the yield curve flattened, the wedge between time deposit rates and overnight deposit rates shrank. Conversely, during the recent tightening cycle, overnight deposit rates for NFCs have risen more than those for households.
Figure (2) shows the composition of deposits by sector and maturity over time. Today, household deposits (shown in shades of blue) make up over half of deposits, while the NFC share of deposits (shown in shades of orange) is nearly a quarter. For both sectors, overnight deposits make up the largest share. Overnight deposits grew in importance over the past decade, reflective of the declining wedge between overnight and time deposit rates as policy rates fell deeper into negative territory. With recent increases in policy rates and a stronger rise of rates on time deposits relative to overnight deposits, this trend is reversing and there has been a tick up in the share of time deposits for both NFCs and households.
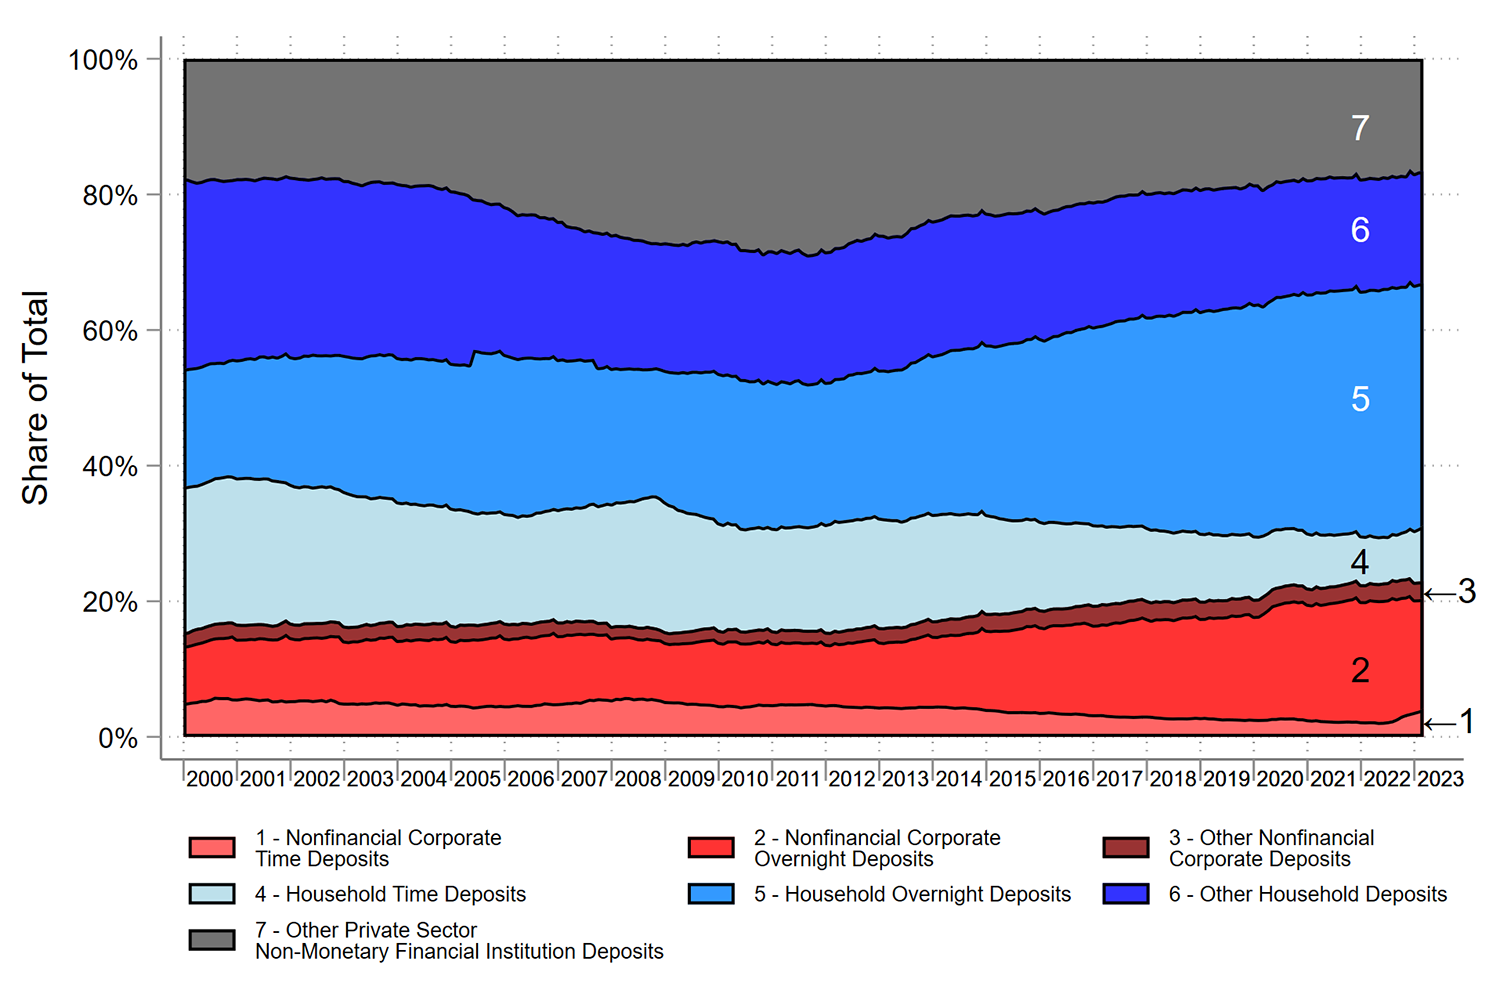
Note: This figure displays the evolution of deposits between January 2000 and March 2023. Working upwards, the bottom three categories, in progressively darker shades of red, denote NFC time deposits (1), NFC overnight deposits (2), and other NFC deposits (3), respectively. The next three categories, in progressively darker shades of blue, denote household time deposits (4), household overnight deposits (5), and other household deposits (6), respectively. Other categories include repurchase agreements, deposits "redeemable at notice" (a more restrictive form of overnight deposits), and foreign currency deposits. The top category, in gray, denotes other private sector non-monetary financial institution deposits (7), such as deposits by pension funds or insurance companies.
Source: ECB, Author's Calculations.
Deposit Rate Passthrough in Historical Context
Next, we show empirically that passthrough in the pre-pandemic period was incomplete in the short-run across all sectors and maturities, but, in the long-run, was close to complete for time deposits. We analyze passthrough following a similar approach to the literature on exchange rate pass-through (Burstein and Gopinath, 2014) via the following regression:
$$$$ \Delta r_t^d = \alpha + \sum^K_k \beta^k \Delta r_{t-k}^{ECB} + \Gamma X_t +\varepsilon_t $$$$
Here, $$ r_t^d$$ denotes a deposit rate in month $$t$$, and $$ r_t^{ECB}$$ denotes the deposit facility rate.7 The vector $$ X_t $$ includes as controls the contemporaneous and $$K$$ lags of the 12-month log change in manufacturing industrial production and core consumer price inflation to control for changes in deposit demand. We also include a dummy variable equal to one for the period between July 2014 and June 2022, to account for the period when the deposit facility rate was negative, as well as the lagged level of the deposit rate. We estimate this regression separately by sector (household and corporate) and by maturity (overnight and time deposits) using monthly data over the period from January 2000 through December 2019.
The short-run passthrough, $$ \beta^0$$, shows the contemporaneous (within the same month) relationship between changes in policy rates and changes in deposit rates (i.e., when $$k=0$$). The long-run passthrough accounts for the cumulative effect of a deposit rate change over $$K$$ consecutive periods and is given by $$ \sum_{k=0}^K \beta^k $$. In this exercise, we set $$K=12$$ so that long-run passthrough is over the next year. These measures of passthrough differ from the conventional deposit beta, which refers to the ratio of the change in the deposit rate divided by the change in the policy rate, and allow us to summarize passthrough over different periods of rate changes.
Table (1) presents the estimates for short-run and long-run passthrough for different types of deposit rates. Short-run passthrough accounts for a sizable portion of long-run passthrough, suggesting that a significant portion of the effect of higher interest rates occur within a month. Long-run and short-run passthrough into time deposits is higher than passthrough into overnight deposits confirming stylized fact 2a discussed earlier. In the long-run, passthrough is higher, but is still incomplete, with rates of passthrough for overnight deposits below 50%. In addition, passthrough is generally higher for NFCs, consistent with stylized fact 2b, although long-run time deposit passthrough is similar across sectors.
Table 1: Estimated deposit rate passthrough
| NFC Time | Household Time | NFC O/N | Household O/N | |
|---|---|---|---|---|
| Short-Run | 0.393*** | 0.289*** | 0.230*** | 0.096*** |
| (0.086) | (0.067) | (0.030) | (0.017) | |
| Long-Run | 0.526*** | 0.561*** | 0.383*** | 0.226*** |
| (0.187) | (0.198) | (0.041) | (0.030) | |
| $$N$$ | 216 | 216 | 216 | 216 |
| Adj. R2 | 0.655 | 0.59 | 0.806 | 0.789 |
Note: This table presents results from estimating Equation (1). The dependent variable is the interest rate on new deposits for nonfinancial corporate (NFC)/household overnight (O/N)/time deposits, as indicated. "Short-run" represents the one-month passthrough from the deposit facility rate, while "Long-Run" denotes the sum of the contemporaneous and lagged coefficients, as described in the text. Newey-West standard errors in parentheses. Controls include contemporaneous and lagged values of inflation and industrial production as well as the lagged level of the deposit rate.
Source: ECB, Author's calculations.
* p < 0.1, ** p < 0.05, *** p < 0.01
Passthrough in the Current Tightening Cycle
The extent of stickiness in deposit rates is an important factor determining how much banks benefit from higher policy rates. With sluggish deposit rate passthrough but quick lending rate passthrough, banks' net interest margin ($$NIM$$) —the difference between interest earned on loans and other investments, and interest paid on deposits and other liabilities—increases with rising policy rates.8 The slower deposits are repriced going forward, the higher bank profits will be, everything else equal.
In this context, we investigate how sticky deposit rates have been during the current tightening cycle relative to historical levels of stickiness. Thus far in the current cycle, deposit rates are adjusting even more sluggishly than usual. We show this in two ways: by comparing the evolution of passthrough between this tightening cycle and the previous one, and by comparing passthrough in the current cycle with estimated long-run passthrough in the pre-pandemic period.
The last major tightening period in the euro area that began in December 2005 featured quicker and higher passthrough compared with the current tightening period.9 Figure (3) plots cumulative passthrough by sector and maturity using deposit betas defined as the cumulative change in deposit rates divided by the cumulative change in policy rates. The figure compares the first months of the current tightening cycle to the first 24 months of the previous tightening cycle. The top-left panel shows steadily rising passthrough in the last major tightening episode, with passthrough rates of approximately 80% after three months and full passthrough by 24 months. Comparatively, the first three months of the current tightening episode have seen only around 40% passthrough in household time deposit rates. NFC time deposit rates have seen higher passthrough, although they are still slightly below the previous tightening cycle. Overnight deposit rates across both sectors are even stickier, with very little movement in the current tightening period.
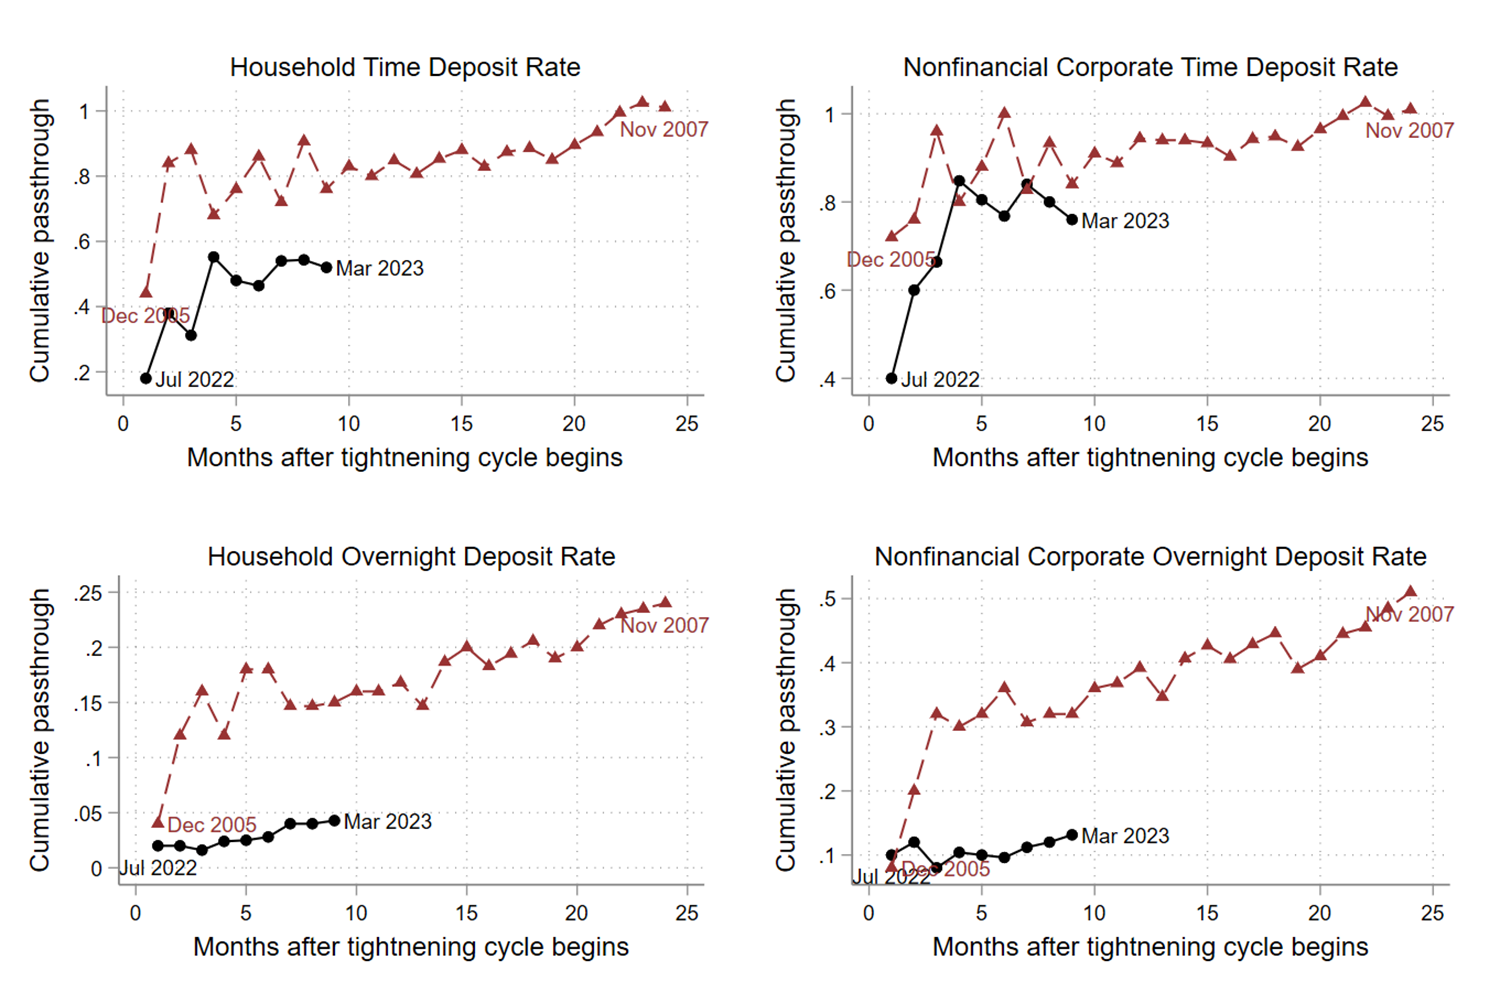
Note: This figure displays the cumulative passthrough as described in the main text. The black solid line with circles denotes cumulative passthrough in the current tightening cycle relative to June 2022. The dashed red line with triangles denotes cumulative passthrough in the first 24 months of the last tightening cycle between November 2005 and November 2007.
Source: ECB, Authors' calculations.
Comparisons at the country level tell a similar story of sluggish adjustment for the current tightening period. In additional econometric analysis at the country level, we focus on the time deposit rate because there has been only a small increase in overnight deposit rates in the current tightening cycle as discussed.
For passthrough in the current period, which is relatively short, we use the deposit beta. We calculate, between May 2022 and March 2023, the relative difference in deposit rates by jurisdiction and normalize by the relative change in the policy rate, instead of estimating equation (1).
We compare these deposit betas to passthrough in the pre-pandemic period. We calculate pre-pandemic passthrough by country via the following regression:
$$$$ \Delta r_{c,t}^d = \alpha_c + \sum_{k=0}^K \beta_c^k \Delta r_{t-k}^{ECB} + \Gamma X_{c,t} + \varepsilon_t $$$$
Here, $$ r_{c,t}^d $$ denotes the time deposit rate for country $$c$$ in month $$t$$, and $$ r_t^{ECB} $$ denotes the policy rate. We set $$K=3$$.10 We again estimate separately by sector to investigate whether the dynamics of deposit rate passthrough differ for households and nonfinancial corporations. We estimate this equation using data from January 2000 through December 2019 and calculate the sum of $$ \{ \beta_c^k \}_k^K $$ by $$c$$ to obtain the pre-pandemic long-run passthrough by country.11 To facilitate comparison, we do not include controls for industrial production or inflation in the regression for the pre-pandemic period, but we continue to include the dummy for the negative rate period and the lagged level of the deposit rate to account for weaker passthrough when rates are closer to zero.12
Figure (4) compares pre-pandemic passthrough with passthrough during the current tightening period across countries, showing again that passthrough has been more sluggish than in the past.13 The horizontal axis displays the estimates of long-run passthrough over the pre-pandemic period while the vertical axis displays the calculated passthrough in the current tightening period. The dashed diagonal line is the 45-degree line. The points almost all lie at or below the 45-degree line, indicating that passthrough thus far has been below pre-pandemic passthrough, especially for household time deposits. Also noticeable is heterogeneity across jurisdictions in passthrough during the current tightening period.
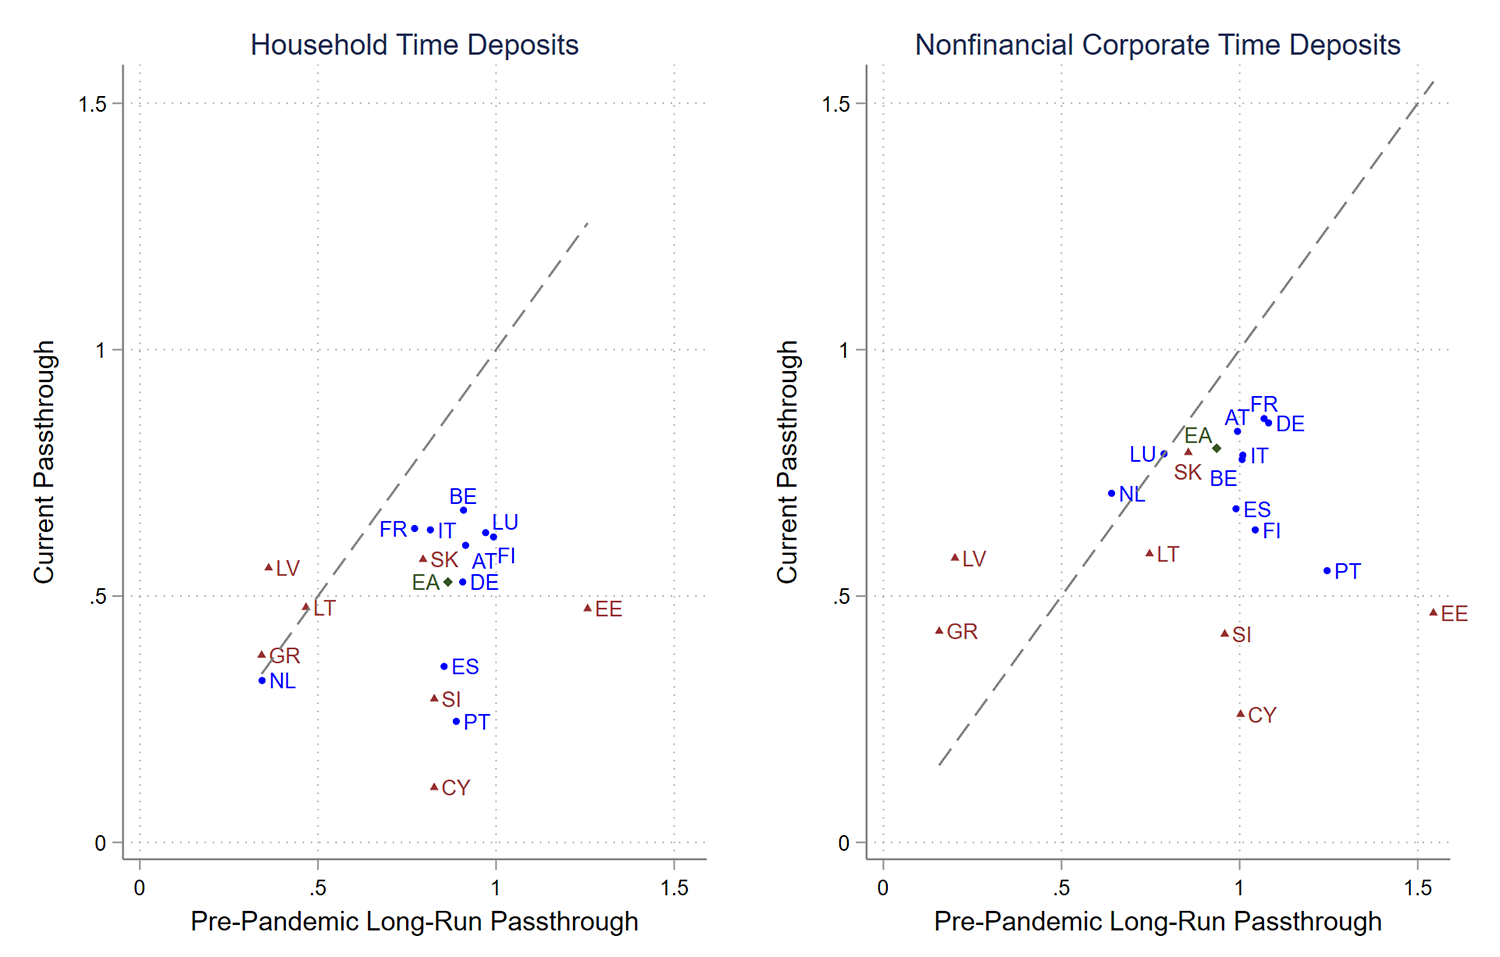
Note: This figure compares estimated passthrough in the pre-pandemic era ("Pre-Pandemic Long-Term Passthrough") to the calculated passthrough from the current tightening period ("Current Passthrough") as described in the main text. Countries in blue circles are those that joined the euro in 2000 or 2001. Countries in red triangles joined afterwards and so have shorter sample periods. The aggregate results for the euro area are in green diamonds. The pre-covid point estimates for the euro area are slightly larger than those in Table (1) because we do not include controls in this regression. The gray dashed line denotes the 45-degree line. (AT: Austria, BE: Belgium, CY: Cyprus, EE: Estonia, FI: Finland, FR: France, DE: Germany, GR: Greece, IT: Italy; LV: Latvia, LT: Lithuania, NL: Netherlands, PT: Portugal, SK: Slovakia, SI: Slovenia, ES: Spain)
Source: ECB, Authors' calculations.
Drivers of Deposit Rate Stickiness
Finally, we dive deeper into the factors that drive the stickiness of deposit rates in the current tightening period, exploiting variation across jurisdictions in passthrough into time deposit rates. We explore two potential factors: liquidity and competition.
First, to analyze the role of liquidity, we focus on two proxies that signal the abundance of liquidity for banks. We first consider bank usage of targeted long-term refinancing operations (TLTROs). TLTROs are financing operations by the ECB that offer banks long-term funding at relatively low interest rates. To the extent that banks locked-in cheap official funding through TLTROs, their need for deposit funding may be reduced. At the same time, abundant liquidity as reflected by high holdings of reserves with the ECB may signal limited scope for banks to invest in risky assets, so banks may not desire additional deposits. Both factors may limit banks' incentives to attract deposits through higher interest rates, and deposit rate passthrough may be lower in countries with larger TLTRO funding and greater excess reserves.
To proxy for TLTROs, we use the ratio of long-term refinancing operations (LTROs) outstanding to total assets in May 2022 because we only observe by country the outstanding amount of LTROs, of which TLTROs represent the vast majority. To quantify the abundance of liquidity, we compute the ratio of excess reserves to total assets in April 2022 (as May 2022 data is unavailable). We choose these dates as they are just before the tightening cycle begins.
Second, as established by the literature, banks in less competitive markets can leverage market power over deposit rates, which leads to lower passthrough.14 Therefore, we also obtain two closely related measures of competition in banking: the average NIM for banks during the 2018-2019 period (when interest rates were relatively stable) and the asset share of the top five banks in December 2021.15 Higher NIMs and larger asset shares of the top five banks are suggestive of lower competition, and so we would expect them to be negatively correlated with passthrough.
Figure (5) shows the relationship between each of these four measures and the passthrough rates in the current tightening period for household time deposits, while Figure (6) shows the relationships for NFC time deposits. In the top row of each figure are the excess reserves to total asset ratio on the left and the LTRO to total asset ratio on the right. There is a strong negative correlation between excess reserve ratios and passthrough. However, there is only a weak negative correlation between LTRO usage and passthrough. Additionally, as expected, passthrough is positively correlated with banking competition, suggesting that it is an important determinant of deposit rate passthrough for both households and nonfinancial corporations.
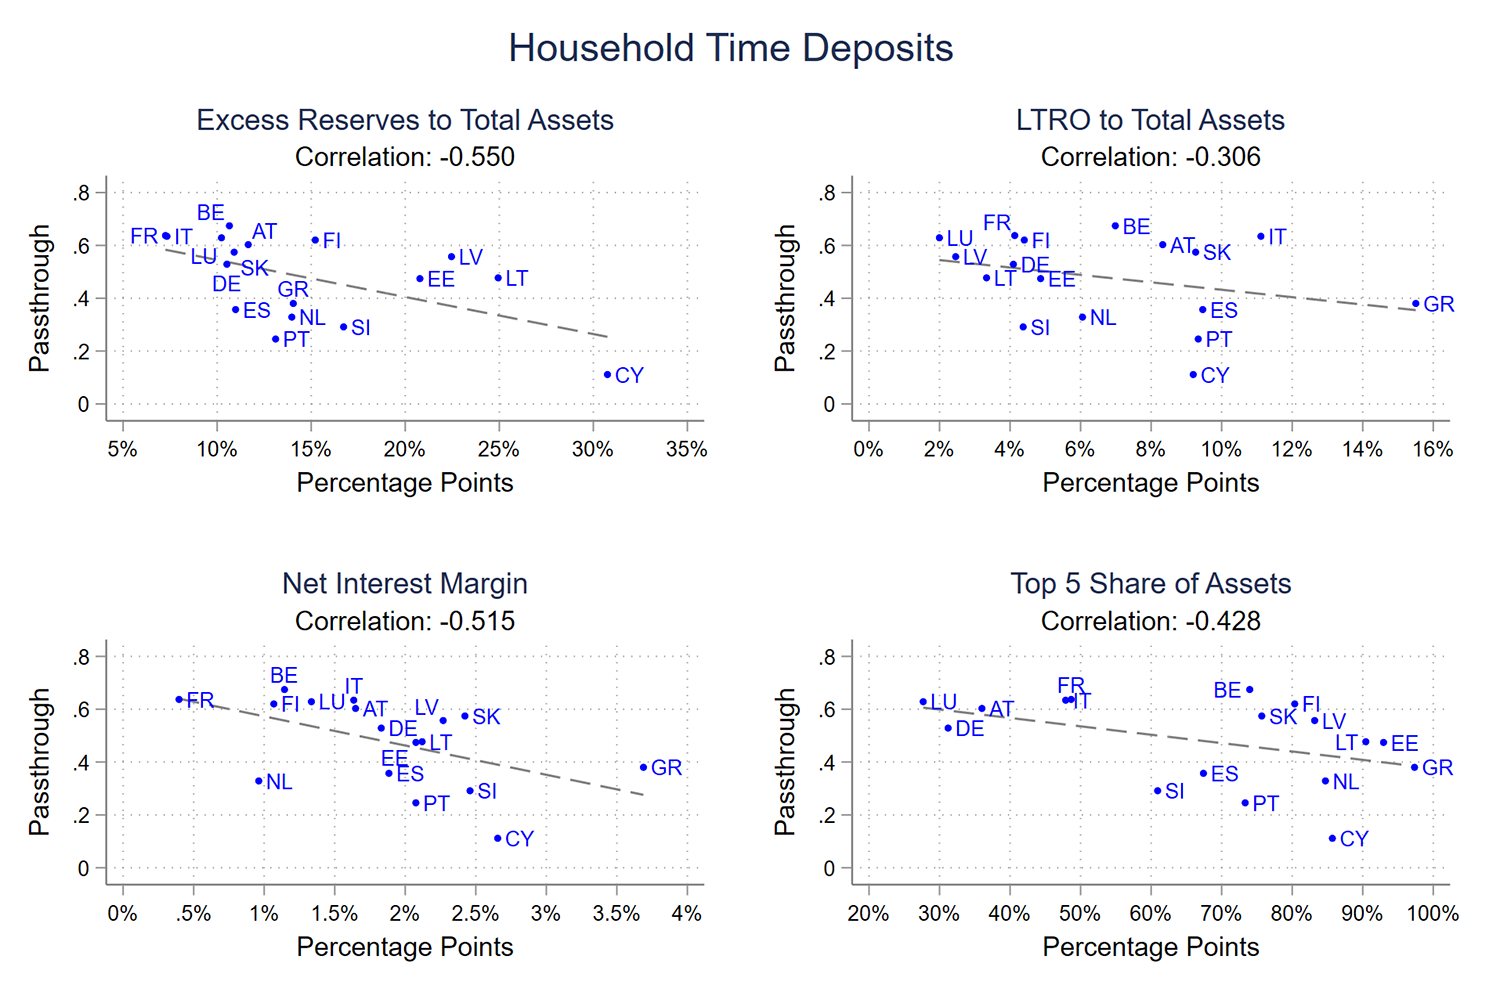
Note: This figure relates the estimated passthrough in the current tightening period to various structural measures of the banking system for household time deposits, as described in the main text. The measure of TLTRO usage relies on LTRO data, as a breakdown of LTRO is not available at the country level. The gray dashed line denotes the line of best fit. (AT: Austria, BE: Belgium, CY: Cyprus, EE: Estonia, FI: Finland, FR: France, DE: Germany, GR: Greece, IT: Italy; LV: Latvia, LT: Lithuania, NL: Netherlands, PT: Portugal, SK: Slovakia, SI: Slovenia, ES: Spain)
Source: ECB, Authors' Calculations.
Figure 6. Correlations of Nonfinancial corporate Time Deposit Passthrough with Measures of the Banking System
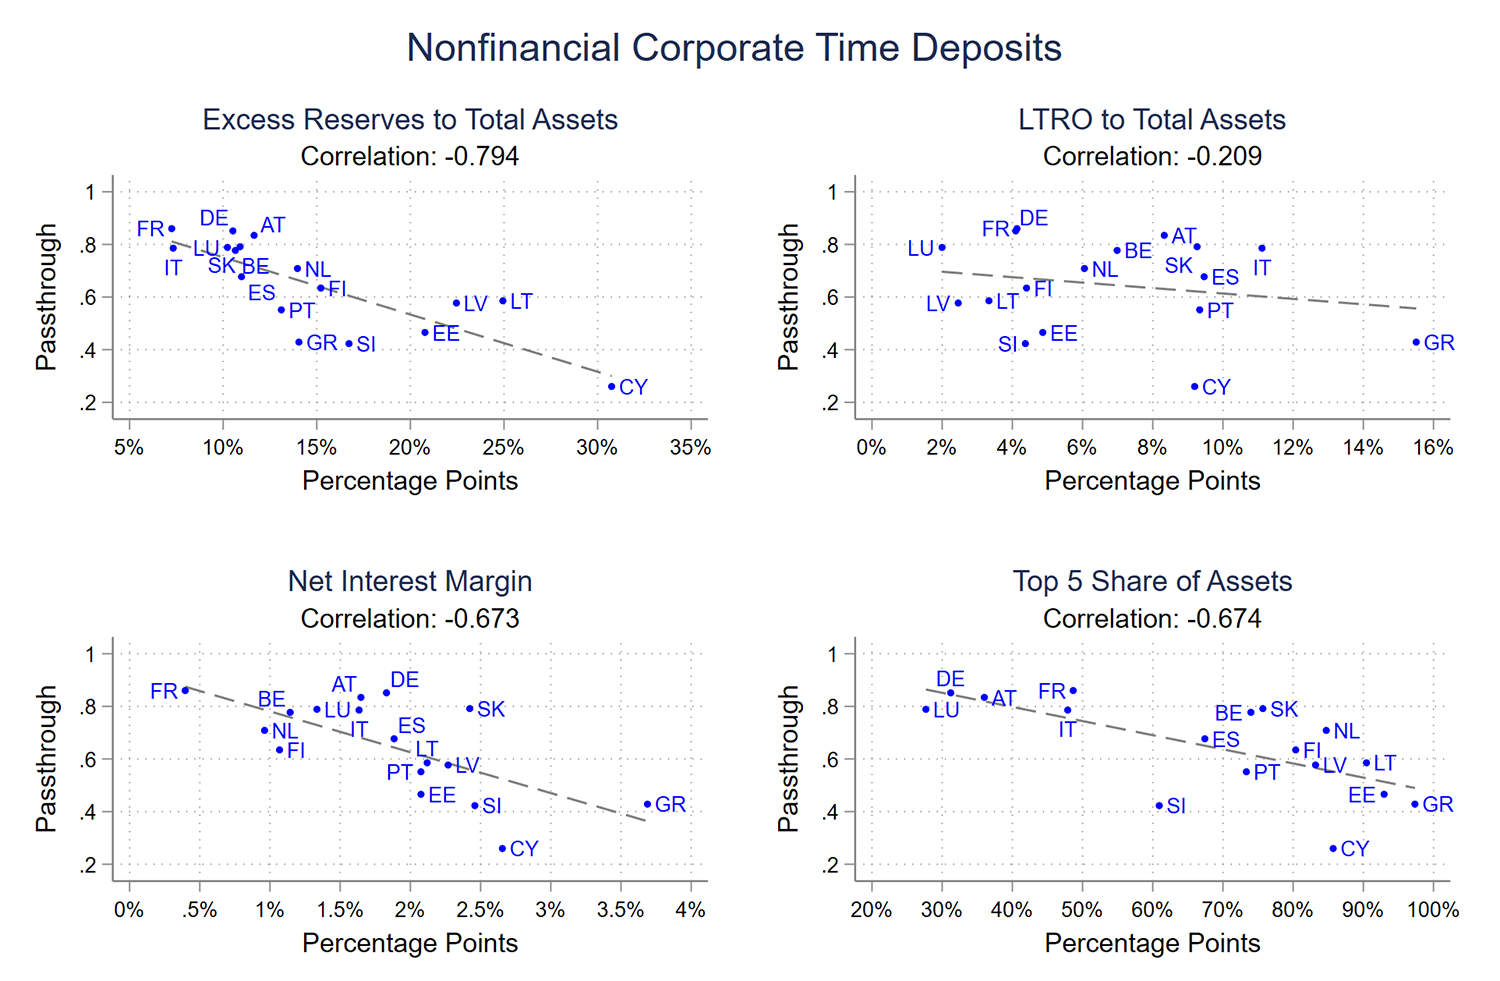
Note: This figure relates the estimated passthrough in the current tightening period to various structural measures of the banking system for nonfinancial corporate time deposits, as described in the main text. The measure of TLTRO usage relies on LTRO data, as a breakdown of LTRO is not available at the country level. The gray dashed line denotes the line of best fit. (AT: Austria, BE: Belgium, CY: Cyprus, EE: Estonia, FI: Finland, FR: France, DE: Germany, GR: Greece, IT: Italy; LV: Latvia, LT: Lithuania, NL: Netherlands, PT: Portugal, SK: Slovakia, SI: Slovenia, ES: Spain)
Source: ECB, Authors' Calculations.
It may be the case that the correlations we observe in Figures 5 and 6 are misleading in that one structural factor determines both passthrough and other characteristics of the banking sector. For example, levels of excess reserves may be correlated with measures of competition because less competitive banking sectors can charge higher interest rates on lending. Higher interest rates reduce the quantity of loans demanded, and banks may thus maintain higher levels of excess reserves. In this case, the correlation shown in the excess reserve figures would be capturing the effect of imperfect competition.
We therefore turn to regression analysis. Table (2) shows a regression of passthrough in the current tightening period on excess reserves to total assets and NIMs. For NFCs, both NIMs and the level of excess reserves have statistically significant effects on passthrough, providing further evidence that passthrough of policy rates to NFC deposit rates is higher for more competitive banking sectors and those that hold higher levels of excess reserves at the ECB. We obtain similar results when the top 5 asset share is included in the regression in place of NIMs. However, for household deposits, regression coefficients when including both excess reserves and NIMs or the top 5 share are not statistically significant. Our measures of liquidity and market structure explain much less of the variation in passthrough to household deposits than to NFC deposits, as evidenced by the lower R-squared, suggesting there is some other important determinant of household deposit rate passthrough.
Table 2: Relative Importance of Excess Reserves and Banking Sector Competition
| Households | Nonfinancial Corporations | |||||
|---|---|---|---|---|---|---|
| Passthrough | Passthrough | Passthrough | Passthrough | Passthrough | Passthrough | |
| Excess Reserves | -1.402*** | -1.014 | -2.176*** | -1.686*** | ||
| (0.532) | (0.592) | (0.340) | (0.400) | |||
| $$NIM$$ | -0.111** | -0.0717* | -0.155*** | -0.0906*** | ||
| (0.0459) | (0.0374) | (0.0360) | -0.0296) | |||
| Constant | 0.685*** | 0.684*** | 0.761*** | 0.969*** | 0.936*** | 1.065*** |
| (0.0778) | (0.0864) | (0.0865) | (0.0516) | (0.0595) | (0.0478) | |
| $$N$$ | 17 | 17 | 17 | 17 | 17 | 17 |
| Adj. R2 | 0.256 | 0.217 | 0.304 | 0.605 | 0.416 | 0.717 |
| Households | Nonfinancial Corporations | |||||
|---|---|---|---|---|---|---|
| Passthrough | Passthrough | Passthrough | Passthrough | Passthrough | Passthrough | |
| Excess Reserves | -1.402** | -1.174 | -2.176*** | -1.670** | ||
| (0.532) | (0.763) | (0.340) | (0.546) | |||
| Top 5 Share | -0.317** | -0.108 | -0.537*** | -0.24 | ||
| (0.110) | (0.149) | (0.105) | (0.147) | |||
| Constant | 0.685*** | 0.694*** | 0.725*** | 0.969*** | 1.013*** | 1.058*** |
| (0.0778) | (0.0647) | (0.0703) | (0.0516) | (0.0655) | (0.0616) | |
| $$N$$ | 17 | 17 | 17 | 17 | 17 | 17 |
| Adj. R2 | 0.256 | 0.129 | 0.218 | 0.605 | 0.418 | 0.642 |
Note: This table reports results of estimating y_i=α+βX_i+ ϵ_i $$y_i = \alpha +\beta X_i + \epsilon_i $$ , where y_i $$ y_i $$ denotes passthrough in the current tightening cycle from May 2022 to December 2022 as described in the text. The X_i $$ X_i $$ variables include “Excess Reserves,” which denotes the ratio of excess reserves to total assets in April 2022. As measures of competition, we include “NIM,” which calculated the average NIM between 2017 and 2019, and “Top 5 Share,” which denotes the share of assets at the largest five institutions. Heteroskedasticity robust standard errors in parentheses.* p < 0.1, ** p < 0.05, *** p < 0.01
Source: ECB, Authors' Calculations.
Why does the level of excess reserves play a role for passthrough? When banks hold reserves beyond required minimums, it is because they prefer to place funds with the central bank over lending them elsewhere. This can be because banks have more funds available than opportunities to lend or because they are balance sheet constrained and cannot lend more. Regardless, when excess reserves are plentiful (for example, as a result of quantitative easing), banks have little incentive to attract deposits and hence are less willing to raise deposit rates, resulting in sluggish deposit rate passthrough.
Concluding Remarks
Passthrough of policy rates to deposit rates in the euro area during the current tightening cycle has, thus far, been more sluggish than in previous tightening episodes. Results showing that levels of excess reserves explain cross-country variation in passthrough suggest that the abundance of liquidity in the euro-area system—a result of past monetary policy interventions including during the pandemic—is a likely explanation.
Whether excess reserves reflect an abundance of liquidity due to lack of investment opportunities or balance sheet constraints, banks currently do not seem to have a strong incentive to attract deposits, and deposit rates could remain low for longer than history would suggest.
That said, passthrough could soon accelerate. Even though we have not found a correlation between passthrough and TLTRO usage across countries, the planned phase-out of TLTROs by 2024 will drain reserves from the euro-area financial system, as will quantitative tightening by the ECB. As policy rates rise further, it is likely that competition for deposits and, hence, passthrough rates will increase at some point for all countries.16
Other countries are also experiencing rising policy rates against a backdrop of abundant liquidity. In the United States, deposit rate passthrough has also been found to be lower post the Global Financial Crisis than prior (Kang-Landsberg and Plosser 2022). While sluggish adjustment of deposit rates from rising interest rates is favorable for banks' interest income, higher rates tend to negatively affect asset performance and cause valuation losses. For some banks, as evidenced in the United States since March, losses on fixed income assets can limit, or even offset, the effect of higher margins from rising interest rates over time.
References
Burstein, Ariel, and Gita Gopinath. 2014. "International Prices and Exchange Rates." Handbook of International Economics, 4th ed., 4: 391-451. Elsevier.
Drechsler, Itamar, Alexi Savov, and Philipp Schnabl, The Deposits Channel of Monetary Policy, The Quarterly Journal of Economics, Volume 132, Issue 4, November 2017, Pages 1819–1876, https://doi.org/10.1093/qje/qjx019.
Driscoll, John C. and Ruth Judson, 2013. "Sticky deposit rates," Finance and Economics Discussion Series 2013-80, Board of Governors of the Federal Reserve System (U.S.).
European Central Bank, 2022. "November 2022 Financial Stability Review." European Central Bank.
Kang-Landsberg and Plosser, 2022. "How do Deposit Rates Respond to Monetary Policy?" Liberty Street Economics, Federal Reserve Bank of New York. https://libertystreeteconomics.newyorkfed.org/2022/11/how-do-deposit-rates-respond-to-monetary-policy/. Accessed 8 Feb. 2023
Neumark, David, and Steven A. Sharpe, 1992. "Market Structure and the Nature of Price Rigidity: Evidence from the Market for Consumer Deposits." The Quarterly Journal of Economics, vol. 107, no. 2, pp. 657–80. JSTOR, https://doi.org/10.2307/2118485.
Sørensen, Christoffer Kok and Thomas Werner, 2006. "Bank Interest Rate Pass-through in the Euro Area: A Cross-Country Comparison." Working Paper Series, no. 580, European Central Bank.
1. The analysis and conclusions set forth are those of the authors and do not indicate concurrence by other members of the research staff or the Board of Governors. This note benefited from comments and suggestions by Ricardo Correa and Pinar Uysal. Return to text
2. The euro area countries included in our analysis comprise Austria, Belgium, Cyprus, Germany, Estonia, Spain, Finland, France, Greece, Italy, Lithuania, Luxembourg, Latvia, the Netherlands, Portugal, Slovakia, and Slovenia. We drop Ireland, Malta, and Croatia due to missing data. Return to text
3. Some research arguing for bank market power as an important determinant of deposit rate passthrough includes Neumark and Sharpe (1992) and Drechsler, Savov, and Schnabl (2017). Return to text
4. Time deposits refer to "deposits with agreed maturity" which cannot be withdrawn on demand. The maturity can range from less than a year to significantly longer than two years. Return to text
5. This stylized fact is consistent with early evidence from the euro area by Sørensen and Werner (2006). Return to text
6. The ECB Deposit Facility Rate functions as the "floor" in the ECB's corridor system approach to monetary policy by setting a lower bound for interest rates as banks can choose to deposit excess liquidity at the facility. Return to text
7. Results are similar when using the main refinancing rate or the marginal lending facility rate. Return to text
8. Accordingly, NIMs, a measure of profitability, and bank stock prices of euro-area banks have been boosted by recent interest rate increases (despite some offsetting effects of higher rates on bank profitability). While higher rates increase NIMs thanks to sticky deposit rates, they negatively affect asset quality and trigger losses on fixed-income assets. For evidence of higher profitability in the most recent tightening episode, see the ECB Financial Stability Review (ECB 2022), which outlines increases in NIMs following policy rate increase for banks in the euro-area through November 2022. Return to text
9. The current tightening period features a much steeper change in policy rates, which may contribute to the lower rates of passthrough we observe. Return to text
10. We set $$K=3$$ to keep the regression model parsimonious. Results from estimating Equation (1) suggest that coefficients are significantly only up to the first three lags, suggesting most of the passthrough occurs within the first three months. The results are qualitatively unchanged when including more lags as coefficients for $$k>3$$ are small and almost always insignificant. Return to text
11. We therefore estimate passthrough including episodes of rising and falling rates. In unreported results, we show that for time deposits, passthrough was higher in periods when rates were rising, but passthrough was roughly equivalent for overnight deposits. Return to text
12. We experimented with estimating the regression equation using data from January 2022 through December 2022 and including the contemporaneous and first lag for industrial production and inflation as controls. The variation across countries is similar, but the point estimates are imprecise owing to the small number of observations, with point estimates of passthrough for some countries being much larger than 1 in some specifications. Return to text
13. In unreported results, we show that passthrough is generally higher in periods of tightening. The pre-pandemic passthrough estimates can therefore be thought of as a lower bound in a comparison of the current tightening period with previous tightening periods. Return to text
14. Some research arguing for bank market power as an important determinant of deposit rate passthrough includes Neumark and Sharpe (1992) and Drechsler, Savov, and Schnabl (2017). Return to text
15. Using instead the Herfindahl-Hirschman Index gives similar results. Return to text
16. The countries with the highest TLTRO usage are in the "periphery" and have higher sovereign spreads. Therefore, cross-sectional dispersion in TLTRO usage may be driven by the attractiveness of TLTROs relative to other sources of funding and may not reflect the extent to which banking sectors need to attract deposits. Return to text
Messer, Todd, and Friederike Niepmann (2023). "What determines passthrough of policy rates to deposit rates in the euro area?," FEDS Notes. Washington: Board of Governors of the Federal Reserve System, July 28, 2023, https://doi.org/10.17016/2380-7172.3297.
Disclaimer: FEDS Notes are articles in which Board staff offer their own views and present analysis on a range of topics in economics and finance. These articles are shorter and less technically oriented than FEDS Working Papers and IFDP papers.