IFDP Notes
February 02, 2018
What Equity Markets Said about Brexit-related Costs to U.S. Banks
Nicholas Coleman, Friederike Niepmann, and Stefan Walz1
On June 23, 2016, the United Kingdom voted to leave the European Union. This event, known as "Brexit," has increased uncertainty about the prospects of the British economy and its financial services industry. Brexit may also weigh on the performance of the U.S. financial sector for at least two broad reasons. First, the London subsidiaries of U.S. banks may lose access to the EU single market. Many U.S. banks use their London subsidiaries to serve clients in EU member states. They are able to do so because EU regulations allow banks that are licensed in one EU member state to establish branches and conduct banking business in other EU member states. To continue to serve these clients, the banks may have to shift part of their operations and relocate staff to the remaining member states, which is costly. In addition, they may need to employ more complex business models, and, if EU and U.K. regulations diverge, may face higher compliance costs, both of which may weigh on bank profitability over time. Second, U.S. banks' lending to residents of the United Kingdom may become less profitable if the U.K. economy weakens as a result of the vote and a departure from the EU. In this note, we use data on stock prices and betting market odds of Brexit for the period leading to and including the vote to estimate the magnitude of markets-implied costs of Brexit for U.S. banks.
It is important to understand the limitations of the estimated magnitude of the markets-implied costs. First, the estimate is based only on the information set that participants in the equity and betting markets had up to the day of the vote. Therefore, the estimate does not include any information revealed after the vote. For example, in the immediate aftermath of the vote, the U.K. economy had been more resilient than market participants predicted. Because we use stock price movements prior to the vote, the estimate may reflect a more pessimistic view of the U.K. economy. In a similar vein, market participants held certain beliefs about a post-Brexit trade regime, which may or may not turn out to be accurate. For example, if market participants believed that the United Kingdom would lose access to the EU single market, but it ultimately does not, then again the estimate might reflect a more pessimistic view. Second, our analysis assumes that stock price movements reflect market participants' views of the underlying profitability of U.S. banks and is not driven by, for example, speculation or short-covering. Third, our analysis takes as given that betting market odds are an acceptable metric of equity market participants' view of the probability of Brexit. In some recent instances, the referendum outcomes that were indicated by betting market odds did not materialize, in part, because the odds, reflecting the view of the betting market participants, do not necessarily reflect the general views of the voting population. With these caveats strongly emphasized, the econometric analysis suggests that, ahead of the Brexit vote, the markets-implied cost of Brexit for large U.S. banks ranged from $35 billion to $52 billion, about 3 percent to 4 percent of the banks' stock market capitalization on the day of the vote.
U.S. bank activity in the United Kingdom
U.S. banks have sizable U.K. operations, which serve customers in the United Kingdom, other EU countries, and non-EU countries. Figure 1 shows the exposures of U.S. banks in the United Kingdom using data from the FFIEC 009 Country Exposure Reports. Claims of U.S. banks on U.K. counterparties are greater than on any other single foreign country, making up roughly 14 percent of their foreign claims, as shown to the left. The sectoral breakdown of claims (on the right) highlights the variety of different activities that U.S. banks conduct in the United Kingdom. That said, most of the activity is wholesale business concentrated in the financial sector: More than half of total claims are on financial corporations, of which nonbank financial corporations command a large share.
Not only are U.S. banks' U.K. operations large, they are also complex. U.S. banks have around 1,000 branches and subsidiaries in the United Kingdom (as of end-March 2017), with subsidiaries specializing in various business segments including banking, insurance, securities, trust, and other activities. The ownership structure of these entities can also be complex: The average U.K. entity owned by a U.S. bank has more than five tiers of ownership below the "headquarters" level.2
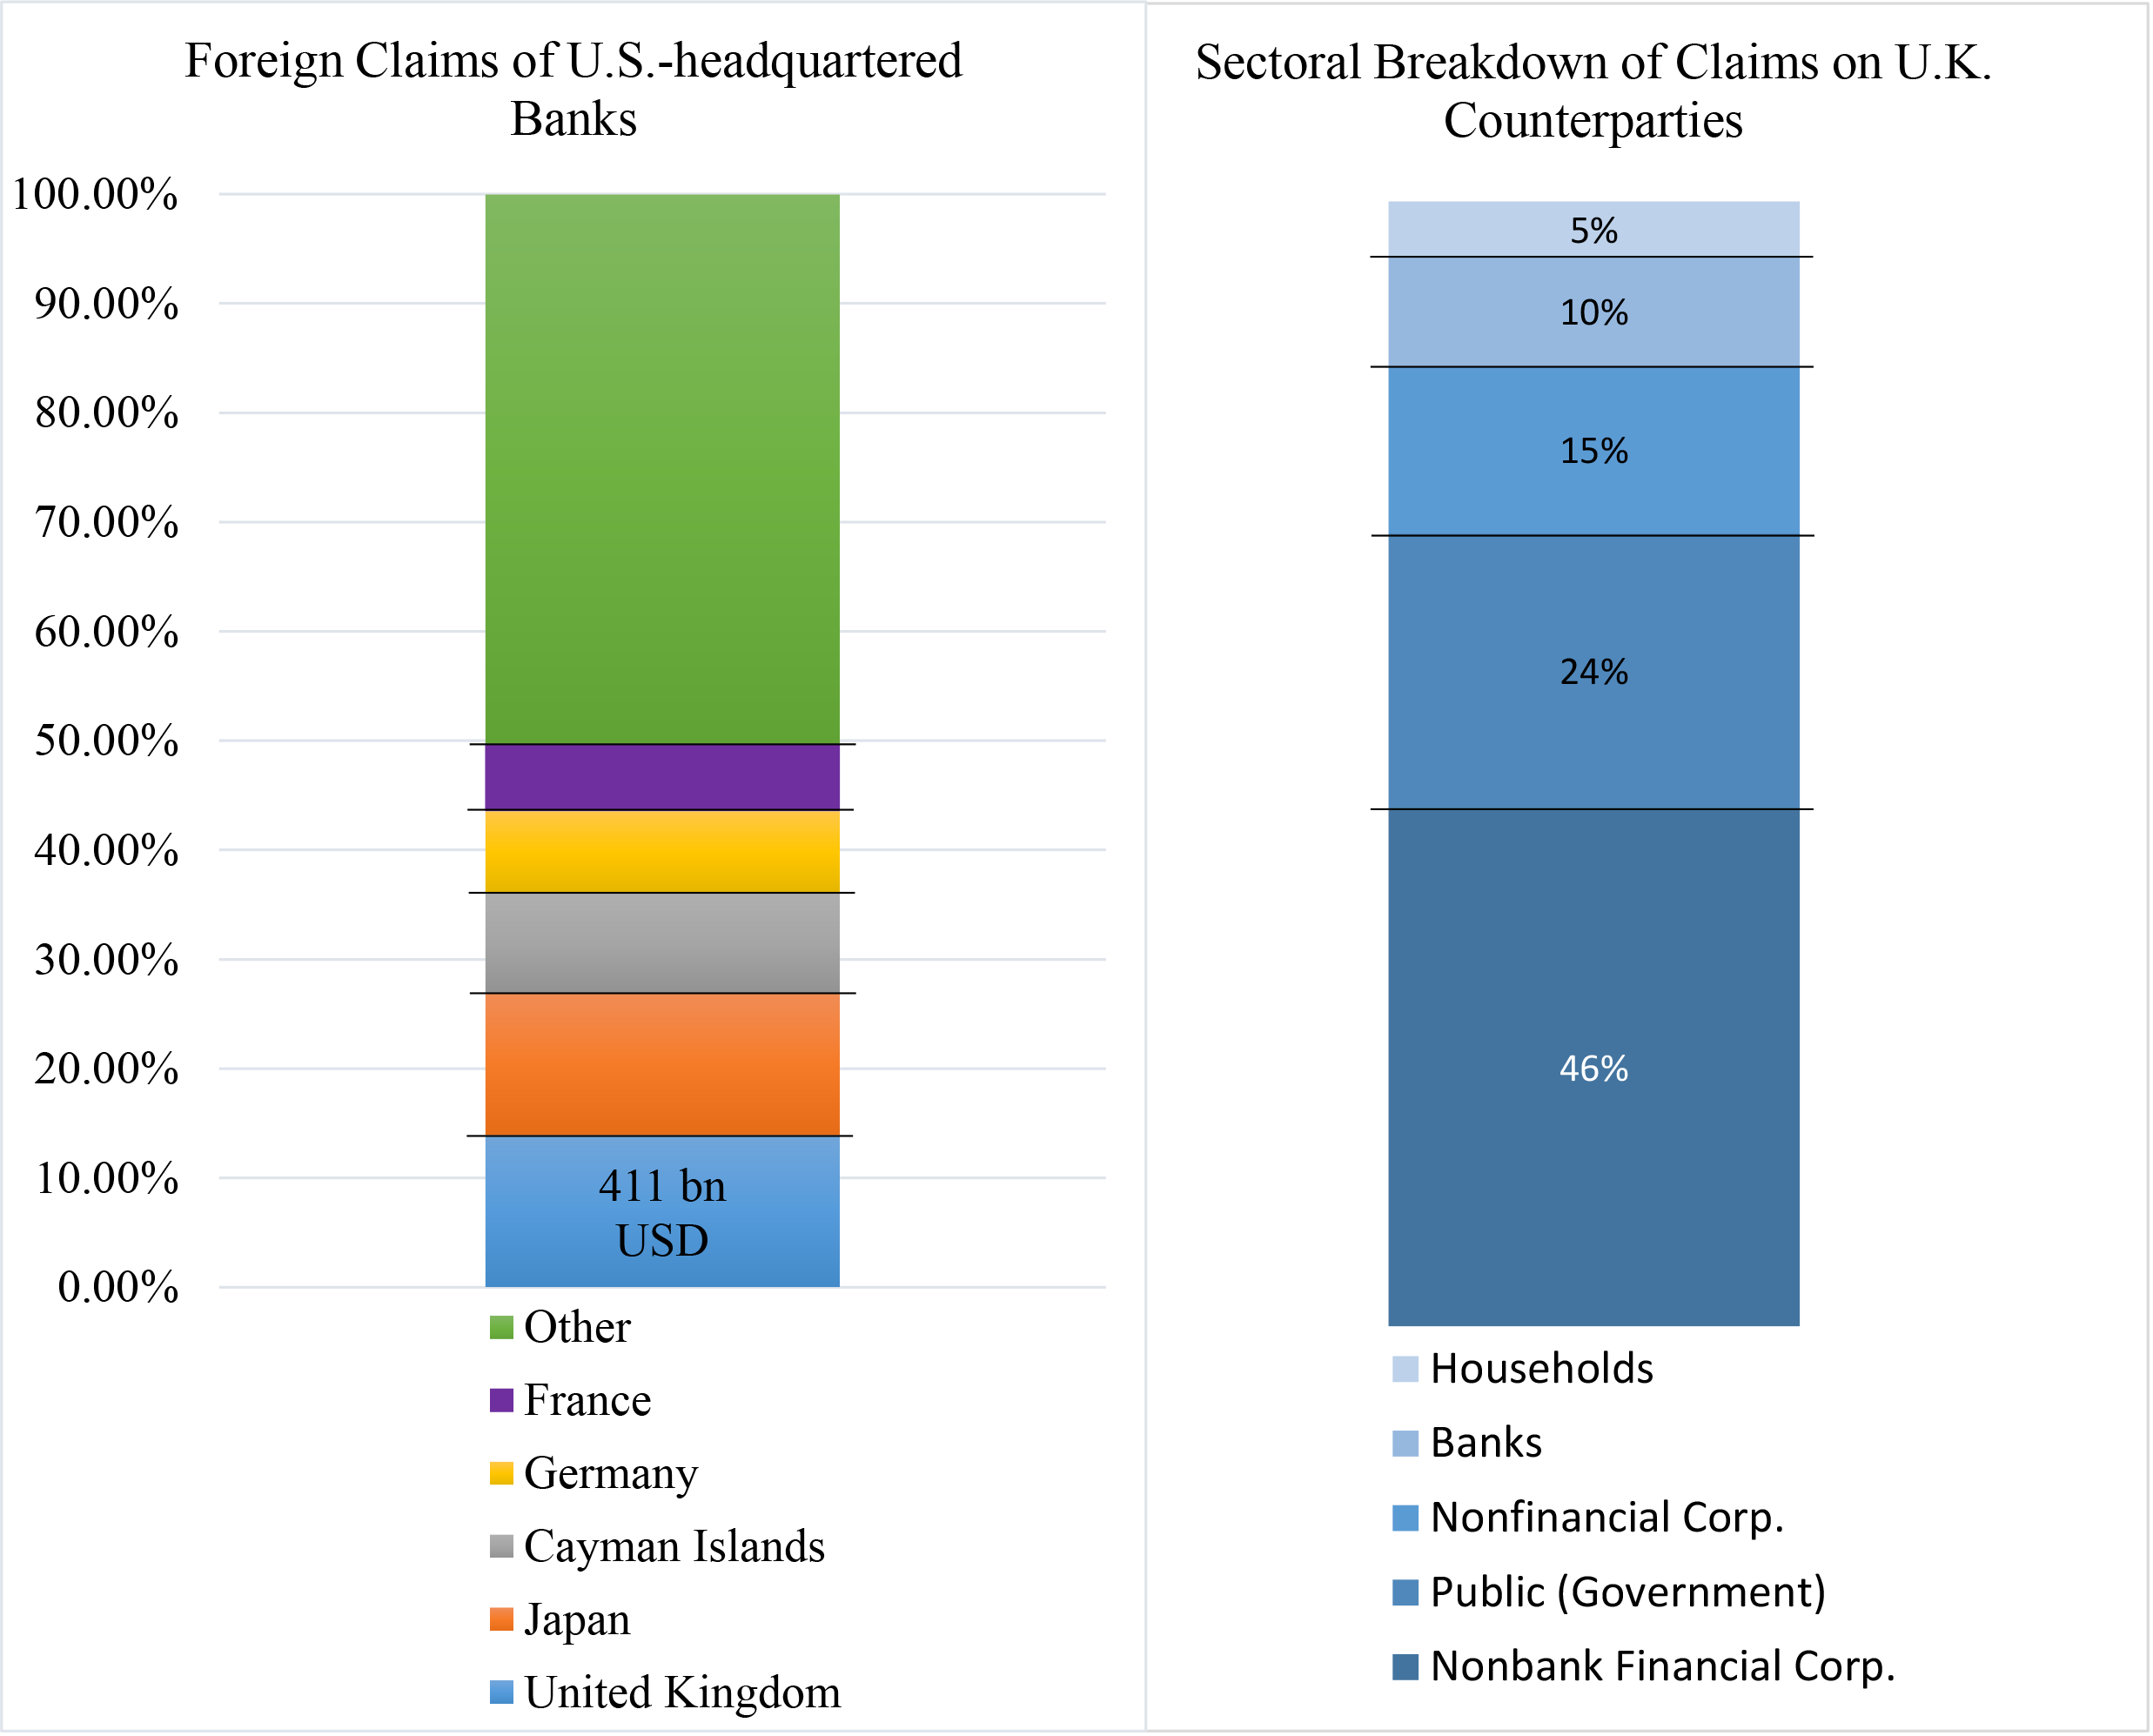
Notes: Data as of 2016:Q4. Source: FFIEC 009, staff calculations.
Key describes bar segments in order from top to bottom.
Estimating the cost of Brexit: Data and preliminary evidence
Because of the breadth and complexity of U.S. banks' U.K. operations, Brexit will likely affect the banks through a variety of channels, with implications for banks' geographic and legal organization, their business opportunities, and cost efficiencies. Estimating the cost of Brexit for U.S. banks is a difficult task given the uncertainty about the terms and will obviously be most accurate once the exact terms of Brexit are known. However, stock market data allow us to gauge investors' assessment of the expected cost of Brexit under the assumptions highlighted earlier. We combine changes in U.S. bank stock prices—which many consider to be a sufficient statistic for changes in a bank's future profitability—with data on the odds of Brexit derived from betting markets, a proxy for investors' assessment of the probability of a vote for Brexit. Specifically, we estimate the elasticity of bank stock prices to changes in the odds of Brexit and then infer equity investors' assessment of the expected cost of Brexit from the estimated elasticity.
Admittedly, the betting markets were wrong about the Brexit vote, but market participants' beliefs were likely aligned with betting markets. These markets correctly predicted the outcome of the 2014 Scottish independence referendum and vastly outperformed polls then, which added to their credibility. Betting markets are seen as superior to polls because, among other reasons, these markets ask participants to assess the probability of an outcome rather than simply their preferred outcome, and betting market participants internalize the polling data when placing their bets.
Illustrating developments from early 2016 to the declaration of the referendum results, figure 2 plots the betting odds of Brexit (left scale) and the U.S. bank stock price index (right scale) over this period. Betting markets gave a vote for Brexit roughly between an 18 percent to 37 percent chance of succeeding in the month leading up to the vote. Also, there appears to be a negative correlation between the betting odds of a vote for Brexit and stock prices of U.S. banks, a link that forms the basis of our empirical analysis.
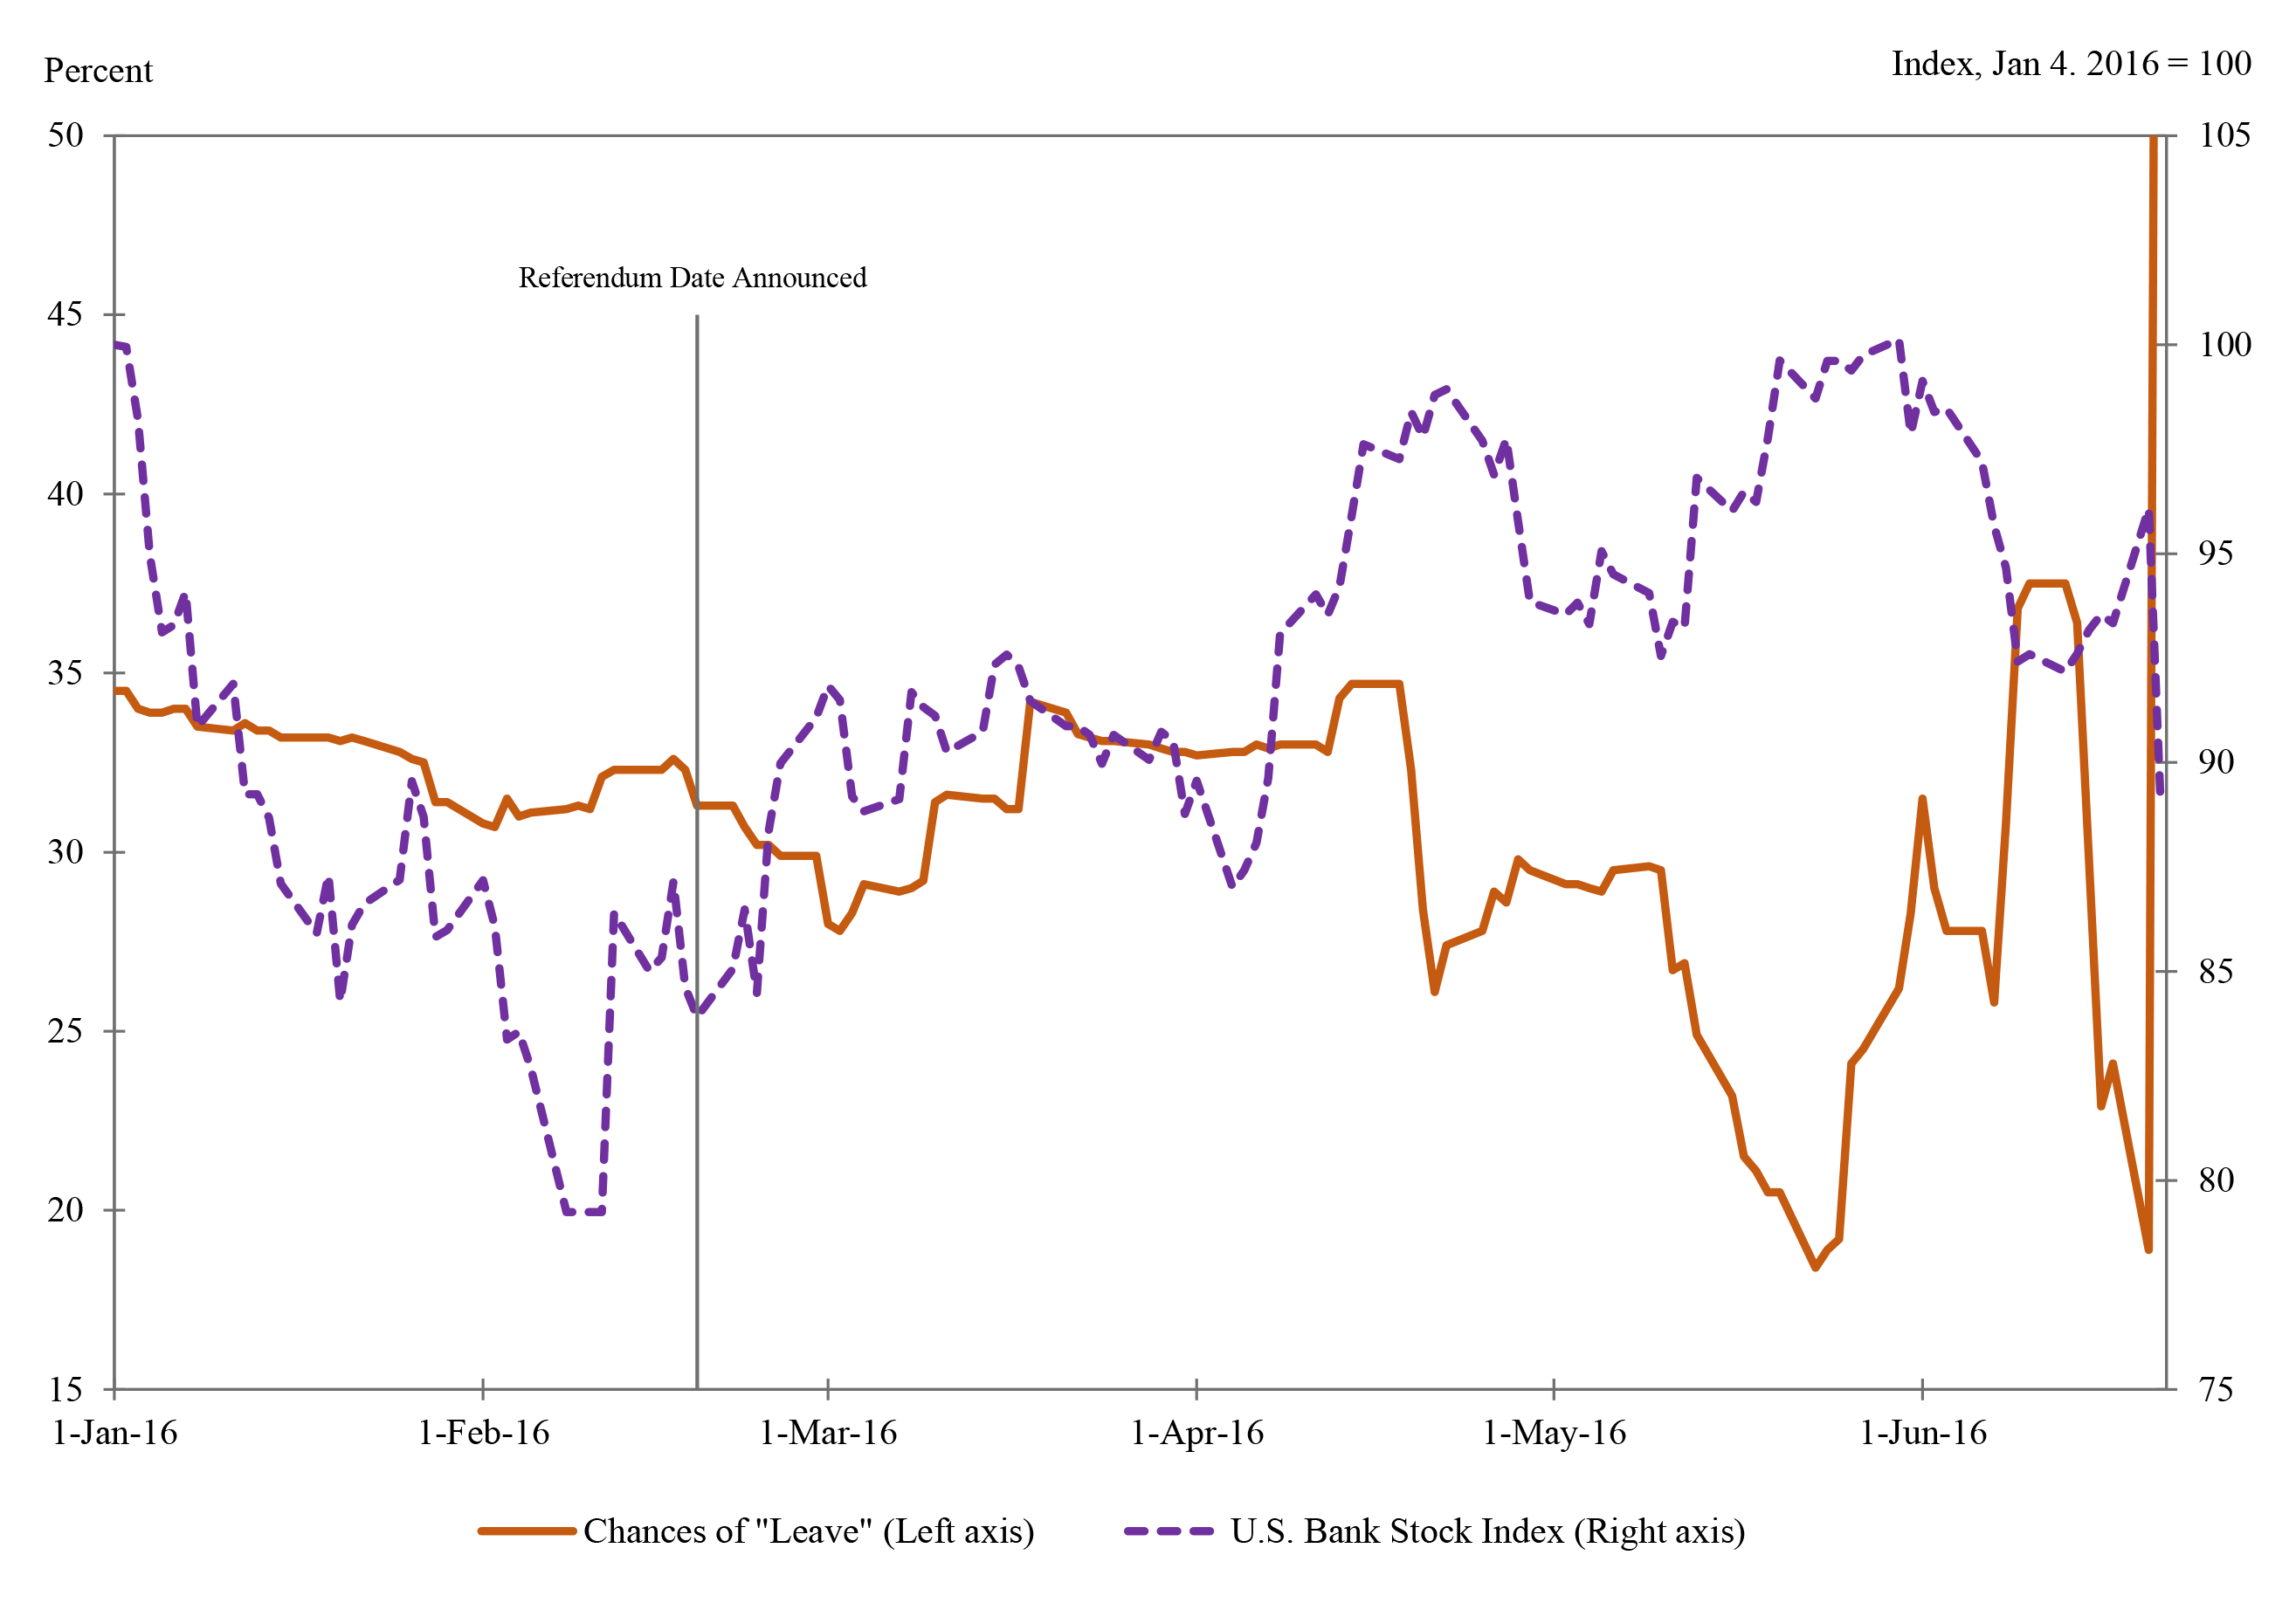
Notes: The "Leave" series represents the average implied probability of Brexit based on bookmaker quotes available on Oddschecker. The U.S. Bank Stock Index includes 24 banking companies weighted by capitalization and is produced by KBW. Source: Oddschecker, Google Finance.
Another way to visualize the correlation between stock price changes and changes in the Brexit odds is shown in figure 3. The figure plots the average stock price of U.S. banks on days when the Brexit odds increased versus days when the Brexit odds decreased, normalizing the stock price on the day before to one. Note that U.S. banks are split into two groups, according to the size of their claims on U.K. residents. One group consists of banks with above-median U.K. exposures, while the other consists of U.S. banks with below-median U.K. exposures.3 The figure shows, first, that U.S. bank stock prices decreased (increased) on days when the odds of Brexit increased (decreased). Second, banks with larger U.K. exposures, indicated by the blue bars, were slightly more responsive to changes in the Brexit odds than banks with smaller U.K. exposures, represented by the orange bars. Thus investors assessed Brexit to negatively affect U.S. banks' future profitability with somewhat larger effects for banks with more extensive U.K. exposures.4 To quantify by how much investors expected U.S. bank profits to fall as a result of Brexit, we use regression analysis, relying on techniques frequently used in the academic finance literature.
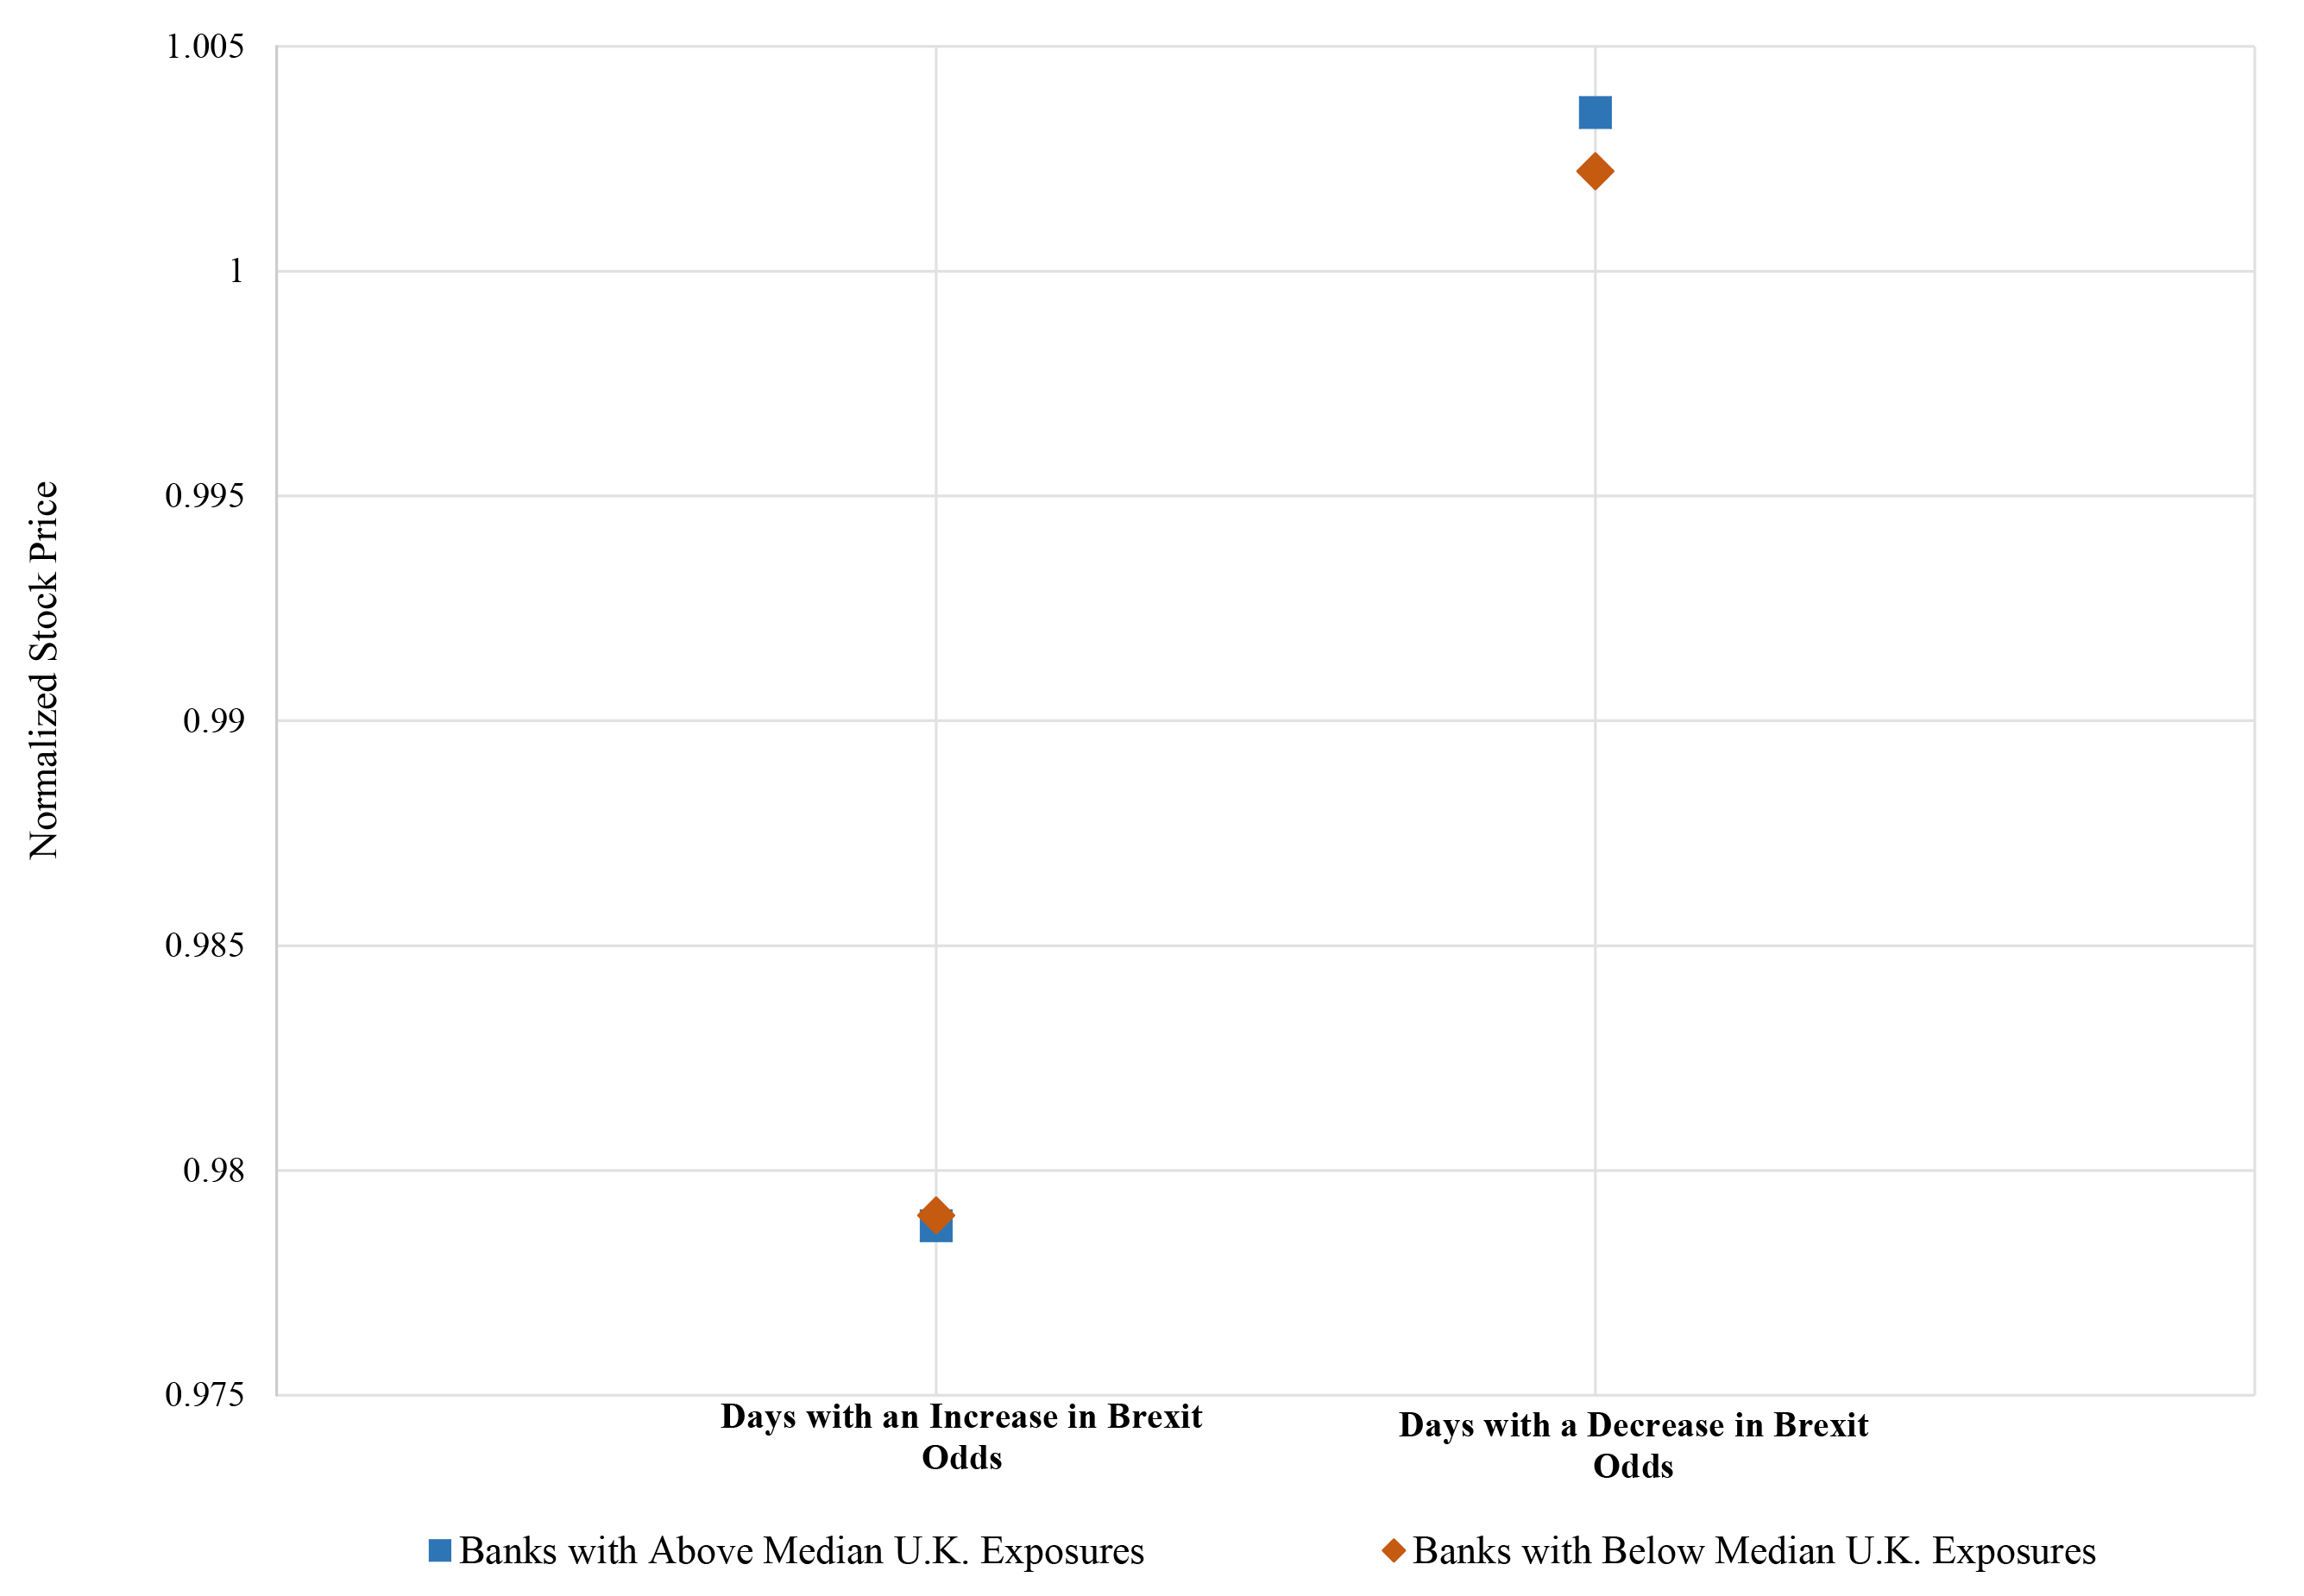
Source: Bloomberg, FFIEC 009, staff calculations.
Estimating the cost of Brexit: Formal methodology
We estimate the elasticity of U.S. bank stock prices to changes in the betting odds. The elasticity provides the percentage change in U.S. bank stock prices given a certain change in the odds of Brexit. This elasticity can then be used to obtain an estimate of the expected cost to large U.S. banks from Brexit, as perceived by equity investors.
We start by estimating the following regression equation:
where $$\Delta stock price_{bt}$$ is the excess return of bank b's stock from day t-1 to t, and $$\Delta Brexit odds_{t}$$ is the change in the Brexit odds from day t-1 to t. Excess returns reflect bank stock price changes that cannot be explained by the stock's typical co-movement with the S&P 500 index. To control for a bank-specific time trend, we include bank-fixed effects.
Because we expect banks with larger U.K. operations to be more affected, we allow for differences in the elasticity across banks with differently sized U.K. exposures by including an interaction term between changes in the Brexit odds and different proxies for the significance of a bank's U.K. operations. This second regression equation is as follows:
Our sample covers 22 U.S. bank holding companies and large commercial banks over the period from mid-May 2015 to late June 2016 and has 4,298 observations. When the interaction term between changes in the odds of Brexit and a bank's U.K. operations is included in the regression, the sample shrinks to 18 banks and 3,658 observations due to data availability.5
Estimating the cost of Brexit: Results
The regression results indicate that a 10 percentage point increase in the Brexit odds led to a change in stock returns in the range of negative 0.3 basis points to negative 0.54 basis points, with larger declines for banks with more extensive U.K. operations (for details on the regression results, see the appendix).6 Based on these regression results, we can estimate the markets-implied cost of Brexit to banks in our sample. Brexit represented an increase of the odds from 0 to 100 percent and implied an estimated decline in banks' stock prices by 3.6 percentage points based on the regression results without the interaction term. To obtain the estimated dollar decline in profits that market participants attributed to Brexit, we take 3.6 percent of the stock market capitalization of the 18 large U.S. banks in our sample at the referendum date. The result is an estimated $43 billion decline in market value due to the belief of market participants that banks will have lower profitability because of Brexit. Taking into account differences in the effect across banks with varying U.K. operations, the estimated markets-implied decline in profits from Brexit for U.S. banks increases to roughly $46 billion. This amount is economically significant and corresponds to 38 percent of the banks' 2016 net income, although any decline in profits would not occur all in a single year, but would be spread over many years.
Conclusion
We use data on stock prices and betting market odds of Brexit for the period leading to and including the vote to estimate the magnitude of the markets-implied costs of Brexit for U.S. banks. These markets-implied costs appear to lie in the $35 billion to $52 billion range.7 The methodology and the estimate itself are subject to significant limitations. For example, the estimate is based only on the information set that participants in the equity and betting markets had at the time of the vote. How close this estimate will be to the actual cost to U.S. banks heavily depends upon the outcome of the Brexit negotiations and the resilience of the U.K. economy.
Appendix: Regression results
| baseline (1) | U.K. exp share, total (2) | U.K. exp share, xborder (3) | U.K. exp share, local (4) | share U.K. entities (5) | share U.K. subs (6) | share U.K. branches (7) | log # U.K. entities (8) | log # U.K. subs (9) | log # U.K. branches (10) | |
|---|---|---|---|---|---|---|---|---|---|---|
| $$\Delta$$ Brexit odds | -0.0362*** (0.00267) |
-0.0299*** (0.00579) |
-0.0386*** (0.00523) |
-0.0308*** (0.00561) |
-0.0416*** (0.00665) |
-0.0433*** (0.00642) |
-0.0392*** (0.00519) |
-0.0184* (0.0102) |
-0.0178* (0.00973) |
-0.0347*** (0.00649) |
| U.K. operations | 0.00628 (0.0459) |
0.00502 (0.00667) |
-0.0126 (0.0451) |
-0.00790 (0.0113) |
-0.00608 -0.00831 |
-0.0340 (0.0950) |
0.00145 (0.00476) |
0.00110 (0.00448) |
||
| $$\Delta$$ Brexit odds table1 U.K.. Operations | -0.274** (0.111) |
0.0113 (0.0134) |
-0.244** (0.113) |
0.0294 (0.0217) |
0.0291* (0.0168) |
0.0277 (0.0277) |
-0.00555** (0.00272) |
-0.00591** (0.00264) |
-0.00165 (0.00889) |
|
| Observations | 4,474 | 3,658 | 3,658 | 3,658 | 3,637 | 3,229 | 3,637 | 2,638 | 2,638 | 1,829 |
| R-squared | 0.023 | 0.029 | 0.028 | 0.029 | 0.029 | 0.031 | 0.029 | 0.030 | 0.030 | 0.032 |
Note: This table shows the regression results from estimating the elasticity of U.S. banks' stock price changes to changes in the Brexit odds. The dependent variable reflects U.S. banks' excess returns computed as the residual from a regression of stock price changes on the S&P 500 index from 5/13/15 to 12/21/2015. Standard errors are robust in all columns and clustered by time in column (1). Bank-fixed effects are included but not reported. Columns (2) to (10) include interactions between the change in the Brexit odds and different measures of U.S. banks' U.K. operations. The following measures are used. Column (2): a bank's share of U.K. exposures in its total exposures (U.S. + foreign exposures). Column (3): a bank's share of cross-border exposures in the U.K. in total exposures. Column (4): a bank's share of local exposures (through branches and subsidiaries) in the U.K. in total exposures. Column (5): a bank's share of U.K. entities in total foreign entities. Column (6): a bank's share of UK subsidiaries in total foreign subsidiaries. Column (7): a bank's share of UK branches in total foreign branches. Column (8): the log number of a bank's U.K. entities. Column (9): the log number of a bank's U.K. subsidiaries. Column (10): the log number of a bank's U.K. branches.
1. Nicholas Coleman is a Senior Economist and Friederike Niepmann a Principal Economist in the Global Financial Institutions section in the Division of International Finance at the Federal Reserve Board. Stefan Walz is a Master student at Colombia University and former Research Analyst in the Global Financial Institutions section in the Division of International Finance at the Federal Reserve Board. Return to text
2. Information on the organizational structure of U.S. banks is from the National Information Center. Return to text
3. The sample of banks included in figure 3 differs slightly from that included in the stock price index in figure 2. Return to text
4. The regression analysis shows that differences in the response to changes in the betting odds across U.S. banks with different sizes of U.K. operations are statistically significant (see appendix table). Return to text
5. This reduction is because our preferred measure of a bank's U.K. operations, the share of its U.K. exposures to its total exposures, is not available for all banks. Return to text
6. This range follows from the estimates in column 2 of the appendix table together with the banks' U.K. exposures. Return to text
7. The $35 billion to $52 billion range follows from the 5 percent confidence interval around the point estimate of -0.0362. Return to text
Coleman, Nicholas, Friederike Niepmann, and Stefan Walz (2018). "What Equity Markets Said About Brexit-Related Costs to U.S. Banks," IFDP Notes. Washington: Board of Governors of the Federal Reserve System, February 2018, https://doi.org/10.17016/2573-2129.41.
Disclaimer: IFDP Notes are articles in which Board economists offer their own views and present analysis on a range of topics in economics and finance. These articles are shorter and less technically oriented than IFDP Working Papers.