November 12, 2015
The Transmission of Exchange Rate Changes to Output and Inflation
Vice Chairman Stanley Fischer
At the "Monetary Policy Implementation and Transmission in the Post-Crisis Period," a research conference sponsored by the Board of Governors of the Federal Reserve System, Washington, D.C.
Good evening. My discussion tonight will focus on a key transmission channel in an open economy--the exchange rate.1 The exchange rate is a primary focus of central bankers in small open economies as well as a prime concern of the broader public in those economies--and, to a lesser extent, in even the largest of economies. When I was governor of the Bank of Israel prior to joining the Federal Reserve, my markets screen was continuously open at a chart of the exchange rate of the shekel against the dollar. For small open economies, the exchange rate may well matter as much for output and inflation as do interest rates.2
Given that the U.S. economy is much less open than Israel's, it is not surprising that fluctuations in the dollar typically receive somewhat less attention here in the United States. Indeed, much of the focus on dollar fluctuations in the recent research literature is on transmission to foreign economies, including through balance sheet channels, as in the Bank for International Settlements paper (Hofmann, Shim, and Shin, forthcoming) that will be presented tomorrow. Nevertheless, the exchange value of the dollar also plays a significant role in the U.S. economy, a role that has increased over time given growing global trade and financial linkages. My remarks will focus on the consequences of the dollar's ascent since last summer for U.S. output and inflation--and thus for monetary policy.
Size of Dollar's Appreciation and Its Causes
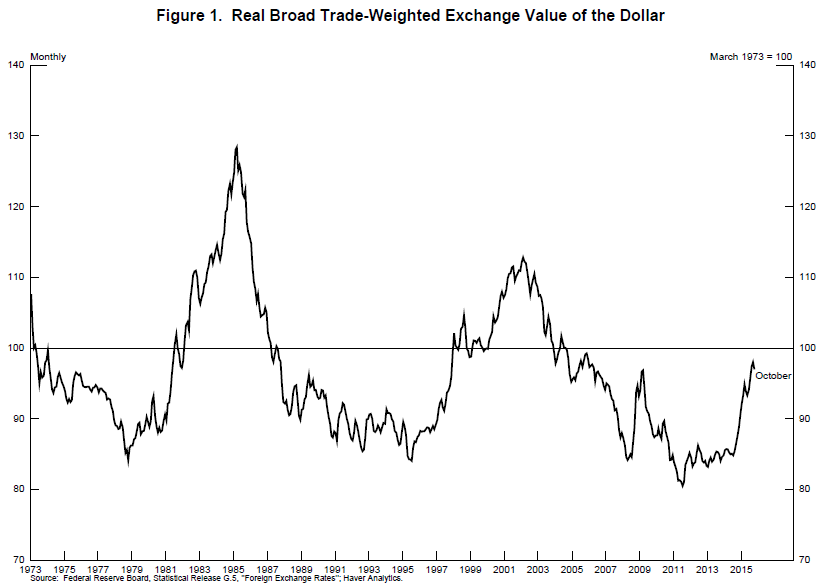
As seen in figure 1, the roughly 15 percent appreciation of the broad real dollar since July 2014 is large, though not unprecedented by historical standards.3 Two related factors appear to have played key roles in the dollar's rise. First, while the U.S. economy has performed relatively well--as is visible especially in our steady progress toward full employment--major foreign economies have generally experienced weak growth, along with persistently low inflation. Because foreign central banks responded appropriately by providing additional monetary accommodation, foreign interest rates have declined relative to U.S. interest rates, encouraging investors to shift into dollar-denominated assets and in turn boosting the dollar. But widening interest rate differentials can explain only part of the dollar's large ascent. A second factor has been heightened concern about the global outlook and an associated decrease in investor risk tolerance--factors that tend to increase investment in dollar assets. In recent months, investors have been particularly focused on the possibility of a sharp slowdown in China and other emerging market economies, with commodity exporters seen as particularly vulnerable in the wake of the dramatic drop in oil and non-oil commodity prices since the summer of 2014.
Effects of a Stronger Dollar on U.S. Activity and Inflation
In considering the transmission of changes in the dollar's value to U.S. output and inflation, it will be convenient for illustrative purposes to focus on the effects of a 10 percent appreciation that is assumed to be permanent--and then to draw on this analysis to provide some guidance on how the dollar's rise since mid-2014 has played out.
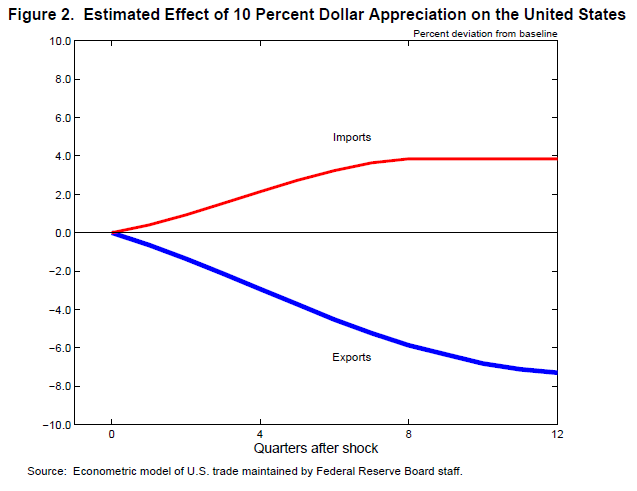
Because the main way in which a stronger dollar affects U.S. output is through causing real exports to decline, I will begin by focusing on the factors determining the export response. Broadly speaking, an appreciation of the dollar reduces U.S. exports because it causes the relative price of U.S. goods to rise in foreign markets; for example, the price in yen of a U.S.-made pair of jeans will rise. To gauge the quantitative effects on exports, the thick blue line in figure 2 shows the response of U.S. real exports to a 10 percent dollar appreciation that is derived from a large econometric model of U.S. trade maintained by the Federal Reserve Board staff.4 Real exports fall about 3 percent after a year and more than 7 percent after three years.5 The gradual response of exports reflects that it takes some time for households and firms in foreign countries to substitute away from the now more expensive U.S.-made goods.
A stronger dollar makes foreign goods cheaper for U.S. consumers and hence boosts U.S. real imports. Nevertheless, an extensive literature has found that the degree of pass-through of exchange rate changes to U.S. import prices is low, as foreign exporters prefer to keep the dollar price of the goods they sell in the U.S. market relatively constant. For example, a typical estimate is that an appreciation of the dollar of 10 percent causes U.S. non-oil import prices to fall only about 3 percent after a year and only slightly more thereafter.6 The low exchange rate pass-through helps account for the more modest estimated response of U.S. real imports to a 10 percent exchange rate appreciation shown by the thin red line in figure 2, which indicates that real imports rise only about 3-3/4 percent after three years.7
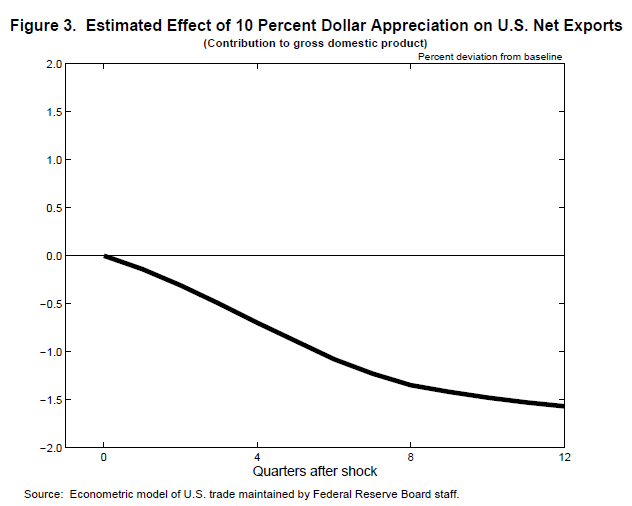
Figure 3 uses these results to gauge how a 10 percent dollar appreciation would reduce U.S. gross domestic product (GDP) through the net export channels we have just discussed. The staff's model indicates that the direct effects on GDP through net exports are large, with GDP falling over 1-1/2 percent below baseline after three years. Moreover, the effects materialize quite gradually, with over half of the adverse effects on GDP occurring at a horizon of more than a year.
In interpreting these estimated effects on GDP, it is important to underscore that the estimates do not take account of any offset due to monetary policy easing--a key consideration that I will discuss shortly. Even so, recalling that the dollar's actual appreciation has been about 15 percent, the model estimates suggest that the cumulative reduction in U.S. aggregate demand from the dollar's appreciation is likely to total almost 2-1/2 percent of GDP after three years--in the absence of policy action to boost private demand or government spending. Given these perhaps surprisingly large effects, an obvious question is, how well has the model done so far in accounting for the actual behavior of U.S. real net exports? While trade flows are affected by many factors that are difficult to capture in models--such as the labor disputes at major ports that occurred earlier this year--the drag from net exports over the past year does appear to be relatively close to the estimated effect implied by the staff's econometric trade model, with net exports reducing GDP by almost 3/4 percentage point in the data, compared with an estimated fall of 1 percentage point in the model.
Looking forward, given that the effects of the stronger dollar play through gradually to the economy, there is good reason to expect that the drag on GDP growth from the stronger dollar will persist well into next year and likely spell continued weakness in the traded-goods-producing sectors of the economy that are especially exposed to the exchange rate. Indeed, the more export-oriented manufacturing sector has already taken a hit during the past year and has experienced weaker growth than the broader economy.
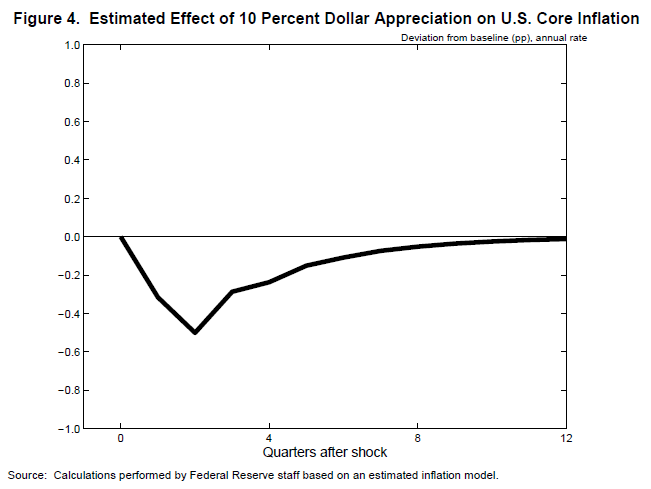
Turning now to inflation, consumer price inflation has been running well below the Federal Reserve's 2 percent target, and the strong dollar has played an appreciable role in this shortfall. One way in which the stronger dollar depresses inflation is by putting downward pressure on import prices. Figure 4 uses an econometric model discussed in a recent speech by Chair Yellen to illustrate how a 10 percent appreciation of the dollar might play through to core personal consumption expenditures (PCE) inflation, which excludes the more volatile food and energy components.8 This particular model implies that core PCE inflation dips about 0.5 percent in the two quarters following the appreciation before gradually returning to baseline, which is consistent with a four-quarter decline in core PCE inflation of about 0.3 percent in the first year following the shock. While the Board staff uses a range of models to gauge the effect of shocks, the model employed in figure 4--as well as other models used by staff--suggests that the dollar's large appreciation will probably depress core PCE inflation between 1/4 and 1/2 percentage point this year through this import price channel. Thus, given that core PCE inflation is running around 1-1/4 percent on a four-quarter-change basis, the stronger dollar has played a material role in holding core PCE inflation below 2 percent.
A second channel through which dollar appreciation reduces inflation is by increasing economic slack. Greater slack amplifies the downward pressure on inflation, although the quantitative effect is probably fairly modest given the flat slope of the Phillips curve. Because the pass-through of dollar appreciation to oil and food commodity prices is much higher than for most imports, dollar appreciation tends to depress overall PCE inflation by even more than it depresses core inflation.
An important difference between the transmission of dollar appreciation to inflation compared with output is that the effects on inflation are probably more transient. In particular, given that most of the effect on inflation occurs through changes in import prices--and import prices respond quickly to the exchange rate--the peak effect on inflation probably occurs within a few quarters. From the standpoint of the outlook, this transience means that some of the forces holding down inflation in 2015--particularly those due to a stronger dollar and lower energy prices--will begin to fade next year. Consequently, overall PCE inflation is likely on this account alone to rebound next year to around 1-1/2 percent. And as long as inflation expectations remain well anchored, both core and overall inflation are likely to rise gradually toward 2 percent over the medium term as the labor market improves further and the transitory effects of declines in energy and import prices dissipate.
U.S. Monetary Policy and the Dollar
The stronger dollar and some of the factors causing it, including weaker foreign demand, have played an important role in accounting for revisions to the expected path of U.S. policy rates compared with what was expected in the summer of last year. The forecasts made by Federal Open Market Committee (FOMC) participants on a quarterly basis, which are published in the Summary of Economic Projections (SEP), provide a good indication of the extent to which forecasts for inflation, output growth, and the federal funds rate have changed since the summer of 2014. The June 2014 SEP showed U.S. GDP growth centered at roughly 3 percent in 2015 and core inflation running around 1-3/4 percent, and the median participant projected that the appropriate level of the federal funds rate at the end of 2015 would be 1-1/4 percent before rising to 2-1/2 percent at the end of 2016.9 But in the most recent SEP following the September 2015 FOMC meeting, the median participant saw GDP growth at only 2 percent this year, core inflation at 1-1/2 percent, and the federal funds rate below 1/2 percent at the end of 2015 before rising to only 1-1/2 percent at the end of 2016.10
This greater degree of monetary accommodation seems appropriate given the adverse effects on U.S. aggregate demand coming from the rise in the dollar, an associated weakening of foreign economic prospects, and other developments that have restrained spending and kept inflation undesirably low. Monetary policy easing helps through "crowding in" domestic demand, which in turn helps boost price inflation and makes it less likely that inflation expectations drift below our 2 percent target.
The Board staff's general-equilibrium models that take explicit account of the ability of monetary policy to crowd in domestic demand--including the staff's FRB/US and multicountry SIGMA models--suggest that monetary policy easing can substantially mitigate the effects of adverse shocks on GDP, including from the recent run-up in the dollar. In the case of the dollar shock considered previously, these models suggest that the all-in effects of the stronger dollar on GDP are only about one-half to two-thirds as large as implied by the trade model that abstracts from a monetary policy response--still substantial, to be sure, but much less significant for the economy than if monetary policy failed to play an active role.
Conclusion
To wrap up, while the dollar's appreciation and foreign weakness have been a sizable shock, the U.S. economy appears to be weathering them reasonably well, notwithstanding their large effects on certain sectors of the economy heavily exposed to international trade. Monetary policy has played a key role in achieving these outcomes through deferring liftoff relative to what was expected a little over a year ago. The October 2015 FOMC statement indicated that it may be appropriate to raise the target range for the federal funds rate at the next meeting in December, though the outcome will depend on the Committee's assessment of the progress--realized and expected--that has been made toward meeting our goals of maximum employment and price stability.11 Of course, as policymakers, we must always be vigilant to events unfolding differently than we expect, and we must be ready to react accordingly.
References
Board of Governors of the Federal Reserve System (2014). "Minutes of the Federal Open Market Committee, June 17-18, 2014," press release, July 9.
-------- (2015a). "Federal Reserve Issues FOMC Statement," press release, October 28.
-------- (2015b). "Minutes of the Federal Open Market Committee, September 16-17, 2015," press release, October 8.
Bussière, Matthieu, Simona Delle Chiaie, and Tuomas A. Peltonen (2014). "Exchange Rate Pass-Through in the Global Economy: The Role of Emerging Market Economies," IMF Economic Review, vol. 62 (1), pp. 146-78.
Gopinath, Gita (2015). "The International Price System," NBER Working Paper Series 21646. Cambridge, Mass.: National Bureau of Economic Research, October.
Hofmann, Boris, Ilhyock Shim, and Hyun Song Shin (forthcoming). "The Risk Taking Channel of Currency Appreciation," BIS Working Paper.
Loretan, Mico (2005). "Indexes of the Foreign Exchange Value of the Dollar (PDF)," Federal Reserve Bulletin, vol. 91 (Winter), pp. 1-8.
Yellen, Janet L. (2015). "Inflation Dynamics and Monetary Policy," speech delivered at the Philip Gamble Memorial Lecture, University of Massachusetts, Amherst, Mass., September 24.
1. The views expressed here are my own and not necessarily those of others at the Board, on the Federal Open Market Committee, or in the Federal Reserve System. I am grateful to Christopher Erceg, Joseph Gruber, and Deborah Lindner for their contributions to this speech and to William English and David Skidmore for comments. Return to text
2. At times, starting in the 1990s, several central banks--most prominently, the Bank of Canada--have used a monetary conditions index, generally a weighted average of changes in a short-term interest rate and a multilateral exchange rate from some baseline, as a policy indicator. Return to text
3. The broad dollar is a weighted average of the foreign exchange value of the U.S. dollar against the currencies of a broad group of major U.S. trading partners. More information on the construction of the index can be found in Loretan (2005). Return to text
4. The results presented here are taken from the staff's U.S. International Transactions (USIT) model of the U.S. external sector. A forthcoming article in the Federal Reserve Board's International Finance Discussion Papers, or IFDP, Notes series will provide further detail on the structure and estimation of the trade block of the USIT model that is used in these computations. Return to text
5. It may be useful to note that exports in 2014 amounted to about 13-1/2 percent of GDP and imports to 16-1/2 percent of gross domestic product. Return to text
6. These estimates are consistent with recent analysis by Gopinath (2015) and Bussière, Delle Chiaie, and Peltonen (2014). Return to text
7. In the staff's trade model, imports are specified to depend on GDP in addition to the exchange rate. The estimates shown in figure 2 simply show the effects arising through the latter channel. Similarly for exports, the staff's model also controls for changes in a trade-weighted aggregate of foreign GDP, with the estimates in figure 2 showing only the effects from a change in the value of the dollar. Return to text
8. This econometric model is described in the appendix to Yellen (2015). Return to text
9. The SEP is an addendum to the FOMC minutes. For the June 2014 SEP, see Board of Governors (2014). Return to text
10. The September 2015 SEP is available in Board of Governors (2015b). Return to text
11. For the October 2015 FOMC statement, see Board of Governors (2015a). Return to text