November 29, 2016
Recent Economic Developments and Longer-Run Challenges
At the The Economic Club of Indiana, Indianapolis, Indiana
Thank you for the opportunity to speak here today. My plan is to discuss the U.S. economy from three different perspectives. I will start by taking stock of the current expansion--a business cycle point of view. Then I will shift the focus to some of the longer-term challenges we face in coming years. I will conclude with a discussion of monetary policy. As always, the views I express here today are mine alone.
The Current State of the Economy
As you know, the Congress has tasked the Federal Reserve with achieving stable prices and maximum employment--the dual mandate. Today, we are not far from achieving those goals.
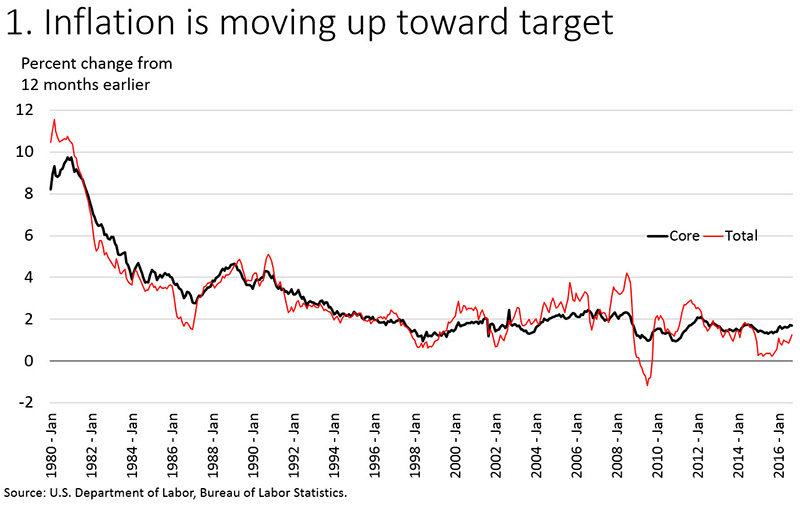
The Federal Open Market Committee (FOMC) has an objective of 2 percent for inflation, as measured by the annual change in the price index for personal consumption expenditures. The Committee sees this objective as symmetrical, so that minor deviations above or below 2 percent are treated alike.1 Inflation has consistently run below 2 percent since 2011, and is now at 1.2 percent over the past 12 months (figure 1). This headline measure of inflation has recently been held down by falling energy and food prices. We also monitor core inflation, which excludes the volatile energy and food components because they often send a misleading signal about underlying inflation pressures. Core inflation is running at 1.7 percent over the past 12 months. Both measures have gradually moved upward toward 2 percent.
U.S. inflation trended steadily lower after the Volcker disinflation of 1981 to 1982 and has been low and reasonably stable for many years. In fact, for the past several years inflation has run below policy targets in many parts of the world, including here in the United States. Many of us are old enough to remember when the only challenge was to keep inflation low. But too-low inflation can also be a serious problem. Below-target inflation increases the real value of debts owed by households and businesses and reduces the ability of central banks to respond to downturns.
The public's expectations about inflation are thought to be an important driver of actual inflation. Many measures of U.S. inflation expectations--both from surveys and from market-based readings--are still well below their pre-crisis levels, although some have moved up as of late. The only way to ensure that inflation expectations remain safely anchored near the FOMC's target is to keep inflation close to that target on a consistent basis. So, while the current shortfall may seem small, it is important that inflation continue to move up to 2 percent, as I expect it will.
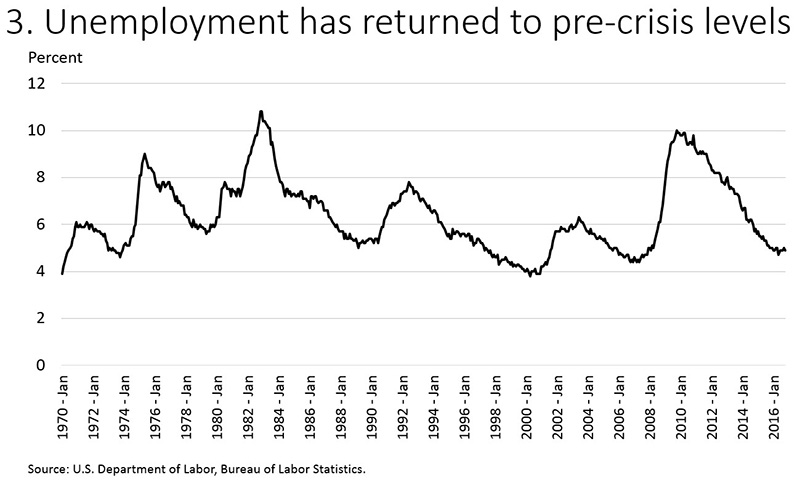
The FOMC does not have a numerical goal for maximum employment because the long-run sustainable level of employment changes over time and is determined mainly by nonmonetary factors that are outside the Fed's control, such as evolving labor market practices, demographics, social change, and fiscal and regulatory policies. Nonetheless, four times each year FOMC participants write down their estimates of the longer-run normal level of the unemployment rate (the natural rate); at the September FOMC meeting the median estimate was 4.8 percent, very close to the current unemployment rate of 4.9 percent.
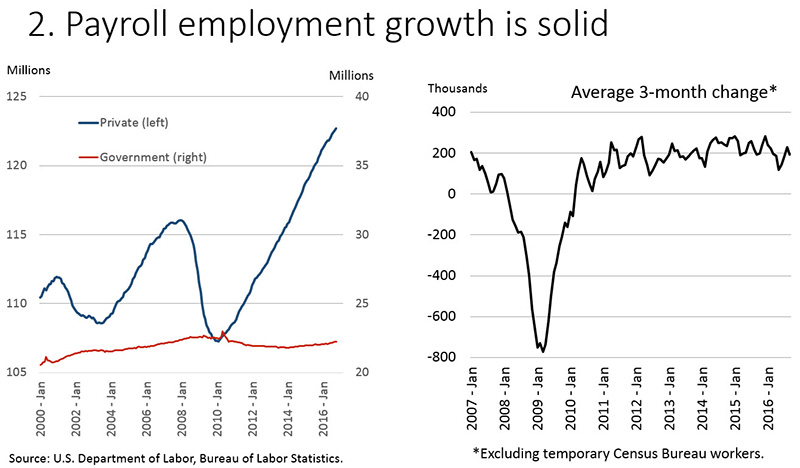
Other labor market measures are also healthy, including payroll job creation and labor force participation. Employers have been adding roughly 180,000 jobs per month so far this year--a pace a little below that of the past several years but significantly higher than underlying growth in the labor force (figure 2). Despite these strong job gains, the unemployment rate has flattened out this year after several years of sharp declines, thanks to welcome developments in labor force participation (figure 3).
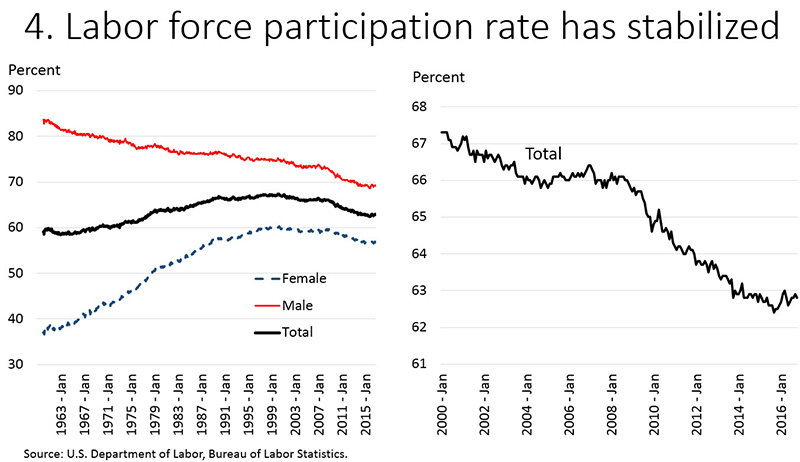
The labor force participation rate represents the percentage of adults aged 16 and over who are in the labor force, which is defined to include only those who are employed or actively looking for work. When people enter or reenter the labor force and begin to search for a job, that is generally a good thing even though at the margin their entry tends to increase the unemployment rate (or prevent it from declining). Beginning in the 1960s, labor force participation rose steadily as women entered the paid workforce (figure 4). That trend ran its course as participation peaked around 2000 and has declined steadily since then as a result of the aging of our population and other longer-run trends, notably the decline in participation by men in the heart of their working-age years. Going forward, many analysts expect labor force participation to decline at a trend rate of roughly 0.3 percent per year as a result of these factors. However, participation fell much more sharply than that after the financial crisis. Some of those who left the labor force went back to school, but others moved onto disability, took early retirement, or just became discouraged and stopped seeking work. The sharp drop raised fears that the crisis might leave behind permanent damage to our labor force. Fortunately, since late 2013, the participation rate has remained about flat and thus has gradually moved back close to its estimated longer-term trend.2 On net, people have been entering and remaining in the labor market as job prospects have brightened, offsetting the natural decline from population aging.
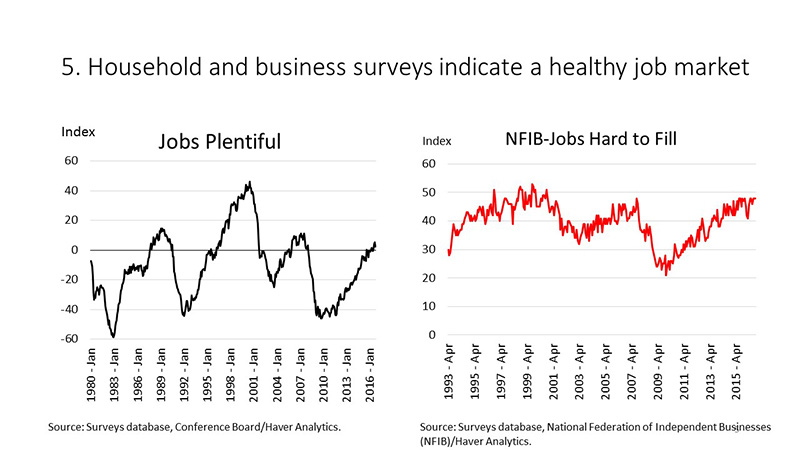
Surveys of households and firms also suggest that we are near full employment (figure 5). For example, respondents are now more likely to say that jobs are plentiful than that they are hard to get--a response that has generally been seen when the economy is near full employment. Job vacancies are running at high levels, and firms report that it is getting harder to find employees to fill open positions. Moreover, wages are now rising faster than inflation, and faster than output per hour. Taken together, labor market indicators show an economy that is on solid footing and close to our mandate of maximum employment.
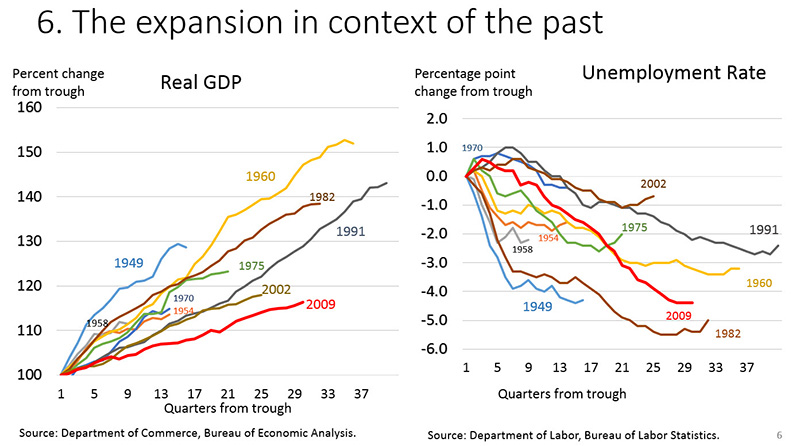
It is interesting to compare this expansion to past U.S. expansions, and also to recoveries of other countries since the end of the Global Financial Crisis. The picture is a mixed one. The current recovery has been under way since June 2009--nearly seven and a half years. It will soon be the third longest of the 20 recoveries since the founding of the Federal Reserve in 1913. GDP, or output, is now 11 percent higher than its pre-crisis peak. Employment is now 6.5 million higher than its pre-crisis peak.
But this expansion has also had the slowest pace of GDP growth of any postwar recovery (figure 6). Given steady but modest growth, we have seen surprisingly large gains in employment and, until this year, a rapid reduction in the unemployment rate. Even though GDP growth has been slow, job gains during this recovery have been stronger than those during the previous expansion--the so-called jobless recovery of the early 2000s. The combination of weak growth and strong hiring in this expansion implies small increases in output per hour, or productivity. In fact, productivity has been increasing at a dismal pace, compared with virtually any period in the postwar era. I will return to productivity and growth in a moment.
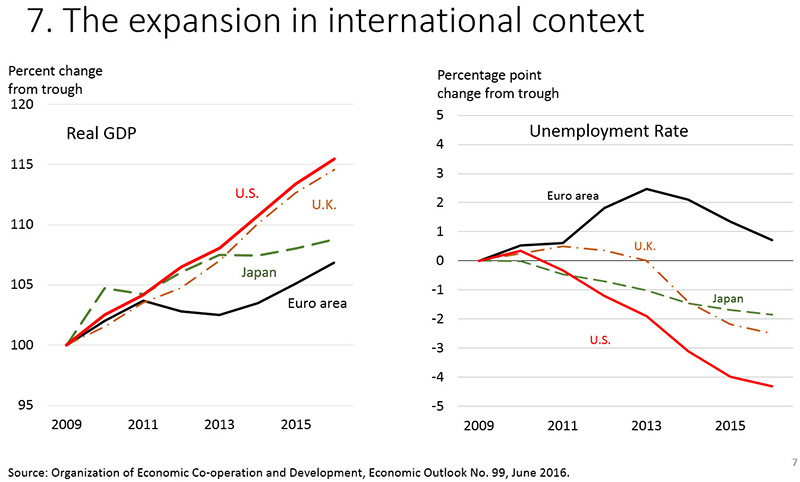
More positively, our current recovery compares fairly well with those of other advanced economies (figure 7). Output has increased faster, and unemployment has declined faster, in the United States than in other major advanced economies. And the Fed's challenges in getting inflation back up to 2 percent are similar to, but not as severe as, those faced by some other major monetary authorities.
Turning to the near-term outlook, after a slow patch in the first half of this year, growth has clearly strengthened. I expect that the economy will continue on its path of the last few years, with real GDP growth of about 2 percent, strong job gains, a tightening labor market, and inflation moving up toward our 2 percent objective. The main risks I see to that outlook are from abroad. Growth and inflation are low around the world. With interest rates so low, we are not well positioned to respond to negative shocks, whatever the source.
Longer-Run Challenges
Productivity and Growth
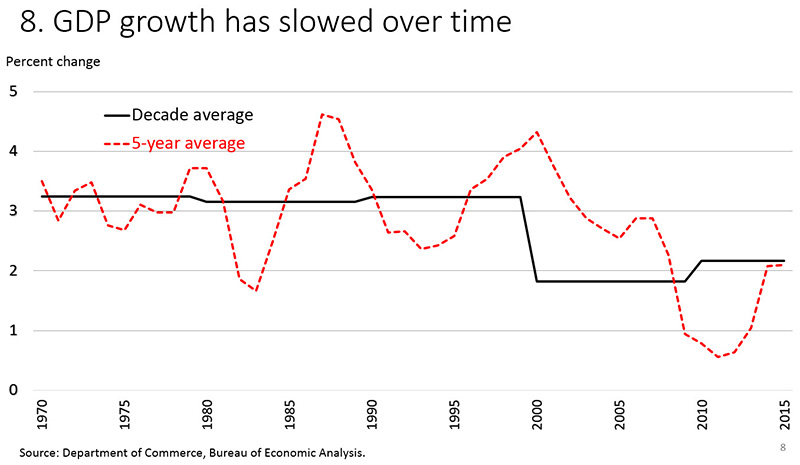
Let's turn to longer-run challenges, and start by asking why growth has been so slow, and how fast we are likely to grow going forward. This next slide shows the five-year trailing average annual real GDP growth rate (figure 8). By this measure, growth averaged about 3.2 percent annually through the 1970s, the 1980s, and the 1990s. But growth began to decline after 2000 and then nose-dived with the onset of the Global Financial Crisis in 2007 and the slow expansion that followed. Since the financial crisis ended in 2009, forecasters have gradually reduced their estimates of long-run trend growth from about 3 percent to about 2 percent--a seemingly small difference that would make a huge difference in living standards over time.3
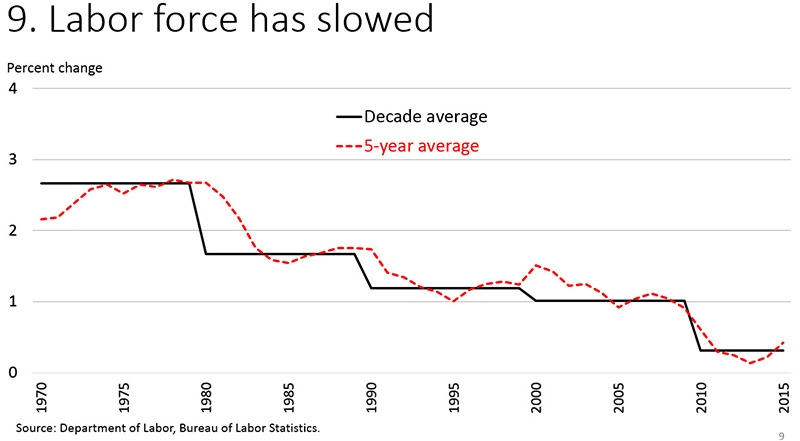
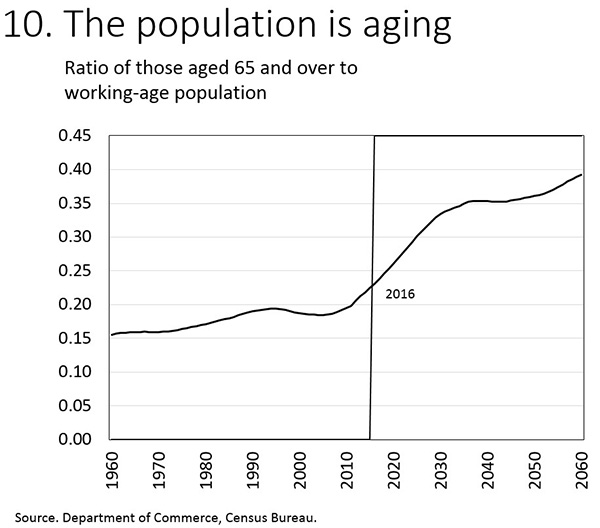
How much of this decline is just a particularly bad business cycle, and how much represents a long-run downshift? To get at that question, let's take a deeper look at the growth slowdown. We can think of economic growth as coming from two sources: more hours worked (labor supply) or higher output per hour (productivity). Hours worked mainly depends on growth in the labor force, which has been slowing since the mid-2000s as the baby-boom generation ages. As you can see, the labor force is now growing at only about 0.5 percent per year (figure 9). Another way to see this is through the sustained increase in the ratio of people over 65 to those who are in their prime working years (figure 10). This long-expected demographic fact has now arrived, and it has challenging implications for our potential growth and also for our fiscal policy.4
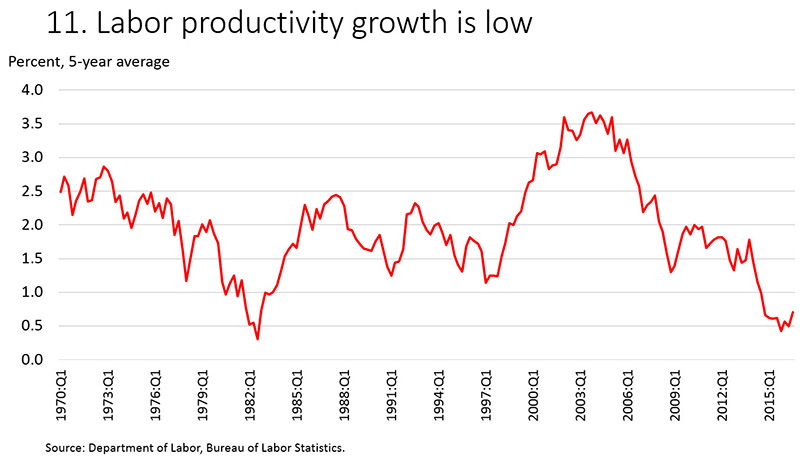
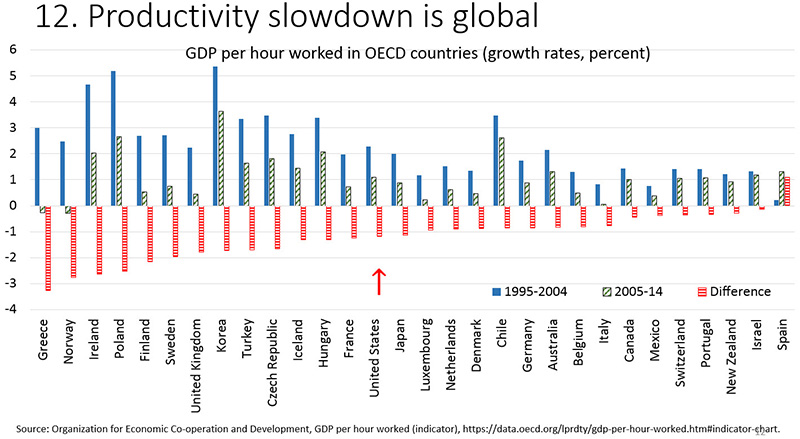
The unexpected part of the growth slowdown reflects weak productivity growth rather than lower labor supply. Labor productivity has increased only 1/2 percent per year since 2010--the smallest five-year rate of increase since World War II and about one-fourth of the average postwar rate (figure 11). The slowdown in productivity has been worldwide and is evident even in countries that were little affected by the crisis (figure 12). Given the global nature of the phenomenon, it is unlikely that U.S.-specific factors are mainly responsible.
A portion of the productivity slowdown is undoubtedly due to low levels of investment by businesses. The financial crisis and the Great Recession left firms with excess capacity, reducing incentives to invest. If businesses expect slower growth to continue, that will also hold down investment.
The other important factor is the decline in what economists call total factor productivity, or TFP, which is the part of productivity that is not explained by capital investment or increases in the skills of the labor force. TFP is thought to be mainly a function of technological innovation and efficiency gains.
There is no consensus about the future direction of productivity.5 The pessimists argue that the big paradigm-changing innovations, such as electrification or the advent of computers, are behind us. If that is so, then our standard of living will increase more slowly going forward. The optimists think that this slowdown is only a passing phase and that the age of robots and machine learning will transform our economy in coming decades. Still others argue that we are currently underestimating productivity and output because of the real difficulties we face in measuring GDP in a modern economy. For example, how do we measure the value-added of free digital services like Facebook or Twitter?6
The future is, as always, uncertain. But I would sum up the growth discussion as follows. Growth in the labor force has slowed, and we can estimate it with reasonable confidence to be only about 0.5 percent. Growth in productivity is both more important and much harder to predict. Productivity varies significantly over time, as figure 11 showed. If productivity growth returns to, say, 1.5 percent, then the U.S. economy could grow at about 2.0 percent over the long term. Actual growth may turn out to be weaker or stronger, and the choices we make as a society will have something to say about that.
Why Are Long-Term Interest Rates So Low?
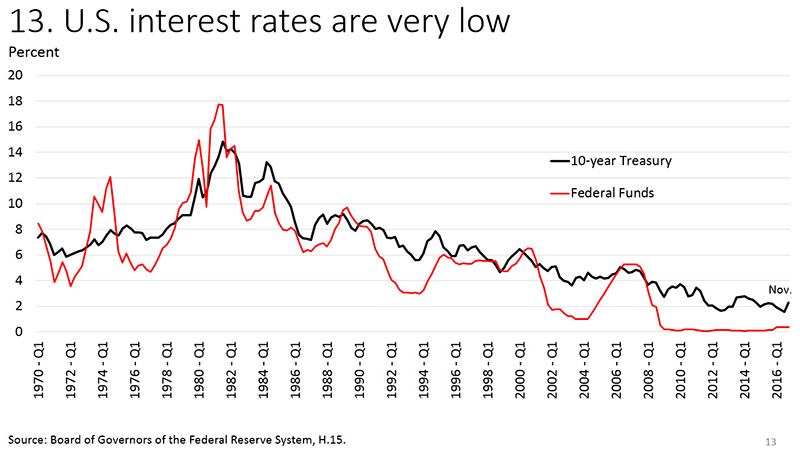
Let's turn to the related question of why long-term interest rates are so extraordinarily low in advanced economies around the world. The yield on our own benchmark 10-year U.S. Treasury security has increased lately, but at 2.3 percent it is still far below what was normal before the financial crisis. In fact, this next chart shows that, as growth and inflation have fallen, longer term interest rates have fallen as well over the past 35 years (figure 13).
So why are long-term interest rates so low? Many of you will no doubt be thinking, "They are low because you people at the Fed set them low!" While there is an element of truth there, that is not the whole story. The FOMC has considerable control over short-term interest rates. We have much less influence over long-term rates, which are set in the marketplace. Long-term interest rates represent the price that balances the supply of saving by lenders and demand for funds by borrowers, such as businesses needing to fund their capital expenditures. Lenders expect to receive a real return and to be compensated for inflation and for the risk of nonpayment. Meanwhile, borrowers adjust their demand for funds based on their changing assessment of the risks and expected returns of their investment projects. When desired saving rises or investment demand falls, then long-term interest rates will decline. Today's very low level of long-term rates suggests that both of these factors are at play.
Both expectations of slower growth and the aging of our population are having significant effects on desired saving and investment and are thus important causes of lower interest rates. If the economy is expanding more slowly, then the level of investment needed to meet demand will be lower. The lower path of growth reduces future income prospects of households, and they will tend to raise their saving. The pending retirement of baby boomers means higher saving, because people tend to save the most in the years just before their retirement. In addition, the lower rate of return on capital owing to lower productivity growth will lead to less investment and lower interest rates.
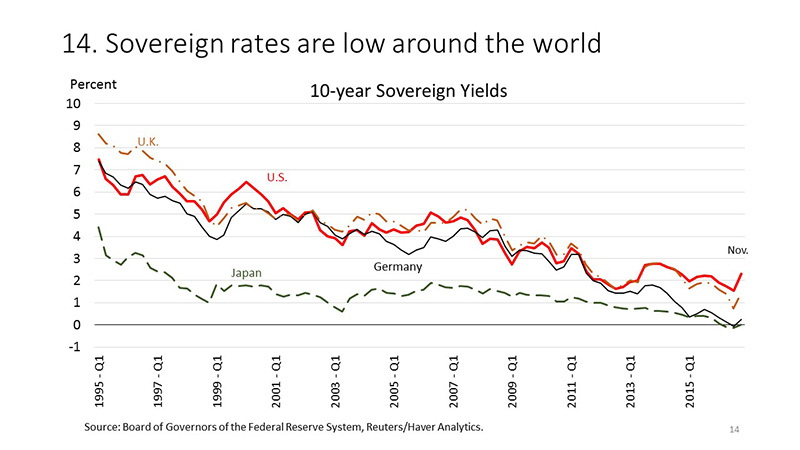
As with productivity, the factors behind the fall in U.S. interest rates include an important global component, as rates are low around the world. Indeed, although our rates are near historical lows, U.S. Treasury rates are among the highest among the major advanced economy sovereigns (figure 14).
Is This the New Normal?
What can we do to prevent low growth, low inflation, and low interest rates from becoming the new normal? We need to focus on ways to increase our long-term growth and spread that prosperity as broadly as possible. I hasten to add that these policies are, for the most part, outside the purview of the Federal Reserve. We need policies that support productivity growth, business hiring and investment, labor force participation, and the development of skills. We need effective fiscal and regulatory policies that inspire public confidence. Increased spending on public infrastructure may raise private-sector productivity over time, particularly with the growth of the stock of public infrastructure near an all-time low.7 Greater support for public and private research and development, and policies that improve product and labor market dynamism may also be fruitful.8 Monetary policy can contribute by supporting a strong and durable expansion in a context of price stability.
Monetary Policy
The low interest rate environment presents special challenges for monetary policy. In setting our target for the federal funds rate, a good place to start is to identify the rate that would prevail if the economy were at 2 percent inflation and full employment--the so-called neutral rate. "Neutral" in this context means that the rate is neither contractionary nor expansionary. If the fed funds rate is lower than the neutral rate, then policy is stimulative or accommodative, which will tend to raise growth and inflation. If the fed funds rate is higher than the neutral rate, then policy is tight and will tend to slow growth and reduce inflation.
But we can only estimate the neutral rate, and those estimates are subject to substantial uncertainty. Before the crisis, the long-run neutral rate was generally thought to be roughly stable at around 4.25 percent. Since the crisis, estimates have steadily declined, and the median estimate by FOMC participants stood at 2.9 percent in September. Many analysts believe that the neutral rate is even lower than that today and will only return to its long-run value over time.9 The low level of the neutral interest rate has several important implications. First, today's low rates are not as stimulative as they seem--consider that, despite historically low rates, inflation has run consistently below target and housing construction remains far below pre-crisis levels. Second, with rates so low, central banks are not well positioned to counteract a renewed bout of weakness. Third, persistently low interest rates can raise financial stability concerns. A long period of very low interest rates could lead to excessive risk-taking and, over time, to unsustainably high asset prices and credit growth. These are risks that we monitor carefully. Higher growth would increase the neutral rate and help address these issues.
Turning to the outlook for monetary policy, incoming data show an economy that is growing at a healthy pace, with solid payroll job gains and inflation gradually moving up to 2 percent. In my view, the case for an increase in the federal funds rate has clearly strengthened since our previous meeting earlier this month. Of course, the path of rates will depend on the path of the economy. With inflation below target, relatively slow growth, and some slack remaining in the economy, the Committee has been patient about raising rates. That patience has paid dividends. But moving too slowly could eventually mean that the Committee would have to tighten policy abruptly to avoid overshooting our goals.
Conclusion
To wrap up, since the end of the Great Recession in 2009, our economy has recovered slowly but steadily. Today, we are reasonably close to achieving full employment and our 2 percent inflation objective. But we face real challenges over the medium and longer terms. Our aging population will mean slower growth, all else held equal. If living standards are to continue to rise, we need policies that will support productivity and allow our dynamic economy to generate widespread gains in prosperity.
1. See the FOMC's "Statement on Longer-Run Goals and Monetary Policy Strategy (PDF)," FOMC, January 26, 2016. Return to text
2. The current participation rate is within the range of estimates cited in Stephanie Aaronson, Tomaz Cajner, Bruce Fallick, Felix Galbis-Reig, Christopher Smith, and William Wascher (2014), "Labor Force Participation: Recent Developments and Future Prospects (PDF) ," Brookings Papers on Economic Activity, Fall, pp. 197-275. Return to text
3. See Jerome H. Powell (2016), "Recent Economic Developments, the Productive Potential of the Economy, and Monetary Policy," speech delivered at the Peterson Institute for International Economics, Washington, D.C., May 26. Return to text
4. Congressional Budget Office (2016), The 2016 Long-Term Budget Outlook (PDF) , (Washington: CBO, July). Return to text
5. On the pessimistic end of the spectrum are analysts such as Robert Gordon, The Rise and Fall of American Growth: The U.S. Standard of Living since the Civil War (Princeton University Press, 2016). Among the optimists are Erik Brynjolfsson and Andrew McAfee, The Second Machine Age: Work, Progress, and Prosperity in a Time of Brilliant Technologies (W. W. Norton & Company, 2014). Return to text
6. See David M. Byrne, John G. Fernald, and Marshall B. Reinsdorf (2016), "Does the United States Have a Productivity Slowdown or Measurement Problem? " Brookings Papers on Economic Activity, March 4. Return to text
7. See, for example, Abdul Abiad, Davide Furceri, and Petia Topalova (2014), "IMF Survey: The Time Is Right for an Infrastructure Push ," World Economic Outlook (Washington: International Monetary Fund, October). Return to text
8. See, for example, International Monetary Fund (2016), "Acting Now, Acting Together ," Fiscal Monitor (Washington: IMF, April); Ryan A. Decker, John Haltiwanger, Ron S. Jarmin, and Javier Miranda (2016), "Declining Business Dynamism: What We Know and the Way Forward ," American Economic Review, vol. 106 (May), pp. 203-07; Steven Davis and John Haltiwanger (2014), "Labor Market Fluidity and Economic Performance," NBER Working Paper Series 20479 (Cambridge, Mass: National Bureau of Economic Research, September); The Department of the Treasury Office of Economic Policy, the Council of Economic Advisers, and the Department of Labor (2015), "Occupational Licensing: A Framework for Policymakers (PDF) " (Washington: The White House, July). Return to text
9. See, for example, Kathryn Holston, Thomas Laubach, and John Williams (2016), "Measuring the Natural Rate of Interest: International Trends and Determinants (PDF) ," Federal Reserve Bank of San Francisco Working Paper 2016-11 (August); Benjamin K. Johannsen and Elmar Mertens (2016), "The Expected Real Interest Rate in the Long Run: Time Series Evidence with the Effective Lower Bound ," FEDS Notes (Washington: Board of Governors of the Federal Reserve System, February 9), http://dx.doi.org/10.17016/2380-7172.1703. Return to text