November 25, 2019
Building on the Gains from the Long Expansion
At the Annual Meeting of the Greater Providence Chamber of Commerce, Providence, Rhode Island
Over the past year, my colleagues and I on the Federal Open Market Committee (FOMC) have been conducting a first-ever public review of how we make monetary policy. As part of that review, we held Fed Listens events around the country where representatives from a wide range of groups have been telling us how the economy is working for them and the people they represent and how the Federal Reserve might better promote the goals Congress has set for us: maximum employment and price stability. We have heard two messages loud and clear. First, as this expansion continues into its 11th year—the longest in U.S. history—economic conditions are generally good. Second, the benefits of the long expansion are only now reaching many communities, and there is plenty of room to build on the impressive gains achieved so far.
These themes show through in many ways in official statistics. For example, more than a decade of steady advances has pushed the jobless rate near a 50-year low, where it has remained for well over a year. But the wealth of middle-income families—savings, home equity, and other assets—has only recently surpassed levels seen before the Great Recession, and the wealth of people with lower incomes, while growing, has yet to fully recover.1
Fortunately, the outlook for further progress is good: Forecasters are generally predicting continued growth, a strong job market, and inflation near 2 percent. Tonight I will begin by discussing the Fed's policy actions over the past year to support the favorable outlook. Then I will turn to two important opportunities for further gains from this expansion: maintaining a stable and reliable pace of 2 percent inflation and spreading the benefits of employment more widely.
Monetary Policy and the Economy in 2019
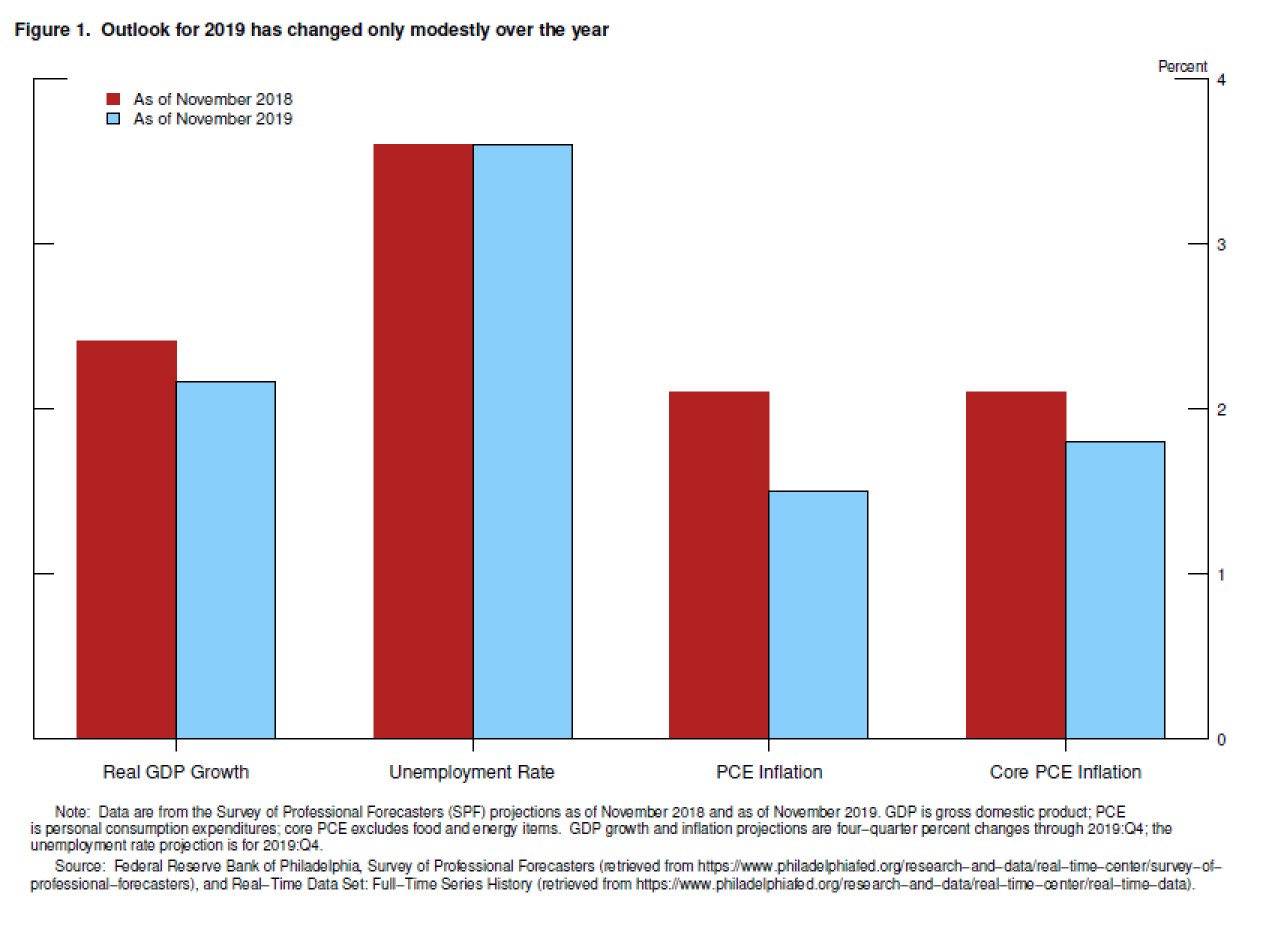
We started 2019 with a favorable outlook, and over the year the outlook has changed only modestly in the eyes of many forecasters (figure 1). For example, in the Survey of Professional Forecasters, the forecast for inflation is a bit lower, but the unemployment forecast is unchanged and the forecast for gross domestic product (GDP) is nearly unchanged.2 The key to the ongoing favorable outlook is household spending, which represents about 70 percent of the economy and continues to be strong, supported by the healthy job market, rising incomes, and solid consumer confidence.
While events of the year have not much changed the outlook, the process of getting from there to here has been far from dull. I will describe how we grappled with incoming information and made important monetary policy changes through the year to help keep the favorable outlook on track.
As the year began, growth appeared robust, but the economy faced some risks flowing mainly from weakening global economic growth and trade developments. Foreign growth, which slipped in the second half of last year, slid further as 2019 progressed. While weaker foreign growth does not necessarily translate into similar weakness here, it does hurt our exporters and presents a risk that the weakness may spread more broadly. At the same time, business contacts around the country have been telling us that trade-related uncertainties are weighing on their decisions. These global developments have been holding back overall economic growth. Manufacturing output, which had only recently surpassed its level before the Great Recession, has declined this year and is again below its pre-recession peak. Business investment has also weakened.
In addition, inflation pressures proved unexpectedly muted this year. After remaining close to our symmetric 2 percent objective for much of last year, inflation is now running below 2 percent. Some of the softness in overall inflation is the result of a fall in oil prices and should not affect inflation going forward. But core inflation—which omits volatile food and energy prices—is also running somewhat below 2 percent.
The main themes of our deliberations this year have been a continuing favorable outlook founded on strength in the household sector, with a few yellow flags including muted inflation and weakness in manufacturing. In addition, global growth and trade have presented ongoing risks and uncertainties. We also faced some less prominent factors that always confront policymakers. Specifically, we never have a crystal clear real-time picture of how the economy is performing. In addition, the precise timing and size of the effects of our policy decisions cannot be known in real time.
In August, the Bureau of Labor Statistics previewed a likely revision to its count of payroll job creation for the 12 months ended March 2019. The preview indicated that job gains over that period were about half a million lower than previously reported. On a monthly basis, job gains were likely about 170,000 per month, rather than 210,000. While this news did not dramatically alter our outlook, it pointed to an economy with somewhat less momentum than we had thought.3
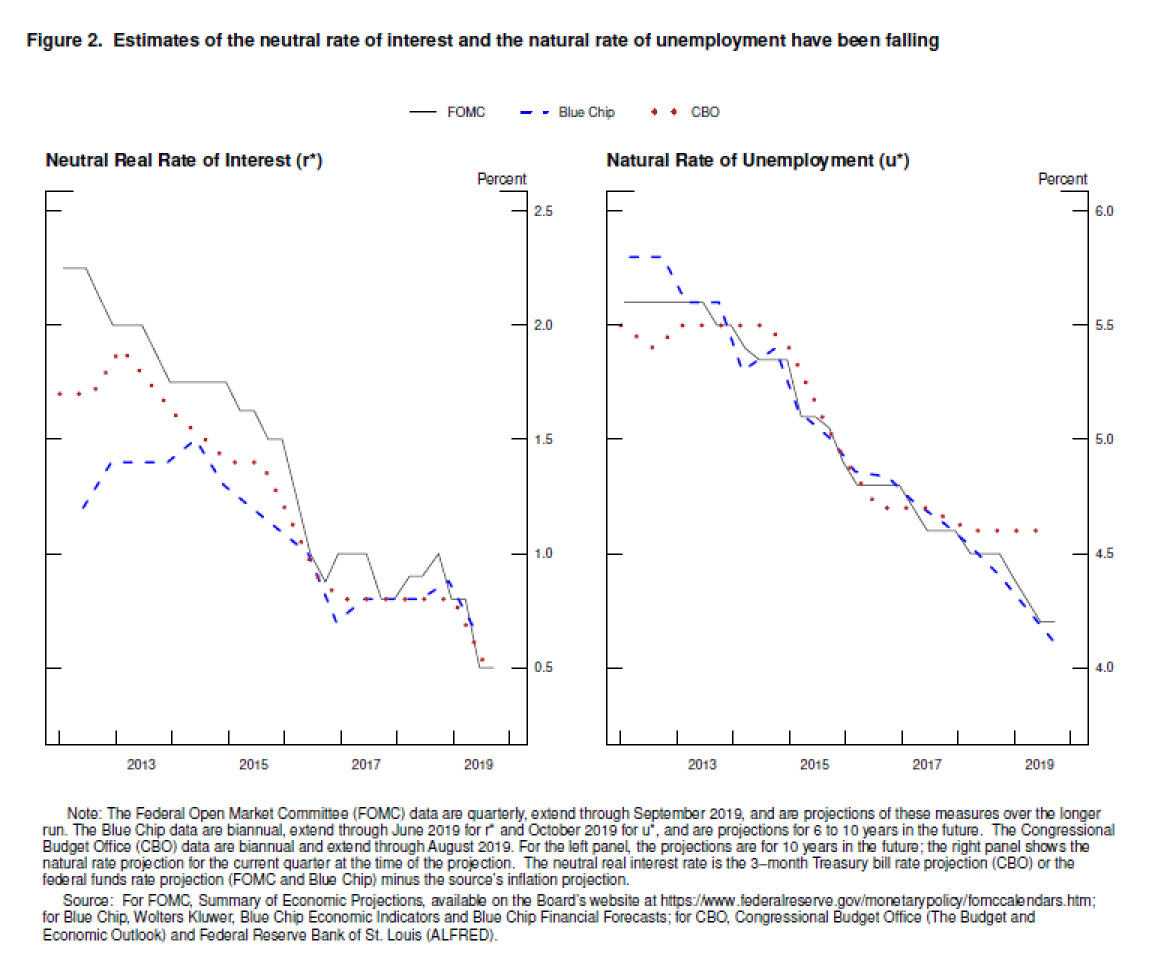
Uncertainty about how our policies are affecting the economy also entered our discussions. As you know, we set our policy interest rate to achieve our goals of maximum employment and stable prices. In doing so, we often refer to certain benchmarks. One of these is the interest rate that would be neutral—neither restraining the economy nor pushing it upward. We call that rate "r*" (pronounced "r star"). A policy rate above r* would tend to restrain economic activity, while a setting below r* would tend to speed up the economy. A second benchmark is the natural rate of unemployment, which is the lowest rate of unemployment that would not create upward pressure on inflation. We call that rate "u*" (pronounced "u star"). You can think of r* and u* as two of the main stars by which we navigate. In an ideal world, policymakers could rely on these stars like mariners before the advent of GPS. But, unlike celestial stars on a clear night, we cannot directly observe these stars, and their values change in ways that are difficult to track in real time. Standard estimates of r* and u* made by policymakers and other analysts have been falling since 2012 (figure 2). Since the end of last year, incoming data—especially muted inflation data—prompted analysts inside and outside the Fed to again revise down their estimates of r* and u*.4 Taken at face value, a lower r* would suggest that monetary policy is providing somewhat less support for employment and inflation than previously believed, and the fall in u* would suggest that the labor market was less tight than believed.5 Both could help explain the weakness in inflation. As with the revised jobs data, these revised estimates of the stars were not a game changer for policy, but they provided another reason why a somewhat lower setting of our policy interest rate might be appropriate.
How did we add up all of these considerations? To help keep the U.S. economy strong in the face of global developments and to provide some insurance against ongoing risks, we progressively eased the stance of monetary policy over the course of the year. First, we signaled that increases in our short-term interest rate were unlikely. Then, from July to October, we reduced the target range for the federal funds rate by 3/4 percentage point. The full effects of these monetary policy actions will be felt over time, but we believe they are already helping to support consumer and business sentiment and boosting spending in interest-sensitive sectors, such as housing and consumer durable goods.
We see the current stance of monetary policy as likely to remain appropriate as long as incoming information about the economy remains broadly consistent with our outlook of moderate economic growth, a strong labor market, and inflation near our symmetric 2 percent objective. Looking ahead, we will be monitoring the effects of our policy actions, along with other information bearing on the outlook, as we assess the appropriate path of the target range for the federal funds rate. Of course, if developments emerge that cause a material reassessment of our outlook, we would respond accordingly. Policy is not on a preset course.
I will wrap up with two areas where we have an opportunity to build on our gains.
A Sustained Return of Inflation to 2 percent
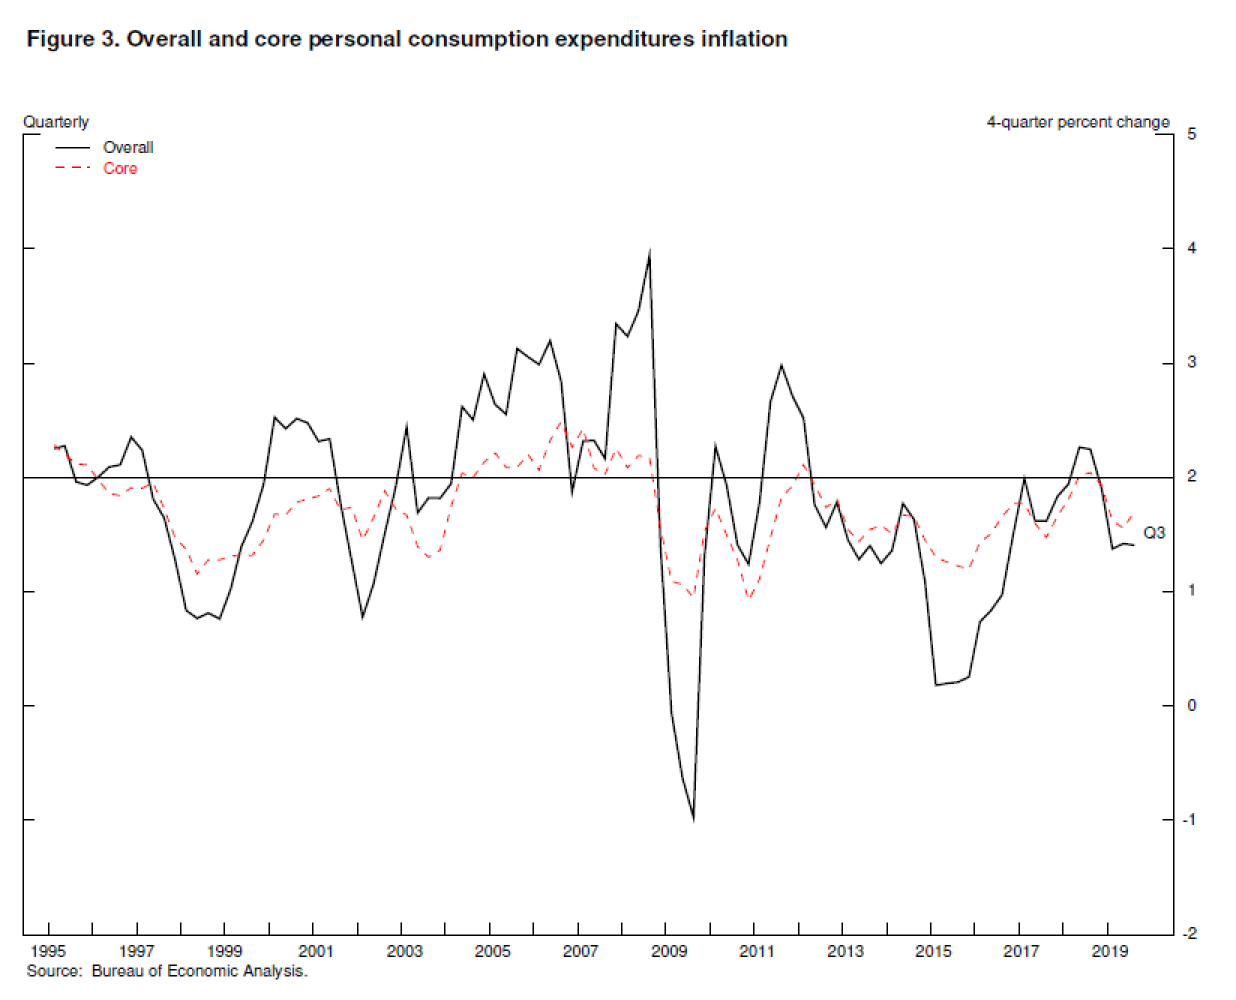
For many years as the economy recovered from the Great Recession, inflation averaged around 1.5 percent—below our 2 percent objective (figure 3). We had long expected that inflation would gradually rise as the expansion continued, and, as I noted, both overall and core inflation ran at rates consistent with our goal for much of 2018. But this year, inflation is again running below 2 percent.
It is reasonable to ask why inflation running somewhat below 2 percent is a big deal. We have heard a lot about inflation at our Fed Listens events. People are concerned about the rising cost of medical care, of housing, and of college, but nobody seems to be complaining about overall inflation running below 2 percent. Even central bankers are not concerned about any particular minor fluctuation in inflation.
Around the world, however, we have seen that inflation running persistently below target can lead to an unhealthy dynamic in which inflation expectations drift down, pulling actual inflation further down. Lower inflation can, in turn, pull interest rates to ever-lower levels. The experience of Japan, and now the euro area, suggests that this dynamic is very difficult to reverse, and once under way, it can make it harder for a central bank to support its economy by further lowering interest rates. That is why it is essential that we at the Fed use our tools to make sure that we do not permit an unhealthy downward drift in inflation expectations and inflation. We are strongly committed to symmetrically and sustainably achieving our 2 percent inflation objective so that in making long-term plans, households and businesses can reasonably expect 2 percent inflation over time.
Spreading the Benefits of Employment
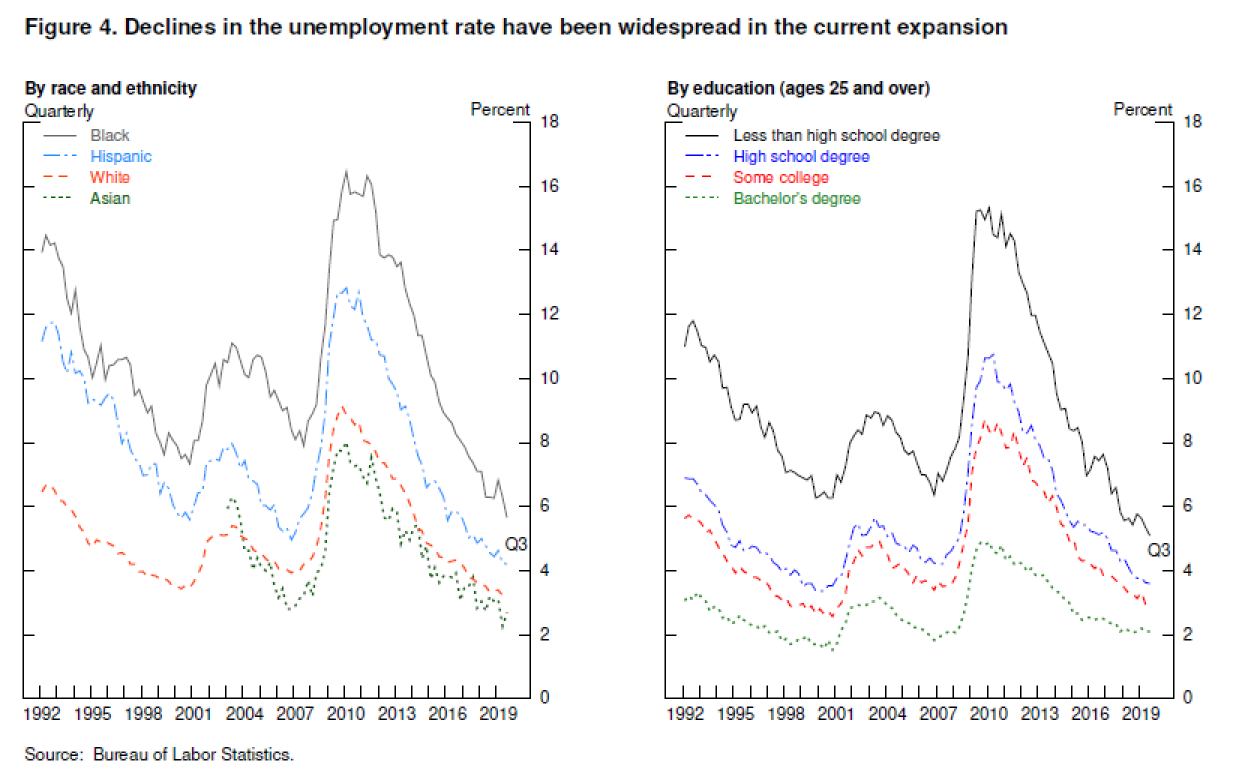
Many people at our Fed Listens events have told us that this long expansion is now benefiting low- and middle-income communities to a degree that has not been felt for many years. We have heard about companies, communities, and schools working together to help employees build skills—and of employers working creatively to structure jobs so that employees can do their jobs while coping with the demands of family and life beyond the workplace. We have heard that many people who in the past struggled to stay in the workforce are now working and adding new and better chapters to their lives. These stories show clearly in the job market data. Employment gains have been broad based across all racial and ethnic groups and all levels of educational attainment as well as among people with disabilities (figure 4).
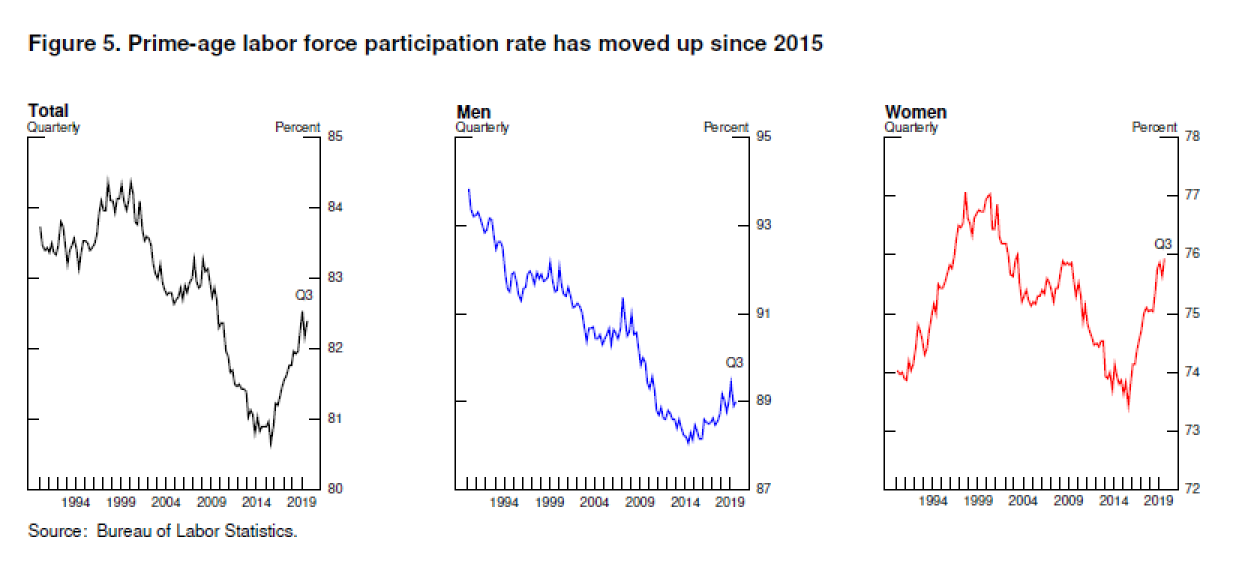
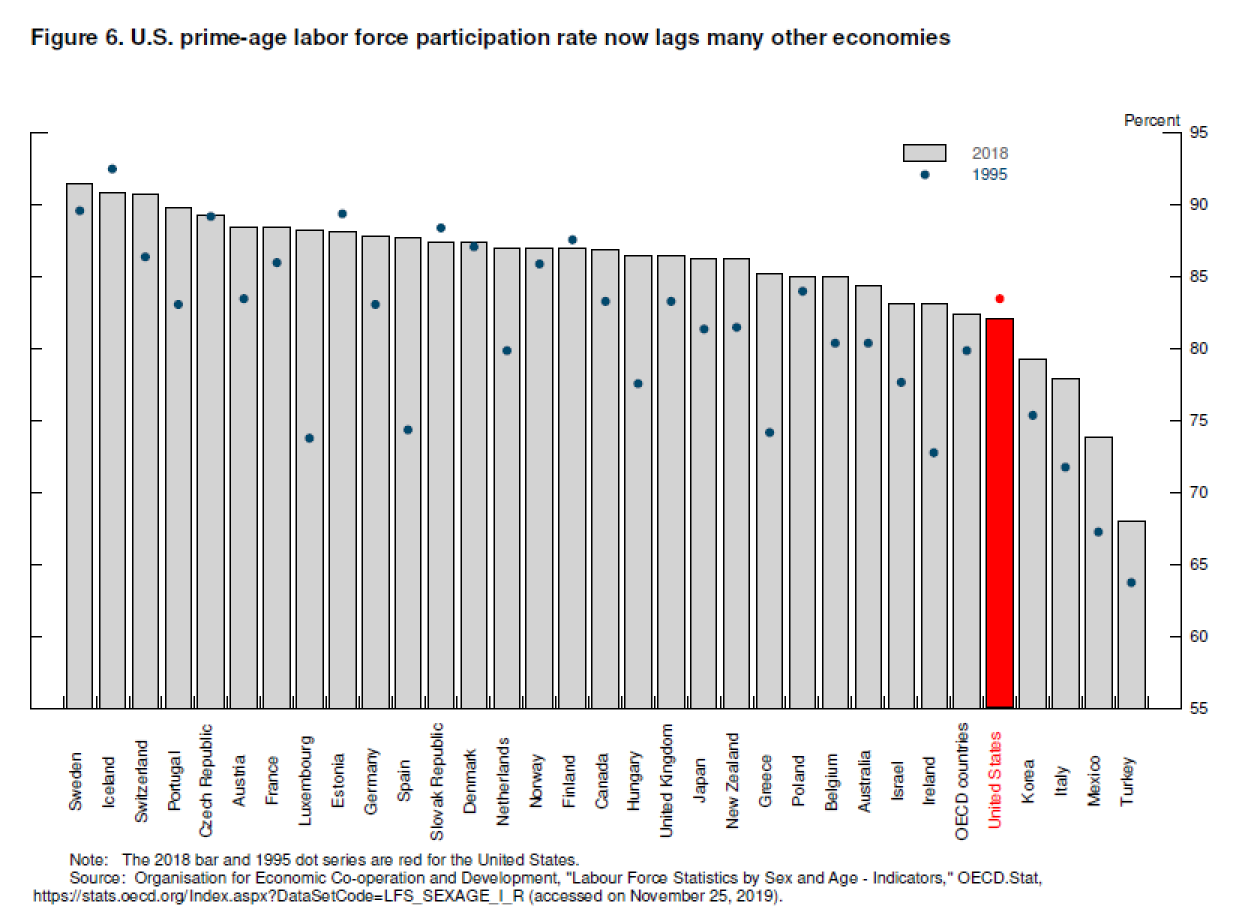
The strong labor market is also encouraging more people in their prime working years—ages 25 to 54—to rejoin or remain in the labor force, meaning that they either have a job or are actively looking for one. This is a welcome development. For several decades up until the mid-1990s, the share of prime-age people in the labor force rose, as an influx of women more than offset some decline in male participation. In the mid-1990s, however, prime-age participation began to fall, and the drop-off became steeper in the Great Recession and the early years of the recovery (figure 5). Between 2007 and 2013, falling participation by both men and women contributed to a 2 percentage point overall decline. Our falling participation rate stands out among advanced economies. While the United States was roughly in the middle of the pack among 32 economies as of 1995, in 2018 we ranked near the bottom (figure 6). Fortunately, in the strong job market since 2014, prime-age participation has been staging a comeback. So far, we have made up more than half the loss in the Great Recession, which translates to almost 2 million more people in the labor force. But prime age participation could be still higher.
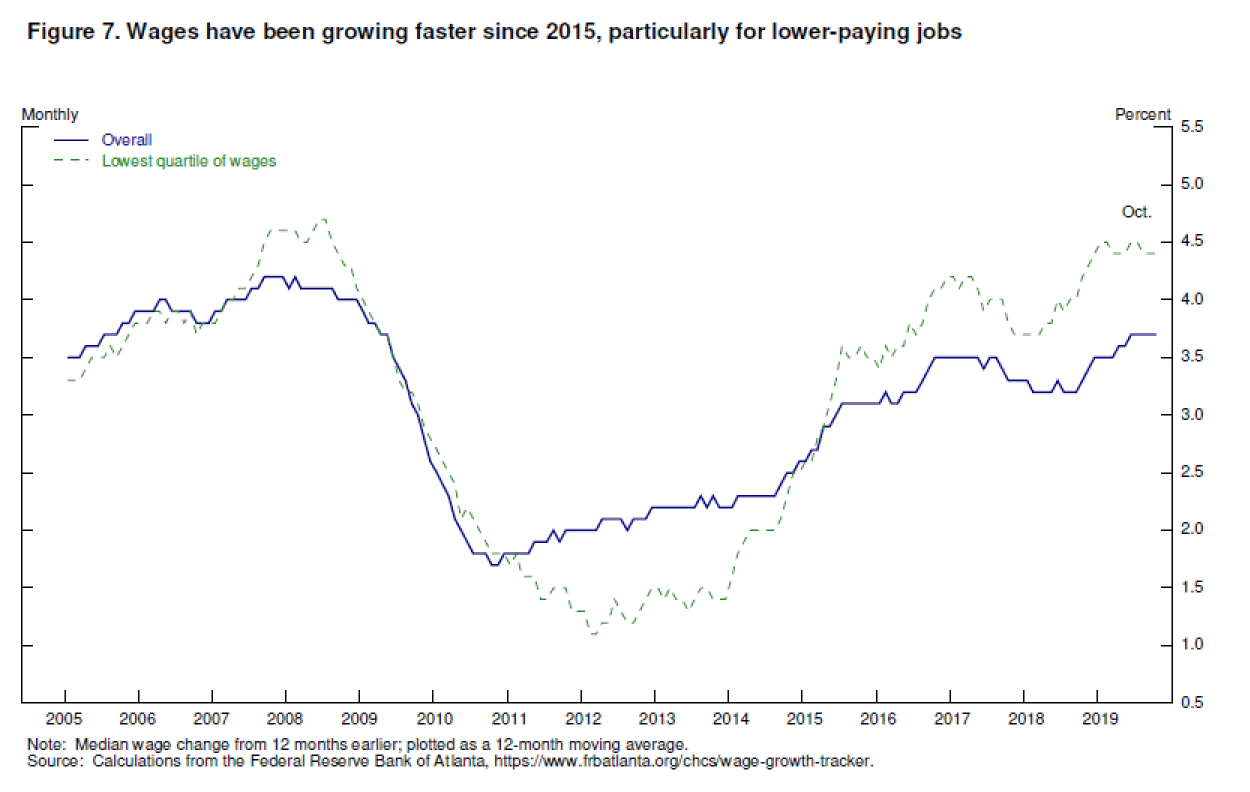
Income growth of low- and middle-income households has shown a pattern similar to that of participation, with two decades of disappointing news turning to better news during the past few years. According to Census data, inflation-adjusted incomes for the lowest 20 percent of households declined slightly over the two decades through 2014, and income for the middle 20 percent rose only modestly. Since then, incomes for these groups have risen more rapidly, as wage growth has picked up—and picked up most for the lower-paying jobs (figure 7).
Recent years' data paint a hopeful picture of more people in their prime years in the workforce and wages rising for low- and middle-income workers. But as the people at our Fed Listens events emphasized, this is just a start: There is still plenty of room for building on these gains. The Fed can play a role in this effort by steadfastly pursuing our goals of maximum employment and price stability. The research literature suggests a variety of policies, beyond the scope of monetary policy, that could spur further progress by better preparing people to meet the challenges of technological innovation and global competition and by supporting and rewarding labor force participation.6 These policies could bring immense benefits both to the lives of workers and families directly affected and to the strength of the economy overall. Of course, the task of evaluating the costs and benefits of these policies falls to our elected representatives.
Conclusion
Monetary policy is now well positioned to support a strong labor market and return inflation decisively to our symmetric 2 percent objective. If the outlook changes materially, policy will change as well. At this point in the long expansion, I see the glass as much more than half full. With the right policies, we can fill it further, building on the gains so far and spreading the benefits more broadly to all Americans.
1. These wealth calculations are from the Federal Reserve's Distributional Financial Accounts (DFAs). For more details on the DFAs, see Michael Batty, Joseph Briggs, Karen Pence, Paul Smith, and Alice Volz (2019), "The Distributional Financial Accounts," FEDS Notes (Washington: Board of Governors of the Federal Reserve System, August 30). To view or download the data, see the interactive visualization tool at https://www.federalreserve.gov/releases/z1/dataviz/dfa/index.html. Return to text
2. The projections of FOMC participants as reported in the Summary of Economic Projections show a similar change. Return to text
3. The Fed's real-time assessment of job growth this year is discussed in Jerome H. Powell (2019), "Data-Dependent Monetary Policy in an Evolving Economy," speech delivered at "Trucks and Terabytes: Integrating the 'Old' and 'New' Economies," the 61st Annual Meeting of the National Association for Business Economics, Denver, Colorado, October 8. Return to text
4. Averaging across the estimates in figure 2, the estimates of r* are down 0.3 percentage point and those of u* are down 0.2 percentage point. Return to text
5. Taken literally, the revised estimates of the stars would, by standard rules of thumb, call for a somewhat lower federal funds rate. For example, using the Taylor (1993) rule and using Okun's law to state the rule in terms of the unemployment gap with a coefficient of 1 instead of the output gap with a coefficient of 0.5, the shift in r* and u* would call for a 50 basis point reduction in the federal funds rate. John B. Taylor (1993), "Discretion versus Policy Rules in Practice," Carnegie-Rochester Conference Series on Public Policy, vol. 39 (December) (New York: Elsevier), pp. 195–214. Return to text
6. Francesco Grigoli, Zsóka Kóczán, and Petia Topalova (2018), "Labor Force Participation in Advanced Economies: Drivers and Prospects (PDF)," chapter 2 in International Monetary Fund, World Economic Outlook (Washington: IMF, April), pp. 1–58. Return to text