FEDS Notes
July 08, 2020
A New Indicator of Common Wage Inflation1
Hie Joo Ahn, Han Chen, and Michael Kister
The cyclical state of the economy and the natural rate of unemployment are key unobserved variables in policymakers' analysis of economic developments. The price Phillips curve relates the measures of resource utilization—often through deviations of the unemployment rate from the natural rate of unemployment—to consumer price inflation. Accordingly, policymakers have traditionally used the price Phillips curve as an important component of models used to make inferences about the cyclical state of the economy and the natural rate of unemployment. However, a large body of empirical evidence suggests that the price Phillips curve has become weaker, or "flattened," in recent years (e.g. Galí and Gambetti, 2019). Therefore, economists have started paying attention to the evolution of wage growth as a nominal indicator carrying the signal of economic slack. However, since the economic expansion began in 2009, wage growth has been somewhat subdued while the unemployment rate has continued to decline.2 We examine whether the link between wage growth and labor market slack has become weaker and propose a different explanation for recent subdued wage growth based on sectoral disaggregation.
Wage data are often observed with measurement errors and are partially affected by sector-specific developments that are unrelated to general macroeconomic conditions. Therefore, headline data might not correctly represent the wage growth that actually reflects the strength of aggregate demand—what monetary policymakers care about. We extract wage inflation components that are common across industries, filtering out the sector-specific components, and examine what the resulting common wage inflation indicator tells us about the underlying wage inflation pressure and the degree of tightness in the economy.
To this end, we estimate a dynamic factor model for the set of average hourly earnings (AHE) of production and nonsupervisory workers in 75 industries from 1990:Q1 to 2019:Q4. We extract the common wage inflation components of each industry and aggregate these common components to generate a new indicator, which we define as common wage inflation (CWI).
We find that CWI rose faster than the headline growth rates of AHE of production and nonsupervisory workers from 2014 to 2018. Sector-specific idiosyncratic factors largely account for the subdued wage growth in recent years despite the continued tightening in labor market conditions. The gap closed toward the end of 2018, and the headline growth rates of AHE of production and nonsupervisory workers as well as all workers were similar to CWI in 2019. In addition, CWI's correlation with the unemployment rate gap is higher and more stable than that of other conventional headline measures, such as AHE, compensation per hour (CPH), and the employment cost index (ECI).
In addition, our model further allows us to identify the industries in which wage inflation exhibits strong cyclicality. We show that wage growth in the most cyclical industries picked up rapidly, while it was subdued in the less cyclical sectors. It was the sluggish wage inflation from the less cyclical industries that damped aggregate wage inflation in recent years.
Finally, we offer some structural interpretation of CWI. Using the technique employed by Reis and Watson (2010), we can decompose CWI into "pure" wage inflation that affects wage inflation in all the sectors equiproportionally and relative wage inflation that creates the sectoral dispersion of wage inflation. We find that the pure wage inflation has been low and stable since the Great Recession. As the pure wage inflation has an equiproportional effect on all sectors, we can tentatively interpret it as the inflation expectation that all sectors take to set their nominal wages. We conjecture that factors, such as the Federal Reserve's anchoring of inflation expectation, effective forward guidance and the increased monopsony in the labor markets might have played a key role in this phenomenon. Miles et al. (2017) applied Reis and Watson (2010) method to the U.S. and Eurozone price inflation, and found that the pure inflation extracted from the sectoral price inflation data also stayed low and stable for the past decade, similar to the trajectory of our estimate of pure wage inflation. The similarity between the two pure inflation measures suggests that macroeconomic factors might have put downward pressure to both wage and price inflation, whether it is good luck or good policy.
Key Features of Common Wage Inflation
Figure 1 plots CWI together with AHE of production and nonsupervisory workers. We find that CWI suggests a tighter economy than other canonical wage indicators between 2014 and 2018. Recently, it reached a level close to the peak of the previous two expansions.
(1990:Q2-2019:Q4, annualized three-month percent changes)
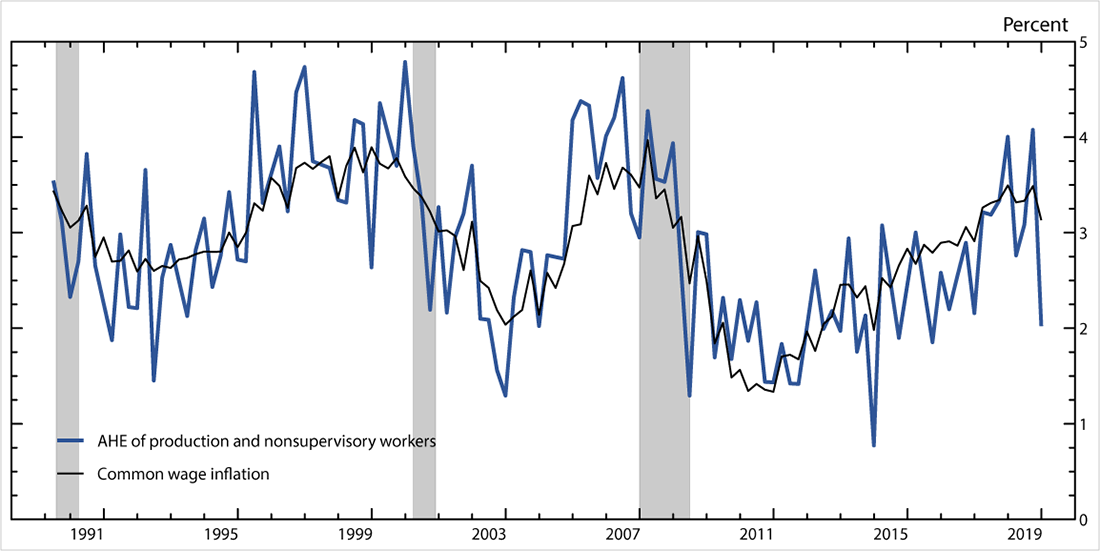
Note: The shaded bars with top caps indicate periods of business recession as defined by the National Bureau of Economic Research: July 1990–March 1991, March 2001–November 2001, and December 2007–June 2009.
Source: AHE of production and nonsupervisory workers (U.S. Bureau of Labor Statistics), Common wage inflation (authors' calculation).
Overall, CWI is less volatile than headline AHE inflation. The standard deviation of headline AHE inflation is 0.89, while that of CWI is 0.65 (measured by annualized three-month percent changes).3 The recent movements in CWI suggest that the underlying inflationary pressure coming from wages is greater than suggested by other headline wage measures. Indeed, as shown in Table 1, since 2014, CWI has risen faster than other key aggregate wage indicators—0.1 to 0.5 annualized percentage points, on average, per quarter. This finding suggests that the industry-specific idiosyncratic factors might have put downward pressure on aggregate wage growth. This conjecture is supported by the disaggregate analysis reported in Section 3 of this note..
Table 1. Differences between the CWI and other wage inflation indicators
(Average differences between the annualized three-month/quarterly percent changes)
| AHE (production and nonsupervisory) | AHE (all workers) | ECI | ECI (wages and salaries) | CPH | |
|---|---|---|---|---|---|
| 2014:Q1 – 2019:Q4 | +0.27 | +0.25 | +0.45 | +0.29 | +0.10 |
Note: For AHE, we use three-month percent changes. For the ECI and CPH, we use quarterly percent changes, as they are available quarterly.
Source: AHE of production and nonsupervisory workers and of all workers (U.S. Bureau of Labor Statistics), ECI and ECI of wages and salaries (U.S. Bureau of Labor Statistics), CPH (U.S. Bureau of Labor Statistics).
CWI aligns better with the continued tightening in recent labor markets than other wage indicators. As shown in Figure 2, since 2012:Q1, CWI (red solid line) mirrors the evolution of the Congressional Budget Office's (CBO's) unemployment rate gap (the negative of its values reported as the green dashed line). Meanwhile, the growth rates of headline AHE (production and nonsupervisory workers as well as all workers) and the ECI were somewhat sluggish.
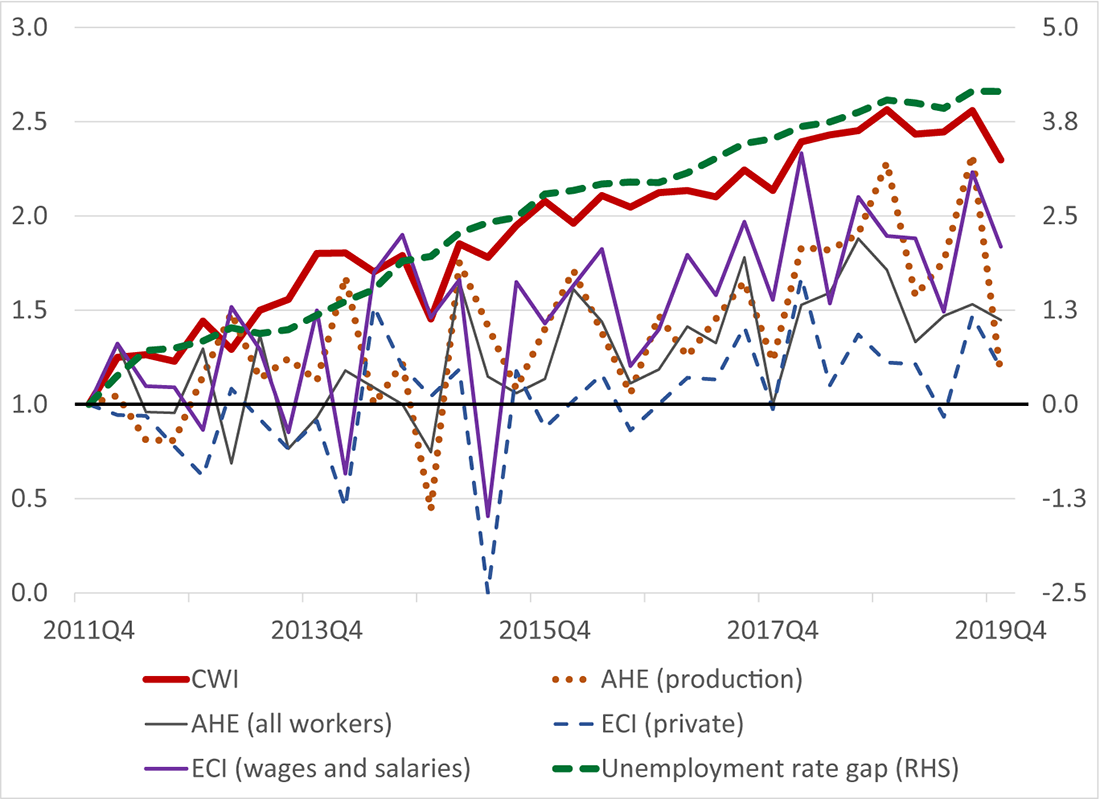
Note: We normalize the wage inflation rates in 2011 to be 1 by dividing the rates by the average values of 2011. We use the average in 2011 for the normalization to smooth out the noise in the quarterly estimates or data. We plot the changes in the negative unemployment rate gap relative to its 2011:Q4 value.
Source: AHE of production and nonsupervisory workers and of all workers (U.S. Bureau of Labor Statistics), ECI and ECI of wages and salaries (U.S. Bureau of Labor Statistics), CPH (U.S. Bureau of Labor Statistics), Unemployment rate (U.S. Bureau of Labor Statistics).
As already mentioned, CWI seems highly correlated with the cyclical state of the economy. As shown in Figure 2, the changes in CWI align better with the changes in the CBO's unemployment rate gap. This may appear surprising given that AHE is the narrowest measure in terms of the coverage of compensation among the measures considered in this note. However, that does not necessarily imply that the factor-model estimate from the disaggregate AHE data represents aggregate slack less than other more comprehensive wage measures. The headline AHE possibly understate the inflationary pressure coming from wages in a tight labor market, as more low-productive workers are drawn to the labor force because of strong labor demand, and their share might have increased in the payroll employment. Those low-productive workers probably have lower wages. If this compositional change is more likely to take place in certain sectors than others, headline AHE may increase less due to this downward pressure coming from those sectors with an increased share of low-productive workers. In this case, CWI, presumably affected less by the possible downward bias coming from the compositional change in the workforce, can still represent the underlying wage inflation captured by aggregate factors.
In addition, the correlation between CWI and the CBO's unemployment rate gap is higher and more stable than that of other wage inflation measures, including headline AHE, the ECI, and CPH as shown in Table 2. This observation suggests that sector-specific idiosyncratic wage fluctuations are likely to have weakened the aggregate wage Phillips correlation and made it unstable across sub-periods.
Table 2. Correlation between wage inflation indicators and (negative) unemployment rate gap
| CWI | AHE (production & nonsupervisory) | AHE (all) | ECI (all) | ECI (wages & salaries) | CPH | |
|---|---|---|---|---|---|---|
| 1990:Q2-2019:Q4 | 0.82 | 0.61 | N/A | 0.45 | 0.63 | 0.23 |
| 2009:Q1-2019:Q4 | 0.81 | 0.5 | 0.68 | 0.41 | 0.7 | 0.09 |
Source: CWI (author's calculation), AHE of production and nonsupervisory workers and of all workers (U.S. Bureau of Labor Statistics), ECI and ECI of wages and salaries (U.S. Bureau of Labor Statistics), CPH (U.S. Bureau of Labor Statistics).
Another desirable feature of the CWI index is that the estimate is less sensitive to data revision than headline AHE. Using the vintage data, we find that the root-mean-squared difference between the first and final estimates of headline AHE growth is 0.33 percentage point, while that of CWI is 0.23 percentage point.4
A Structural Interpretation of Common Wage Inflation
Following Reis and Watson (2010), we decompose CWI into two components: (1) the pure wage inflation factor affecting all sectoral wages, and (2) a relative wage inflation term that captures changes in wage growth dispersion. Figure 3 reports these two components.
We find that the pure wage inflation component has been low and stable since the Great Recession, while the relative wage inflation component went up gradually and continuously from 2011 to early 2019, serving as the main driver of the rise in headline AHE inflation and in CWI.
(Annualized 3-month percent changes, deviations from respective means)
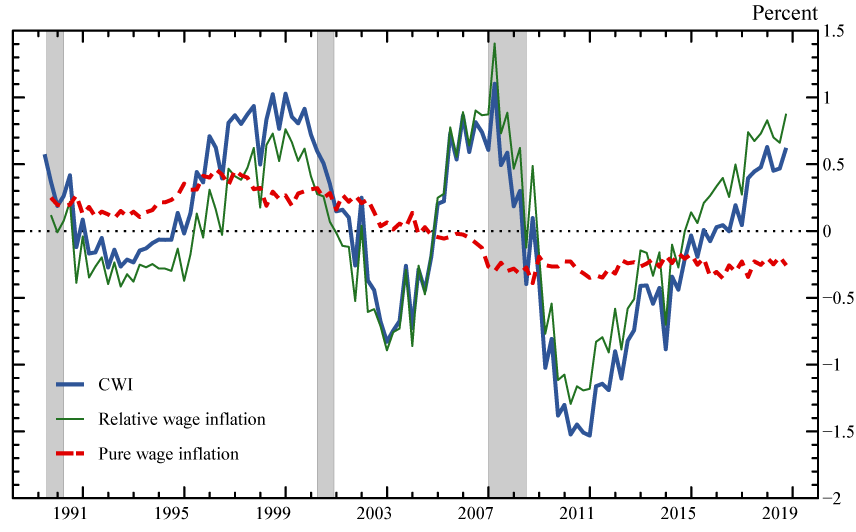
The shaded bars with top caps indicate periods of business recession as defined by the National Bureau of Economic Research: July 1990–March 1991, March 2001–November 2001, and December 2007–June 2009.
Source: authors' calculation.
The pure wage inflation component may be tentatively interpreted as reflecting the wage inflation expectations that are commonly shared by wage setters in all sectors and the effects of macroeconomic developments, such as monetary policy, that have substantial pervasive effects on all the industries.
We conjecture that several factors might have influenced the path of pure wage inflation. First, the Federal Reserve's solid anchoring of inflation expectations could have played a key role. In response to the Great Recession, and the weak recovery that followed, the Federal Reserve' monetary policies (e.g., the near-zero interest rate policy (ZIRP), and the large-scale asset purchases (LSAPs)) might have been successful in preventing a deflationary spiral that could have created a more severe recession. In addition, in January 2012 the FOMC announced an explicit 2% inflation target for the first time in the organization's 100-year history. Therefore, the effective monetary policies could explain the low and stable pure wage inflation.
Another possible explanation, based on conjecture, is the decrease in workers' bargaining power after the Great Recession due to the downsizing of sectors such as manufacturing where traditionally workers have had relatively strong bargaining power (Lawrence, 2015) and the increased monopsony in the labor markets (Azar, Marinescu, and Steinbaum, 2019). These phenomena might have had pervasive influences across industries, contributing to the low and stable pure wage inflation.
Between 2011 and early 2019, the relative wage inflation component pushed up headline wage inflation and CWI. The relative wage inflation was putting upside pressure on the wage growth, while the pure wage inflation was slowing the wage inflation. That is to say, some aggregate shocks have driven up wage inflation in some industries more than in others, and these shocks are important in understanding the aggregate wage inflation. The relative wage inflation seen in 2018 and 2019 is close to the level right before the Great Recession, and is even higher than the level seen in the late 1990s.
Heterogeneity in Wage Inflation Dynamics across Industries
The model allows us to identify industries where wage inflation exhibits strong, medium, and weak cyclicality. This ranking is based on the estimated factor loading of the first common factor in the model that is highly correlated with the CBO's unemployment rate gap.
According to this criterion, we allocate industries to one of three bins. These subgroups are labelled as having strong, medium, or weak wage cyclicality as shown in Table 3. Industries with strong wage cyclicality include professional and technical services, administrative and support services, and food services and drinking places. Industries with weak wage cyclicality include petroleum and coal products, textile product mills, and apparel.
Table 3. Groups of selected industries by cyclical sensitiveness of wage inflation5
| Industry | |
|---|---|
| Strong cyclicality | Professional and technical services, management of companies and enterprises, food services and drinking places, administrative and support services, repair and maintenance, accommodation, machinery |
| Medium cyclicality | Transportation equipment, real estate, oil and gas extraction, food manufacturing, paper and paper products, telecommunications, computer and electronic products |
| Weak cyclicality | Nonmetallic mineral products, petroleum and coal products, support activities for mining, apparel, textile product mills, social assistance, air transportation, chemicals |
As demonstrated in Table 4, wage inflation in strongly cyclical industries tends to exhibit faster growth but less volatility. However, wage growth in weakly cyclical industries (Panel A of Figure 4) has been fairly noisy. Wage inflation in both weak and medium industries (Panels A and B of Figure 4) has been subdued, which has put downward pressure on headline wage inflation.
Table 4. The mean and standard deviation of wage growth by cyclicality
(2015:Q1-2019:Q4)
| Weak | Medium | Strong | |
|---|---|---|---|
| Mean (%) | 2.5 | 2.73 | 3.18 |
| Standard deviation (pp) | 1.22 | 0.99 | 0.66 |
Notice that the wage growth in industries with strong cyclicality is similar to that of CWI, albeit with higher volatility (Panels C and D of Figure 4). This feature might suggest that the CWI indicator can provide a clear signal of aggregated slack by suitably assembling disaggregated information.
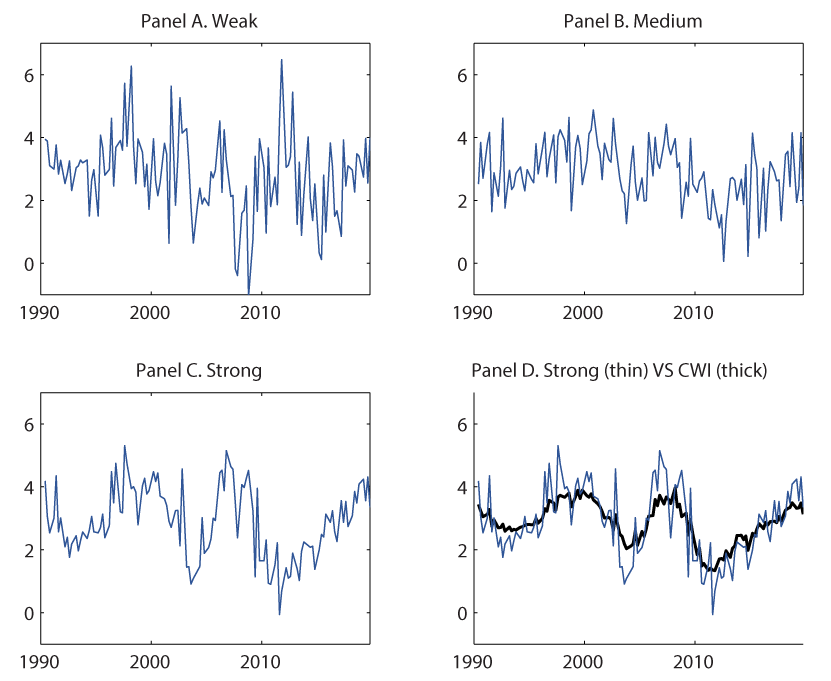
Source: authors' calculation.
Conclusion and Policy Implication
CWI exhibits a larger and more stable correlation with the unemployment rate gap than other popular wage inflation indicators. Given its stable correlation with the cyclical unemployment gap and its more rapid growth in recent years, CWI suggests a tighter economy than other headline measures between 2014 and 2018. We find that the industry-specific idiosyncratic components have exerted downward pressure on headline wage inflation in those years.
Based on the model with restrictions on the factor loadings as in Reis and Watson (2010), relative wage inflation has been the sole contributor to the growth of headline wage inflation from 2011 to 2019. Therefore, signs of overheating in the economy, such as binding supply constraints or labor shortages, might have emerged more strongly in a subset of industries at first and represented by the relative wage inflation factor, and CWI might be able to capture these pressures. In addition, we conjecture that the evolution of pure wage inflation might be associated with effective monetary policy.
Finally, the disaggregate analysis suggests that wage growth in cyclically sensitive industries might help policymakers to make better inferences on the cyclical state of the economy.
References
Ahn, Hie Joo, Chen, Han, and Kister, Michael, 2020. "A New Indicator of Common Wage Inflation," working paper.
Azar, José and Marinescu, Ioana Elena and Steinbaum, Marshall., 2019 Forthcoming. "Labor Market Concentration," Journal of Human Resources
Galí, Jordi & Gambetti, Luca, 2019. "Has the U.S. Wage Phillips Curve Flattened? A Semi-Structural Exploration," NBER Working Papers 25476, National Bureau of Economic Research, Inc.
Lawrence, Robert Z., 2015. "Labor's Declining Share in Manufacturing," Real Time Economic Issues Watch, Peterson Institute for International Economics.
Leduc, Sylvain & Marti, Chitra & Wilson, Daniel J., 2019. "Does Ultra-Low Unemployment Spur Rapid Wage Growth?" FRBSF Economic Letter, Federal Reserve Bank of San Francisco.
Reis, Ricardo & Watson, Mark W., 2010. "Relative Goods' Prices, Pure Inflation, and the Phillips Correlation," American Economic Journal: Macroeconomics, American Economic Association, vol. 2(3), pages 128-157.
Smith, Christopher L., 2014. "The Effect of Labor Slack on Wages: Evidence from State-Level Relationships," FEDS Notes 2014-06-02. Board of Governors of the Federal Reserve System (U.S.).
1. The analyses reported in this note are from Ahn, Chen, and Kister (2020). We gratefully acknowledge useful comments and suggestions from Gianni Amisano, Kirstin Hubrich, Matteo Luciani, Katia Peneva, Jeremy Rudd, and Daniel Villar-Vallenas. Niko Paulson provided excellent research assistance. Return to text
2. This observation led some analysts to question whether the wage Phillips correlation has weakened substantially or, alternatively, whether this correlation is intrinsically nonlinear. Examining the nonlinearity is important for monetary policymakers because it implies the possibility of a sudden pickup in wage inflation. Previous research found mixed evidence for this form of nonlinearity (e.g., Smith, 2014; Leduc, Marti, and Wilson, 2019). Return to text
3. The standard deviation of CWI is also smaller than that of the quarterly average of 12-month percent changes in the headline measure (0.75). Return to text
4. The real-time data for AHE by industry are available from March 2013, and thus the analysis is based on the data of vintage March 2013 to January 2020. This finding is robust to alternative plausible specifications of the factor model. Return to text
5. The group of strong cyclicality is composed of 25 industries, and the groups of medium and weak cyclicality consist of 30 and 20 industries, respectively. We list representative industries of each group in Table 3. Return to text
Ahn, Hie Joo, Han Chen, and Michael Kister (2020). "A New Indicator of Common Wage Inflation," FEDS Notes. Washington: Board of Governors of the Federal Reserve System, July 08, 2020, https://doi.org/10.17016/2380-7172.2550.
Disclaimer: FEDS Notes are articles in which Board staff offer their own views and present analysis on a range of topics in economics and finance. These articles are shorter and less technically oriented than FEDS Working Papers and IFDP papers.