FEDS Notes
August 07, 2020
An Early Evaluation of the Effects of the Pandemic on Living Arrangements and Household Formation
Daniel García and Andrew Paciorek
As with many other aspects of life—including the record-setting decline in employment—the COVID-19 pandemic has profoundly affected the living arrangements of millions of Americans. In this note, we document a fact that has as yet received little attention: The aggregate headship rate in the US has fallen dramatically since February, in large part because people have moved back in with older family members. Similar to many other consequences of the pandemic, these changes have been particularly stark among young adults, Black adults, and those without a college education.
The aggregate headship rate is defined as the ratio of the number of households—or, equivalently, the number of occupied housing units—to the number of adults in the US population. The headship rate reflects a variety of choices made by adults in determining where and with whom they live, including whether to live with their parents, whether to get married or form a domestic partnership, and whether to live with roommates.1 Movements in the headship rate reflect both long-run factors like demographic change and shorter-run fluctuations, such as the business cycle (Lee and Painter 2013, Paciorek 2016).
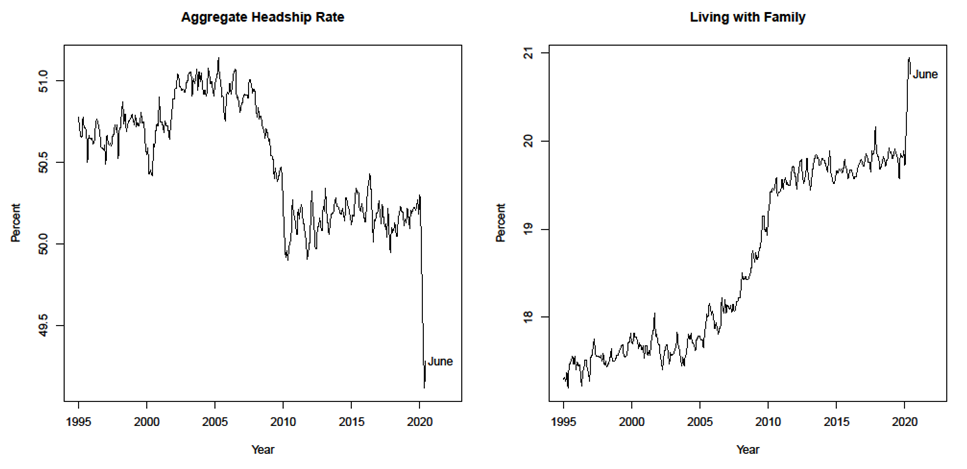
Source: CPS microdata and authors' calculations. Estimates for people age 16 and up.
The left panel of figure 1 shows our estimate of the aggregate headship rate using data from the monthly Current Population Survey (CPS). Most notably, the panel indicates a net decline of roughly 1 percentage point from February through June. This decline is of essentially the same magnitude as that seen over the entire Great Recession, and it corresponds to a drop in the number of occupied housing units—or an increase in the number of vacant units—of roughly 2 million.2 While the most recent data indicate a variety of changes in living arrangements during the pandemic, the decline in the headship rate is largely driven by the pattern seen in the right panel, namely a large increase in the fraction of adults living with family members who are not their spouses.3
The increase in the fraction of adults living with family is particularly sharp for Blacks, consistent with the growing evidence of the disparate effects of the pandemic across racial groups.4 Figure 2 shows the fraction of adults living with family across three groups based on race and ethnicity: Hispanic (dashed blue), non-Hispanic Black (solid red), and non-Hispanic white (solid black). Most strikingly, the percentage of Black adults living with family increased by about 3 percentage points between February and May, before falling back some in June. The increases among white and Hispanic adults have been smaller, though still sizable by recent historical standards. As a result, even though Blacks are only about 13 percent of the adult US population, they account for nearly half of the increase in living with family since the pandemic began.5
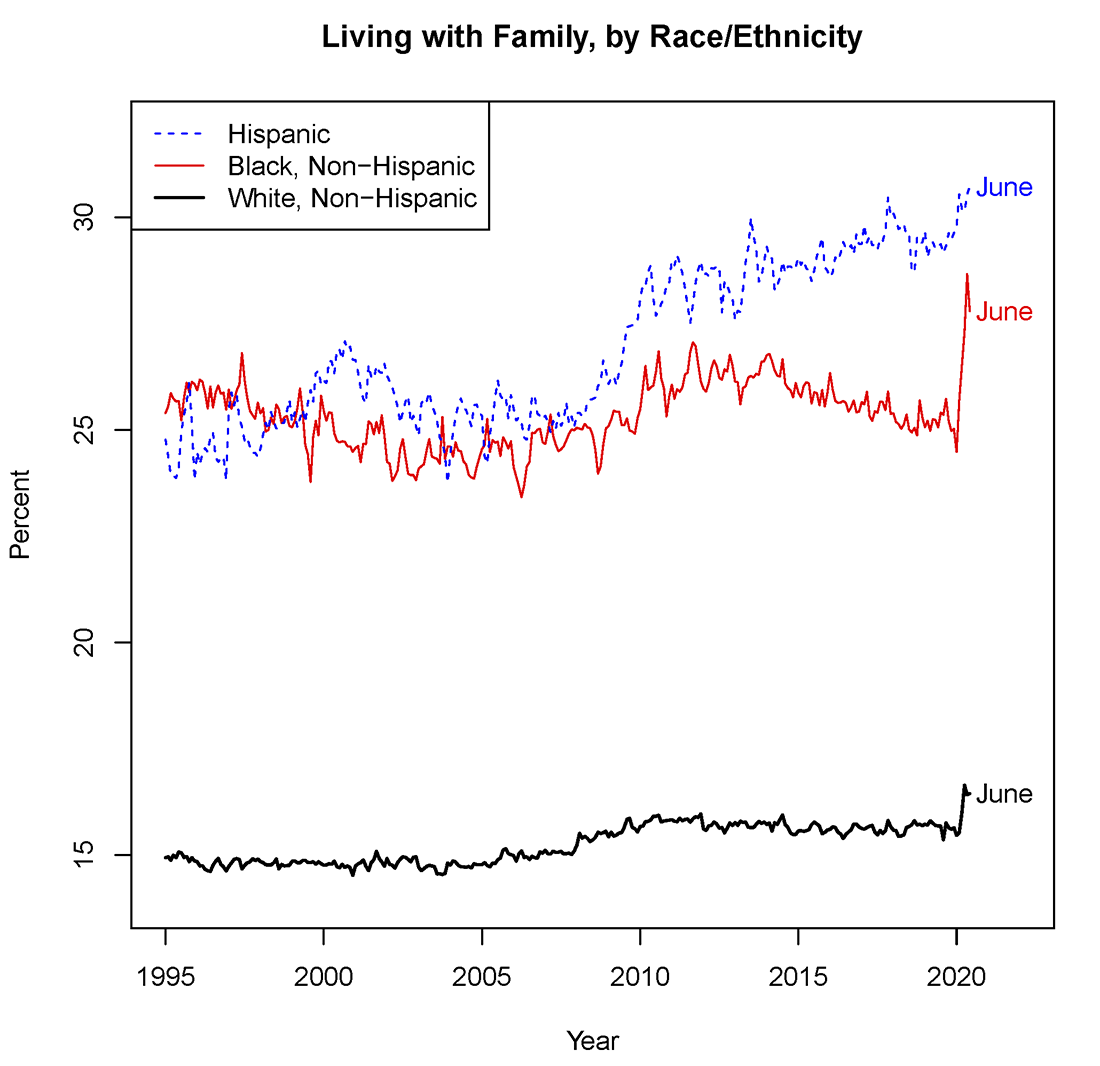
Source: CPS microdata and authors' calculations. Estimates for people age 16 and up.
We can also break down changes in the headship rate by age. The left panel of figure 3 shows that headship rates fell for most age groups between May 2019 and May 2020, with sharper declines for young adults. The right panel shows the cumulative effects of these changes on the aggregate headship rate, after accounting for the share of the population in each bin. The first three bins—adults 36 and under—account for almost three-quarters of the 1.1 percentage point decline in the headship rate over this period. For the youngest adults, school and college closings likely explain some of the decline. However, headship rates also fell sharply for young adults not in school (not shown). Moreover, the decline in headship rates for adults above the age of 70 suggests some parents may have moved in with their adult children.
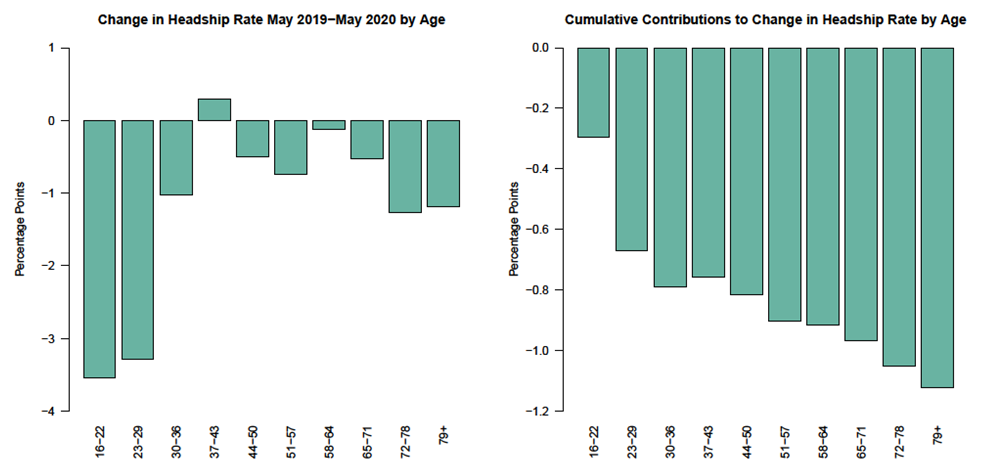
Source: CPS microdata from the IPUMS-CPS (Flood et al. 2020) and authors' calculations.
The unequal effects of the pandemic on living arrangements are also evident in figure 4, which breaks down headship rates by educational attainment. For those with a master's degree or higher, headship rates have held roughly steady, while they have fallen substantially for other groups, especially those without a college degree. These disparities are consistent with the patterns of employment losses during the pandemic, which have disproportionately affected those with lower educational attainment.
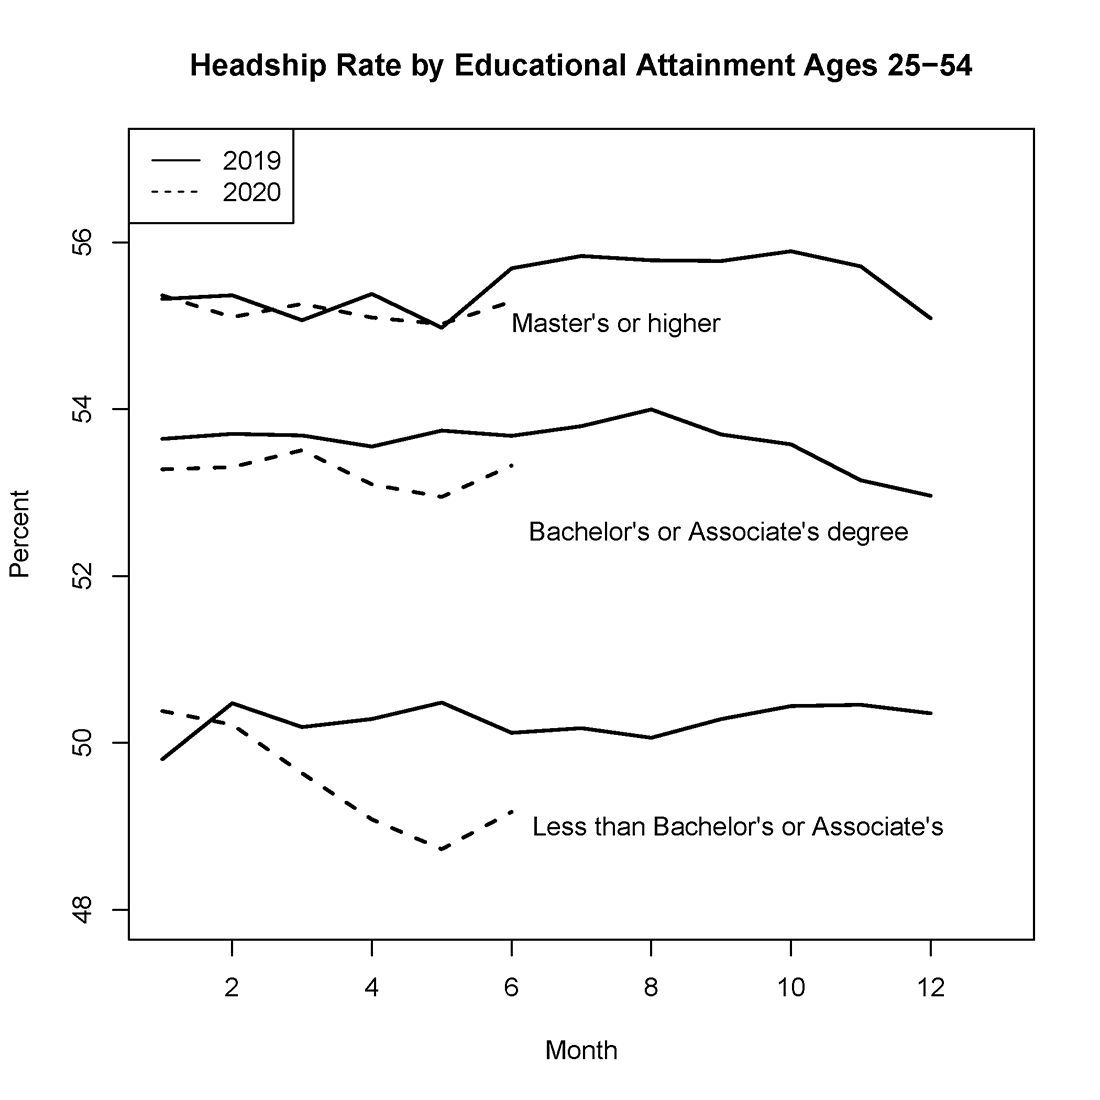
Source: CPS microdata from the IPUMS-CPS (Flood et al. 2020) and authors' calculations.
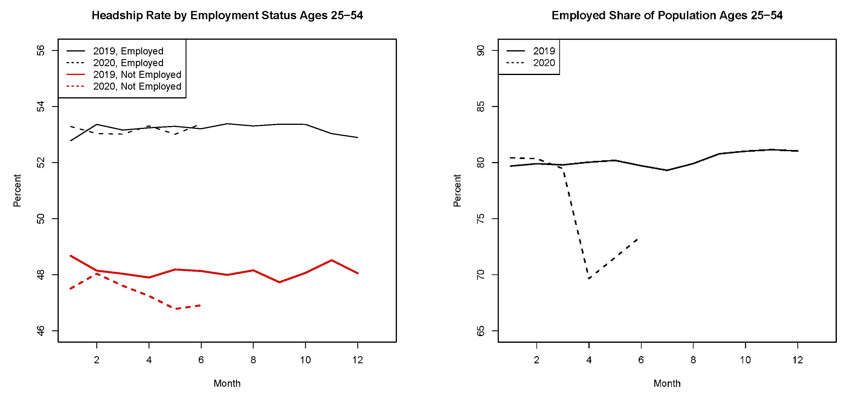
Given that the employed typically have higher headship rates, the massive decline in employment during the pandemic has also likely contributed to the fall in headship.6 While this note does not try to establish a causal relationship between employment and headship, we do perform a decomposition exercise to give a sense of the patterns in the data. We focus on the prime-age population (ages 25-54) to abstract from confounding factors related to school closures and changes in living arrangements for older adults. The left panel of figure 5 shows that headship rates in 2019 were about 5 percentage points higher among the employed than among the non-employed. During the pandemic, the headship rate for non-employed individuals has declined somewhat, but this shift accounts for only a small portion of the decline in the aggregate headship rate.
Instead, the decline in employment itself (right panel) has been a larger contributor to the fall in the aggregate headship rate. Mechanically, the 10 percentage point drop in the employed share of the population from February to April implied a decline of about 0.5 percentage point in the headship rate over that period. By June, the effect of the compositional shift in employment had narrowed to almost 0.4 percentage point—near the total drop in the headship rate for the prime-age population—as employment began to recover somewhat.
Source: CPS microdata from the IPUMS-CPS (Flood et al. 2020) and authors' calculations.
Given these results, we find it plausible the headship rate will rebound once the pandemic subsides, schools reopen, and employment picks up. Returning to figure 1, however, we can see that no such rebound in headship occurred in the aftermath of the Great Recession, which could reflect a variety of factors, including rising housing costs and the weight of student loans and other forms of debt (Dettling and Hsu 2018, Lee and Painter 2013, Paciorek 2016). While it is difficult to gauge the relevance of these particular factors going forward, it nevertheless seems possible that this recession will also have a scarring effect on headship and household formation, which could in turn depress new construction and have persistent impacts on wealth accumulation and inequality.
Bibliography
Bitler, Marianne, and Hilary Hoynes. 2016. "Living Arrangements, Doubling Up, and the Great Recession: Was This Time Different?" American Economic Review 105 (5): 166-70.
Dettling, Lisa J., and Joanne W. Hsu. 2018. "Returning to the Nest: Debt and Parental Co-Residence Among Young Adults" Labour Economics 54: 226-236.
Ermisch, John. 1999. "Prices, Parents, and Young People's Household Formation" Journal of Urban Economics 45(1): 47-71.
Flood, Sarah, Miriam King, Renae Rodgers, Steven Ruggles and J. Robert Warren. Integrated Public Use Microdata Series, Current Population Survey: Version 7.0 [dataset]. Minneapolis, MN: IPUMS, 2020. https://doi.org/10.18128/D030.V7.0
Kaplan, Greg. 2012. "Moving Back Home: Insurance against Labor Market Risk. Journal of Political Economy 120(3): 446–512.
Lee, Kwan Ok, and Gary Painter. 2013. "What Happens to Household Formation in a Recession?" Journal of Urban Economics 76: 93-109.
Paciorek, Andrew. 2016. "The Long and the Short of Household Formation." Real Estate Economics 44(1): 7-40.
Paciorek, Andrew. 2013. "The Long and the Short of Household Formation." Finance and Economic Discussion Series 2013-26.
U.S. Census Bureau. Current Population Survey, http://www.census.gov/programs-surveys/cps/data-detail.html
1. See Paciorek (2016) or Paciorek (2013) for a discussion of the accounting of the headship rate, including how to calculate headship rates for subsets of the overall population. Return to text
2. Admittedly, the difficulty of surveying during a pandemic makes us less confident than usual about this translation. In particular, the lack of in-person CPS interviews since March makes it much more difficult for interviewers to distinguish between A) housing units with a resident household that does not respond to the survey, and B) housing units that are vacant and do not contain a household. These challenges likely make the 2020:Q2 data from the Housing Vacancy Survey—which is done after the CPS identifies a sampled unit as vacant—particularly unreliable, which may explain why the published HVS data show a substantial decline in the number of vacant housing units from Q1 to Q2. See the Census Bureau's CPS/HVS FAQ. Return to text
3. More specifically, we define an individual as living "with family" if she lives with a family member who is the CPS respondent for a household and is not her spouse. Using this definition, in 2019, more than 70 percent of those living with family lived with a parent or grandparent, 12 percent with a child, 7 percent with a sibling, and the remainder with other family members. Return to text
4. See, for example, "The Fullest Look Yet at the Racial Inequity of Coronavirus" (New York Times; July 5 2020). Return to text
5. The recent patterns in the headship rate for each group mirror those of the percentages living with family. We show the latter in figure 2 because the group-specific levels of the headship rate conflate a variety of longstanding phenomena. For example, on average, Hispanics have lower headship rates than either whites or Blacks, because they are both more likely to live with family than whites and are more likely to be married or in a partnership (and less likely to be single) than Blacks. Return to text
6. Previous studies find that changes in employment status, and the ability to move in with family as an insurance mechanism, are a key driver of changes in living arrangements (Bitler and Hoynes 2015, Kaplan 2012, Ermisch 1999). Return to text
García, Daniel, and Andrew Paciorek (2020). "An Early Evaluation of the Effects of the Pandemic on Living Arrangements and Household Formation," FEDS Notes. Washington: Board of Governors of the Federal Reserve System, August 7, 2020, https://doi.org/10.17016/2380-7172.2735.
Disclaimer: FEDS Notes are articles in which Board staff offer their own views and present analysis on a range of topics in economics and finance. These articles are shorter and less technically oriented than FEDS Working Papers and IFDP papers.