FEDS Notes
December 15, 2023
An update on Excess Savings in Selected Advanced Economies
François de Soyres, Dylan Moore, Julio Ortiz1
In a previous FEDS Note, de Soyres, Moore, and Ortiz (2023), we conducted a comparison of household excess savings across advanced and emerging economies over different historical episodes. In that analysis, we found that the stock of excess savings accumulated during the pandemic in the U.S. was exhausted by 2023Q1, while other advanced economies were not expected to deplete their excess reserve until late in 2023.
In this note, we focus on the COVID episode and update our estimates of excess savings across countries based on the latest available national accounts data and examining the implications of our updated estimates for the future of household spending in the short term.2
Then, we discuss the uncertainty associated with measuring "excess savings". The relatively wide range of estimates of the current state of household excess savings poses a challenge for economists and policymakers. As a result, it is important to examine the sources of differences in measures of excess savings. We attribute the primary differences in existing estimates of the level of excess savings to: (i) conceptual differences about "trend savings", (ii) the sensitivity of measures to the sample period used to estimate trend savings, and (iii) differences in the use of gross vs. net savings.
Finally, we examine the role that fiscal policy played as a driver of excess savings since the onset of the pandemic.
1. Recent data
Over the past few months, new data has been released by statistical agencies. First, several countries updated their estimates for household income and savings, which changes the estimated savings rate. Second, data for the second and, in some countries, the third quarter of 2023 have been released. Based on these new data, we updated our excess savings estimates in most advanced economies. As a reminder, we define excess savings as the amount of savings arising from above-trend savings rates. We consider two alternative methods for defining the savings rate trends: (1) the Hamilton (2018) filter which extracts a time-varying trend, and (2) a linear trend. In the case of the Hamilton estimation, we use data starting in 1970 to estimate the time varying trend, while in the case of the linear trend we use the five years preceding the pandemic.
In Figure 1, we present our new results for the evolution of the accumulated stock of household excess savings in advanced economies. Our estimates suggest that level of excess savings stock on household's balance sheet remains high for most countries, with the notable exception of the U.S. In all foreign economies, the stock of excess savings remains firmly positive, which could imply that household balance sheets are strong and may support private consumption in the quarters to come. However, such a prediction would be based on the assumption that households are willing to spend their accumulated buffer of savings, even though they have not done so in recent quarters. In countries such as France, Germany or Spain, excess savings seem to plateau, suggesting that accumulated wealth is actually not being spent further.
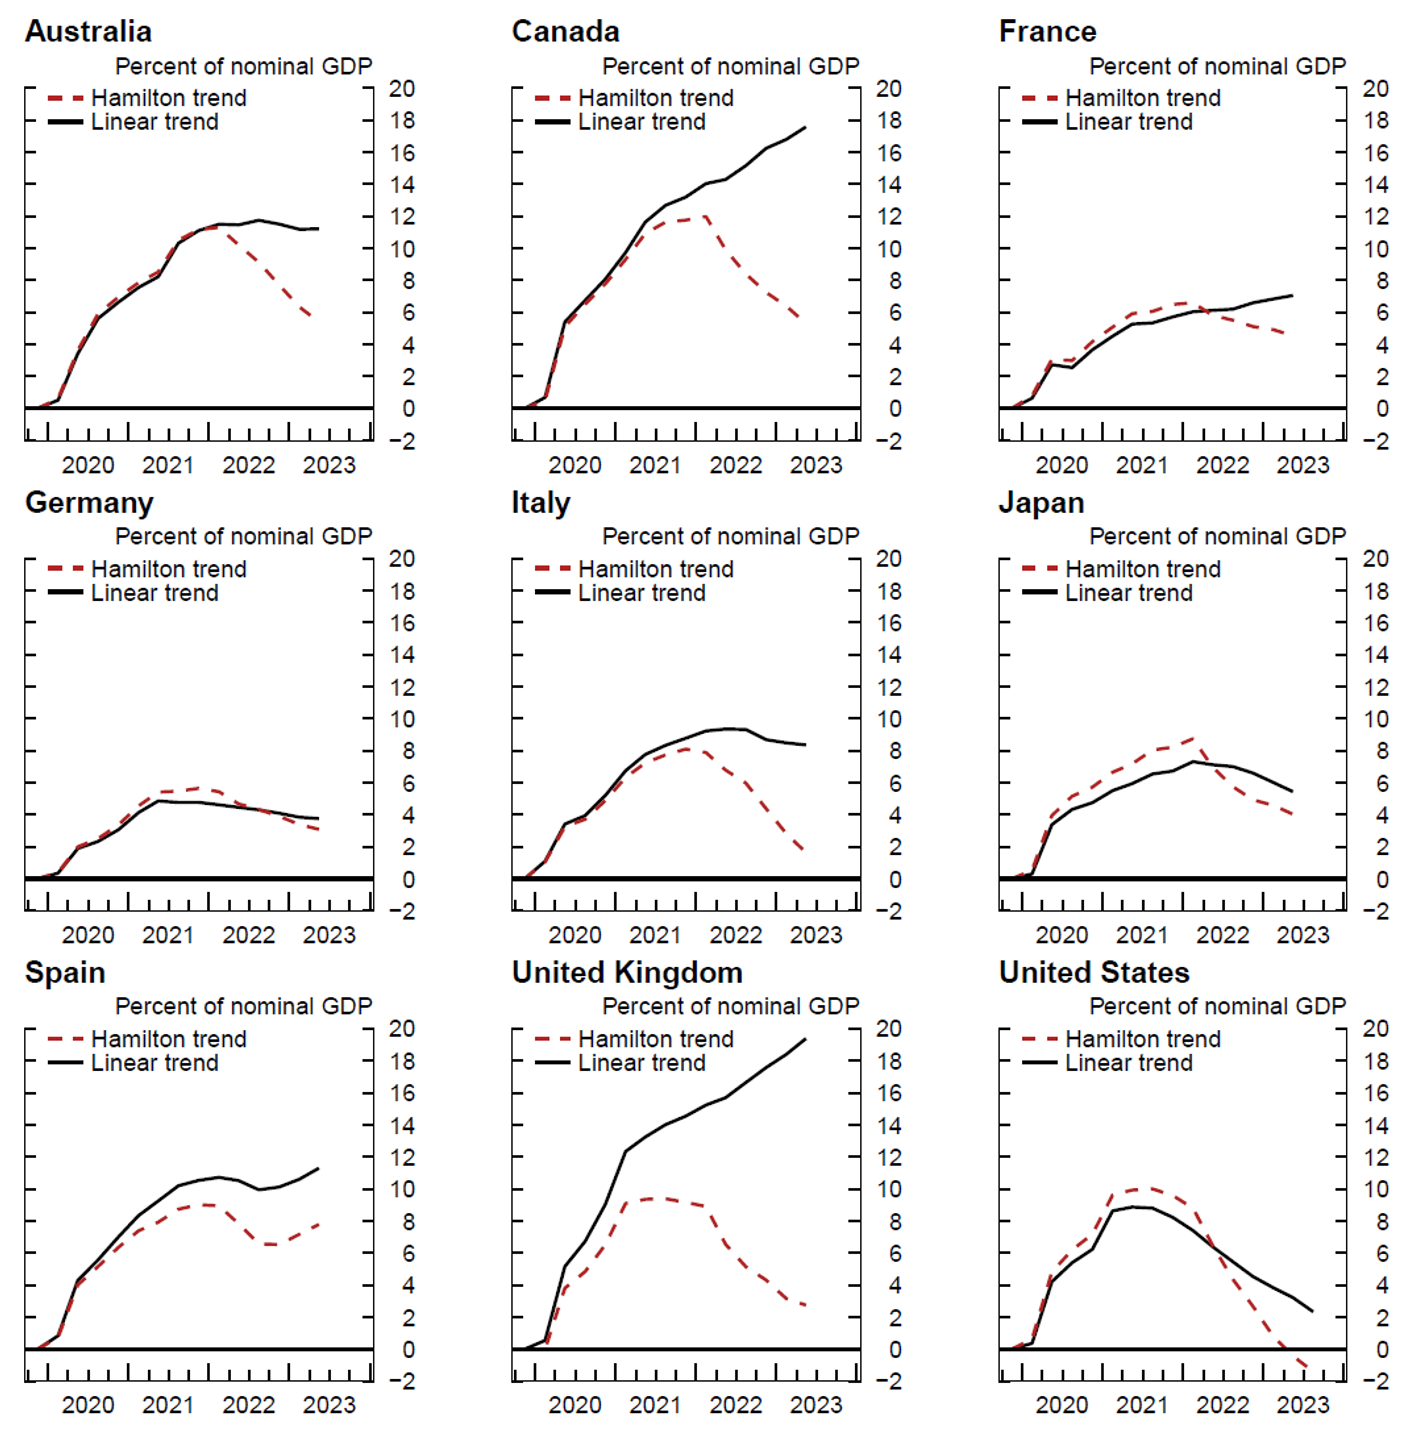
Note: Excess Savings are defined as savings accumulated when the household savings rate is above trend. Accumulation starts in the first quarter of 2020.
Source: Haver Analytics; authors' calculations.
Importantly, our results reveal that the estimates are very sensitive to the method used in the construction of the pre-pandemic savings rate's trend. Some countries, in particular the U.K. and Canada, have large differences in excess savings when using a linear trend as opposed to a Hamilton (2018) trend. To illustrate the considerable uncertainty around the exact level of excess savings currently in household's balance sheets, the next section reviews some assumptions made by a number of researchers and discusses how they affect excess savings' estimates.
2. On the uncertainty revolving around the definition of Excess Savings
In a context of persistently elevated core inflation, monetary tightening, and continued supply-demand imbalances in many countries, it is especially important to assess the pace at which households might be expected to spend their excess savings. However, economists scouting for precise information on the accumulated stock of excess savings are facing a hard time, as there are many different estimates of excess savings, painting different pictures depending on the assumptions used. Though we do not resolve this uncertainty, we discuss a few of its sources, with a focus on the U.S. stock of excess savings.
a. Building the counterfactual: trend savings vs. trend savings rate?
In recent work, researchers look at nominal savings and define excess savings to be the deviation from a pre-recession linear trend of the level of nominal savings (see Aladangady et al. (2022) or Abdelrahman and Oliveira (2023)). This approach differs from our work, as we focus on the savings rate and define excess savings as the deviation of the observed ratio of savings to disposable income relative to an estimated trend. Hence, the first source of uncertainty that we discuss relates to differences in the notion of "trend savings".
There are strengths and limitations associated with any definition of excess savings, but there are two main reasons that led us to look at deviations of the savings rate as opposed to the level of nominal savings. First, disposable personal income (DPI) was itself far from its trend throughout the pandemic, as shown in Figure 2. Accordingly, measures of excess savings based on accumulated deviations of the level of nominal savings could imply that excess savings are positive even if the savings rate returns to its pre-pandemic trend, as long as DPI is above its pre-pandemic trend. In contrast, when using our definition based on deviations of the savings rate from an estimate of its trend, excess savings are only positive when the savings rate is above its trend.
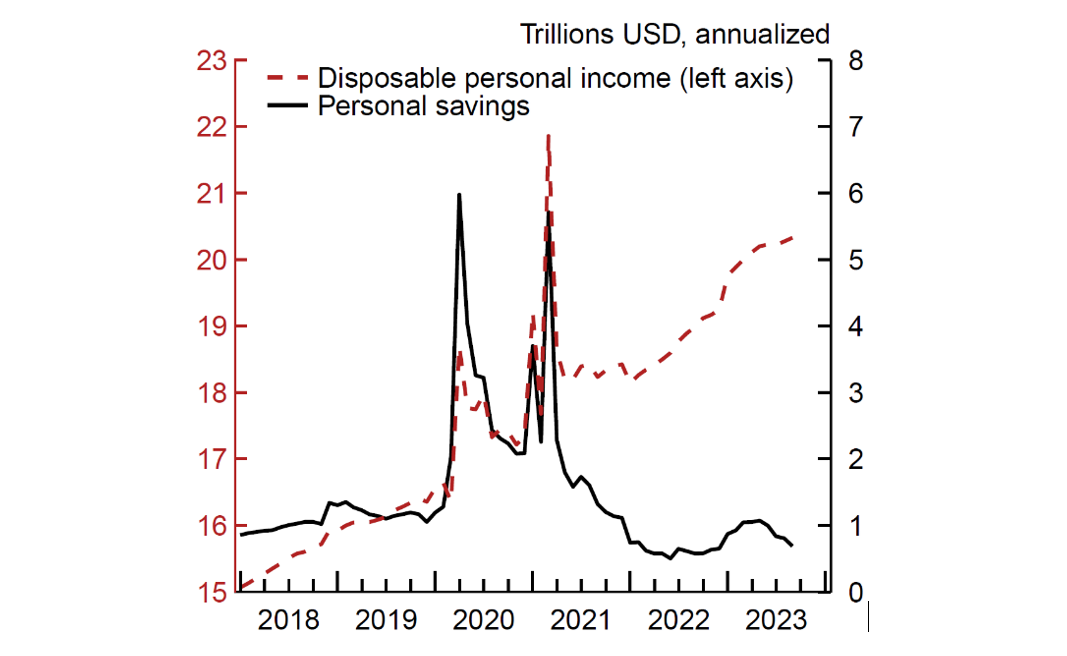
Note: The chart presents the evolution of household disposable income and personal savings in the U.S. using monthly data. Values are annualized trillions of dollars for ease of comparison with other macroeconomic aggregates.
Source: Haver Analytics.
Relatedly, by fitting a linear trend to nominal savings and defining it as the baseline against which excess savings are calculated, one makes an implicit assumption about the baseline savings rate. Figure 3 illustrates this point by plotting the savings rate implied by fitting a trend to the nominal flow of savings. To construct this figure, we first fit a linear trend to the level of nominal personal savings over the 48 months prior to the onset of the COVID recession and extrapolate it to the present. We then calculate the implied trend savings rate as the ratio of the fitted level of nominal savings according to the linear trend, divided by the observed values for DPI. According to Figure 3, the savings rate that is consistent with the level of nominal savings residing at its linear trend exhibits a sharp drop during the onset of the pandemic, right as the government responds by providing households with fiscal support.
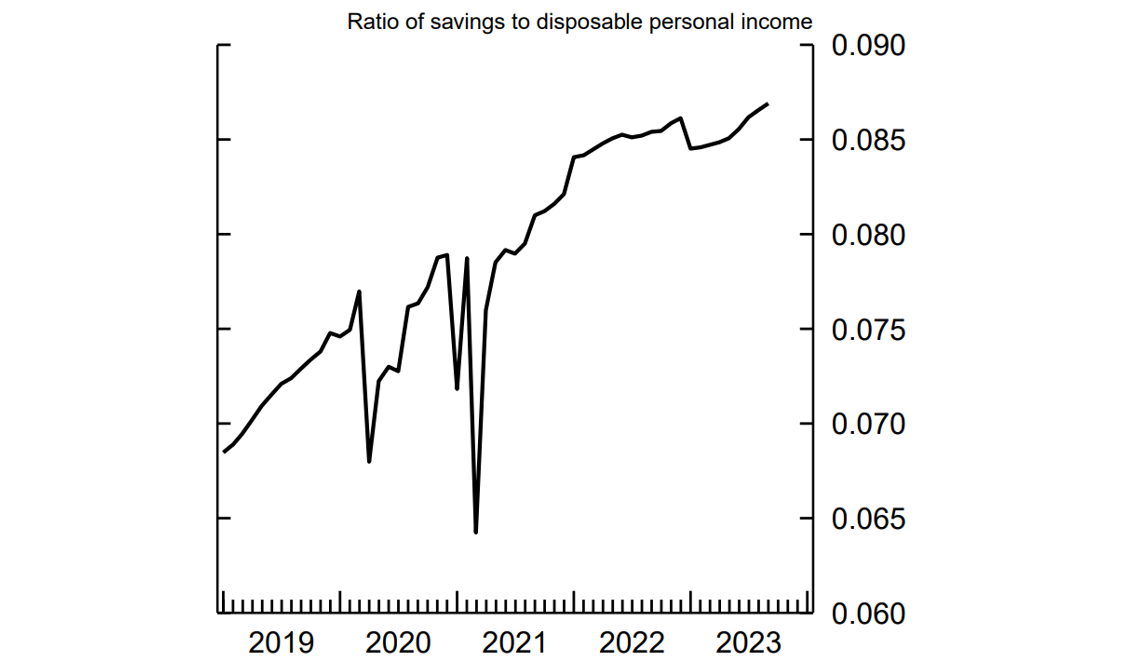
Note: This chart shows the savings rate obtained as a counterfactual where the flow of nominal savings is at its trend while Disposable Personal Income fluctuates as it does in the data. This represents the implied savings rate used in Abdelrahman and Oliveira (2023) as a counterfactual to construct "excess savings".
Source: Haver Analytics; authors' calculations.
Second, inflation could matter when measuring excess savings using the level of nominal savings. In an extreme case, when estimating excess savings based on deviations from the level of nominal savings, positive excess savings could in principle be entirely driven by prices deviating from their pre-pandemic trends.
Given the uncertainty surrounding the theoretical underpinning of the excess savings concept, it is useful to compare the estimated stock of excess savings obtained by detrending the level of savings and savings rates. In Figure 4, we present the evolution of U.S. excess savings obtained using three existing measures: (i) our own linear trend method, where excess savings is based on the deviation from the trend savings rate; (ii) the definition proposed by Abdelrahman and Oliveira (2023), where excess savings are defined as deviation from trend nominal savings; and (iii) the definition used in Aladangady et al. (2022), where excess savings are obtained by adding the amount that the components of DPI exceed their trend with the amount that PCE and other outlays are below their trend.3 To simplify comparisons with other analyses, Figure 4 expresses all estimated stocks of U.S. excess savings in billions of USD (as opposed to shares of GDP as in other figures).
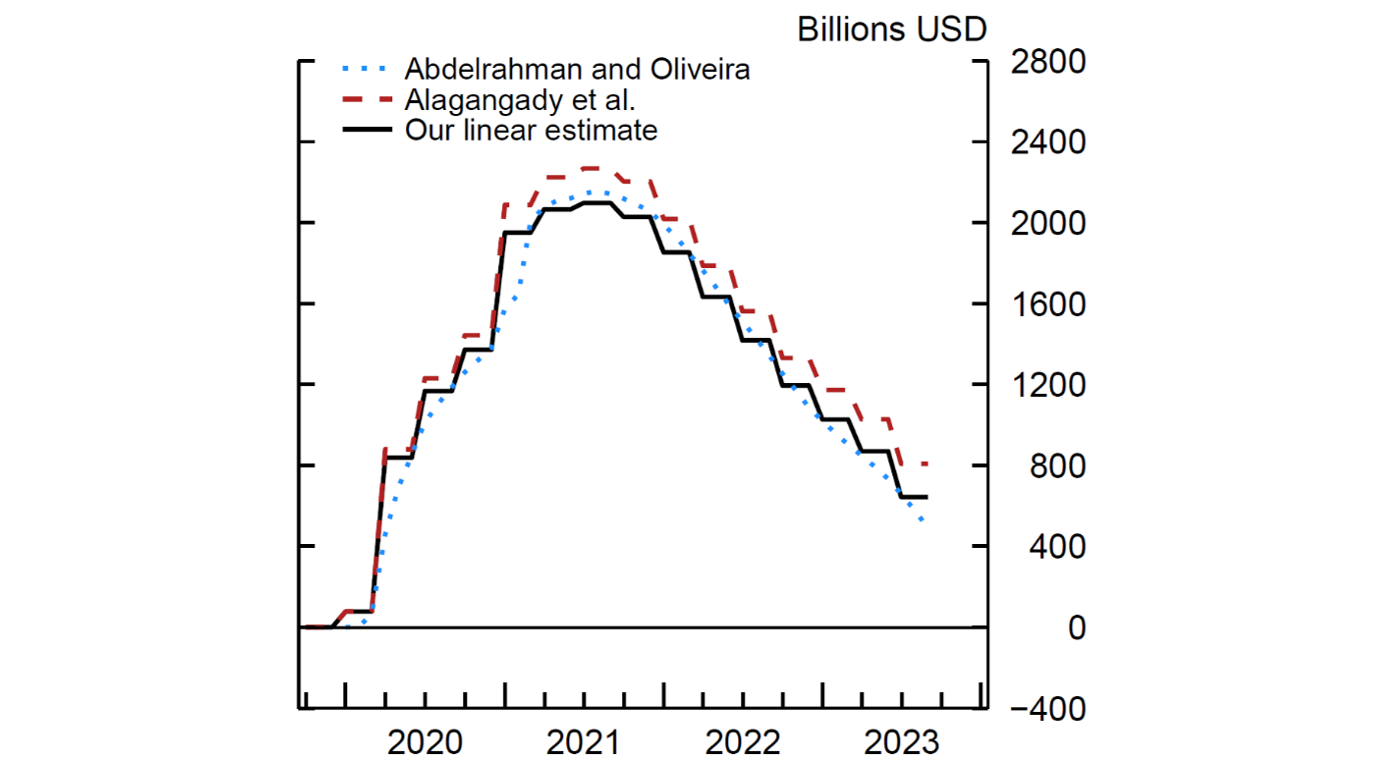
Note: Excess savings are computed at the quarterly frequency for our estimates as well as Aladangady et al. (2022), while they are computed at monthly frequency in Abdelrahman and Oliveira (2023).
Source: Haver Analytics; authors' calculations.
As can be seen in Figure 4, our linear trend estimate based on the savings rate falls in between other studies, with a remaining stock of excess savings standing at about $650 billion. Relative to Aladangady et al. (2022), our linear trend estimate yields a smaller remaining stock of U.S. excess savings. The difference might seem small in this chart, but when applying a four-year trend rather than five-year trend to our linear trend methodology, as in Abdelrahman and Oliveira (2023), we obtain a remaining stock of excess savings at around $98 billion, which is significantly lower than the estimate in Abdelrahman and Oliveira (2023). Hence, our linear trend estimate based on the savings rate tends to deliver a lower current estimate of U.S. excess savings.
b. On the sensitivity of our estimates
Having discussed conceptual differences of "trend savings", we next examine the sensitivity of estimates of trend savings when taken to the data. We do so by showing that our excess savings estimates based both on our Hamilton and linear trend approaches are sensitive to changes in the sample period used to estimate the trend savings rate. As a reminder, in our baseline estimates, the Hamilton trend is defined as the fitted values of a time series regression, where the sample used for the trend estimation starts in 1970Q1 and ends just before the pandemic episode, in 2019Q4. On the other hand, our linear trend approach is implemented by fitting a line to savings rate over the five years preceding the pandemic.
In Figure 5 (left panel), we present the estimated stock of excess savings in the U.S. when the sample period used in the estimation starts earlier (in 1950Q1) or later (in 1990Q1). Although the general shape of the estimates remains the same, the estimated levels of excess savings at recent dates present important differences – which in turn has important implications in terms of forecasting. When the sample period starts in 1950Q1, the estimated stock of excess savings has been fully depleted, while it remains firmly positive when the sample period starts in 1990Q1. In the former case, one could expect household consumption to slow down in the U.S., while the former suggests that households could still have reserves to fuel spending in the quarters to come.
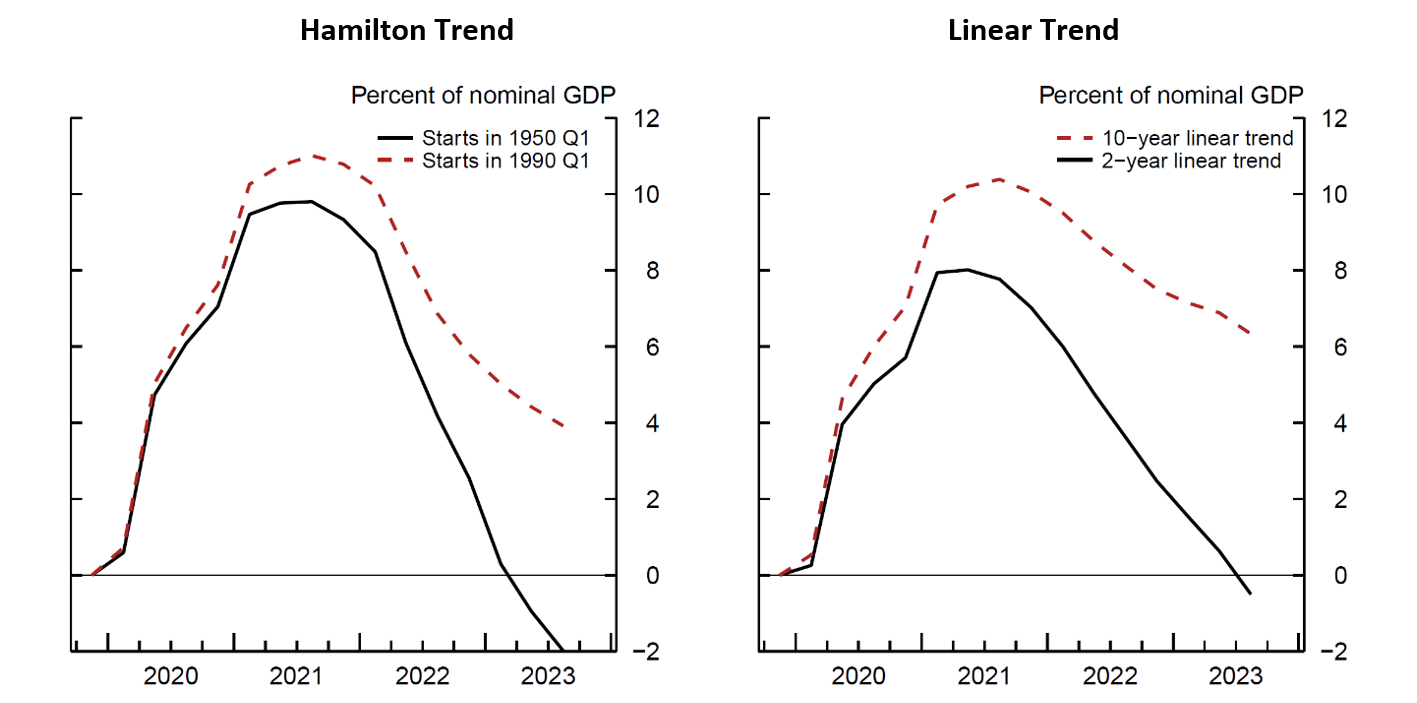
Note: Excess savings are computed as deviation from a Hamilton trend. The sample used in the estimation of the Hamilton trend plays a quantitatively important role in the estimates.
Source: Haver Analytics; authors' calculations.
The differences between our 1950Q1, 1990Q1, and baseline estimates of excess savings can be explained by differences in the estimated coefficients of the time series regression used to obtain the trend savings rate. The Hamilton trend estimated since 1950Q1 increases markedly in late 2022 which mechanically leads to a faster deaccumulation of excess savings and results in a negative stock at present. The savings rate trend in our baseline specification does not rise as much as the 1950Q1 estimates, which results in a slower rundown of excess savings and a less negative estimate of excess savings by 2023Q3. Finally, the trend savings rate estimated since 1990Q1 yields an even more gradual rundown of excess savings and implies a positive level of excess savings as of 2023Q3.
The sensitivity to the sample period used to estimate the savings rate trend is not unique to our Hamilton filter methodology. We next examine our linear trend-based estimates of excess savings and find that this more conventional approach is similarly sensitive to the sample period. In Figure 5 (right panel), we use a linear trend estimated over different periods and show the associated stock of excess savings. When fitting a linear trend based on the last two years before the pandemic, the estimated excess savings stock turns negative in 2023Q3, while it is estimated at more than 6 percent of GDP when the linear trend is fitted over the decade preceding the pandemic. Like our Hamilton filter estimates, these linear trend estimates of excess savings differ due to differences in estimated trend savings rates across specifications. When fitting a line to the U.S. savings rate over the two, five, and ten years prior to the pandemic, we find that the slope of the trend line flattens when estimated over longer histories. Thus, the size of the estimated stock of U.S. excess savings as of 2023Q3 is increasing in the window length used to fit the trends savings rate.
Overall, we note that both Hamilton and linear trend estimates are very sensitive to the sample period used, which creates uncertainty regarding the values obtained with a particular set of assumptions.4
c. On gross vs. net savings rate
The final source of uncertainty that we discuss relates to the definition of the savings rate used in our analysis. In our note, we define the savings rate as gross household savings divided by disposable income, which is slightly different from the net savings rate reported by the U.S. Bureau of Economic Analysis. In particular, we define gross household savings as the sum of personal savings (NIPA Table 2.1) and consumption of fixed capital: households and institutions (NIPA Table 5.1). We define disposable income as the sum of gross household savings and final household consumption (personal consumption expenditures, NIPA Table 1.1.5).
This definition of gross household savings makes our savings rate a bit higher on average than the savings rate in NIPA Table 2.1, since we also include consumption of fixed capital. However, this assumption does not appear to be consequential, as both savings rates comove quite closely, as shown in Figure 6 (left panel). Since both savings rates mostly differ in terms of their levels, the estimated trend savings rates also largely differ in their levels and the resulting estimated stock of excess savings using either one of these savings rates is not materially different, as shown in the right panel of Figure 6 which displays estimates of U.S. excess savings based on our linear trend methodology.
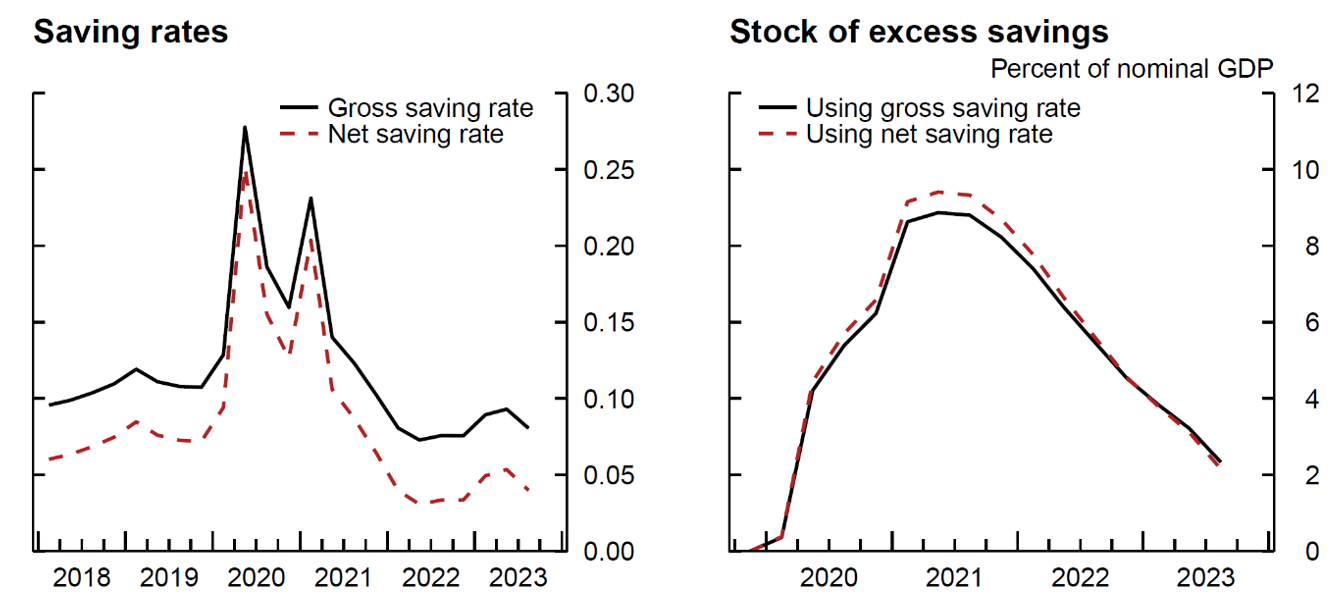
Note: Gross and Net savings rate in the United States are very highly correlated. Computing excess savings as deviation of gross vs. net savings rate does not have a large impact on the results.
Source: Haver Analytics; authors' calculations.
3. The role of Fiscal Support and changes in Household Income
In most countries, the accumulation of excess savings during the pandemic was followed by a period of deaccumulation when lockdowns were lifted, and vaccination coverage reached high levels. In this period of reopening, households experienced a below trend savings rate for several quarters, meaning that the accumulated stock was used, at least in part, to fuel household consumption, with potential consequences for the path of GDP and inflation. Hence, as governments reflect on how their policies implemented during the COVID pandemic played out in the reopening phase, understanding the driver of excess savings is particularly important.
To investigate the determinant of excess savings accumulation, Figure 7 uses cross-country data to show the strong and significant association between government fiscal support and the accumulation of excess savings. In these charts, we use data from 2020 to 2022 and each dot represents a country-year couple for the values of these two variables. Let us briefly describe the variables displayed before discussing the results.
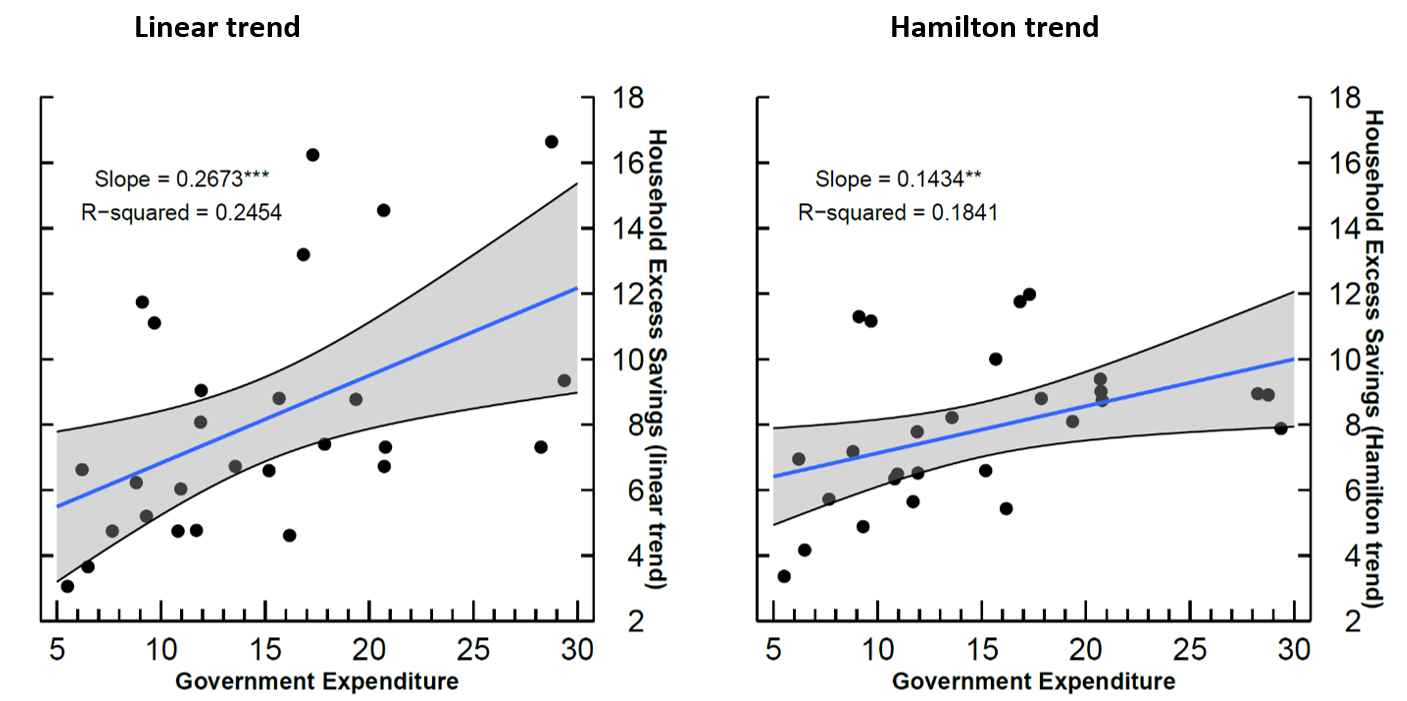
Note: Each point represents a country-year. The yearly value is the maximum excess savings and government expenditure value for that year. *** means significant at the 1 percent level, ** means significant at the 5 percent level.
Source: Haver Analytics; authors' calculations.
To define "government fiscal support", we compute the share of government spending over GDP and estimate the pre-pandemic trend of this ratio using data from 2015 to 2019. Then, from each year from 2020 to 2022, we define a country's "government fiscal support" as the government spending associated with a spending-over-GDP ratio above trend. For each country-year, we then compute the maximum level of excess savings reached during the year, as well as the cumulative government fiscal support for that year. Figure 7 then shows the association between cumulative government support and the accumulated stock of excess savings across countries, using either the linear (left panel) or Hamilton (right panel) method to estimate excess savings.
The results show that, when focusing on the period before the post-COVID reopening, there is a significant positive association between government fiscal support and the stock of excess savings. In other words, countries that engaged in generous fiscal support are also countries that accumulated higher stocks of excess savings. Interestingly, the intercept of the regressions displayed in Figure 7 are significantly positive. In other words, while government fiscal support seems to have played a role in the accumulation of excess savings, it is not the only driver: even countries that would not have any fiscal support would have accumulated a positive stock of excess savings. This observation suggests that the constraints put on spending during lockdown were, on their own, sufficiently stringent to generate excess savings. That said, our results show that these savings were magnified in presence of strong fiscal support.
Concluding Remarks
Household excess savings accumulated during the pandemic have been partially spent since the reopening, and the large spending associated with this de-accumulation has likely impacted growth and inflation. As a result, estimating the current level of excess savings has been the subject of considerable attention over the past year.
In this Note, we update previous estimates and provide a variety of analyses documenting how excess savings estimation depends on assumptions regarding the baseline scenario for the savings and savings rate. Overall, countries have been on heterogenous paths over the past year, and only the U.S. seems to have either already depleted its stock of excess savings or be close to it depending on the estimation method. Depending on the method used to define "excess", the stock of U.S. excess savings ranges from slightly positive to slightly negative values. In many other countries, the stock of excess savings seems to remain firmly positive, and in some cases has an ambiguous trend in the quarters to come.
Finally, looking at cross country comparisons, we show that the accumulation of this buffer of savings was associated with large fiscal support. This observation sheds light on the tradeoff faced by governments during the pandemic, as fiscal support seems to have been spent with a significant delay.
References
- Abdelrahman, Hamza and Luiz E. Oliveira (2023). "The Rise and Fall of Pandemic Excess Savings," FRBSF Economic Letter 2023-11, The Federal Reserve Bank of San Francisco, May 8, 2023.
- Aladangady, Aditya, David Cho, Laura Feiveson, and Eugenio Pinto (2022). "Excess Savings during the COVID-19 Pandemic," FEDS Notes. Washington: Board of Governors of the Federal Reserve System, October 21, 2022.
- de Soyres, François, Dylan Moore and Julio L. Ortiz (2023). " Accumulated savings during the Pandemic: an international comparison with historical perspective." FEDS Notes. Washington: Board of Governors of the Federal Reserve System, June 23, 2023.
- Hamilton, James D. (2018). "Why You Should Never Use the Hodrick-Prescott Filter," The Review of Economics and Statistics, vol. 100 (5), pages 831-843.
APPENDIX
As an important background, the figure below presents the evolution of the savings rate in the U.S. since 1950. We notice that the savings rate was on an increasing trend until the mid-1970s, then turned on a negative trend until the mid-2000s, before returning to a new upward sloping trend since then.
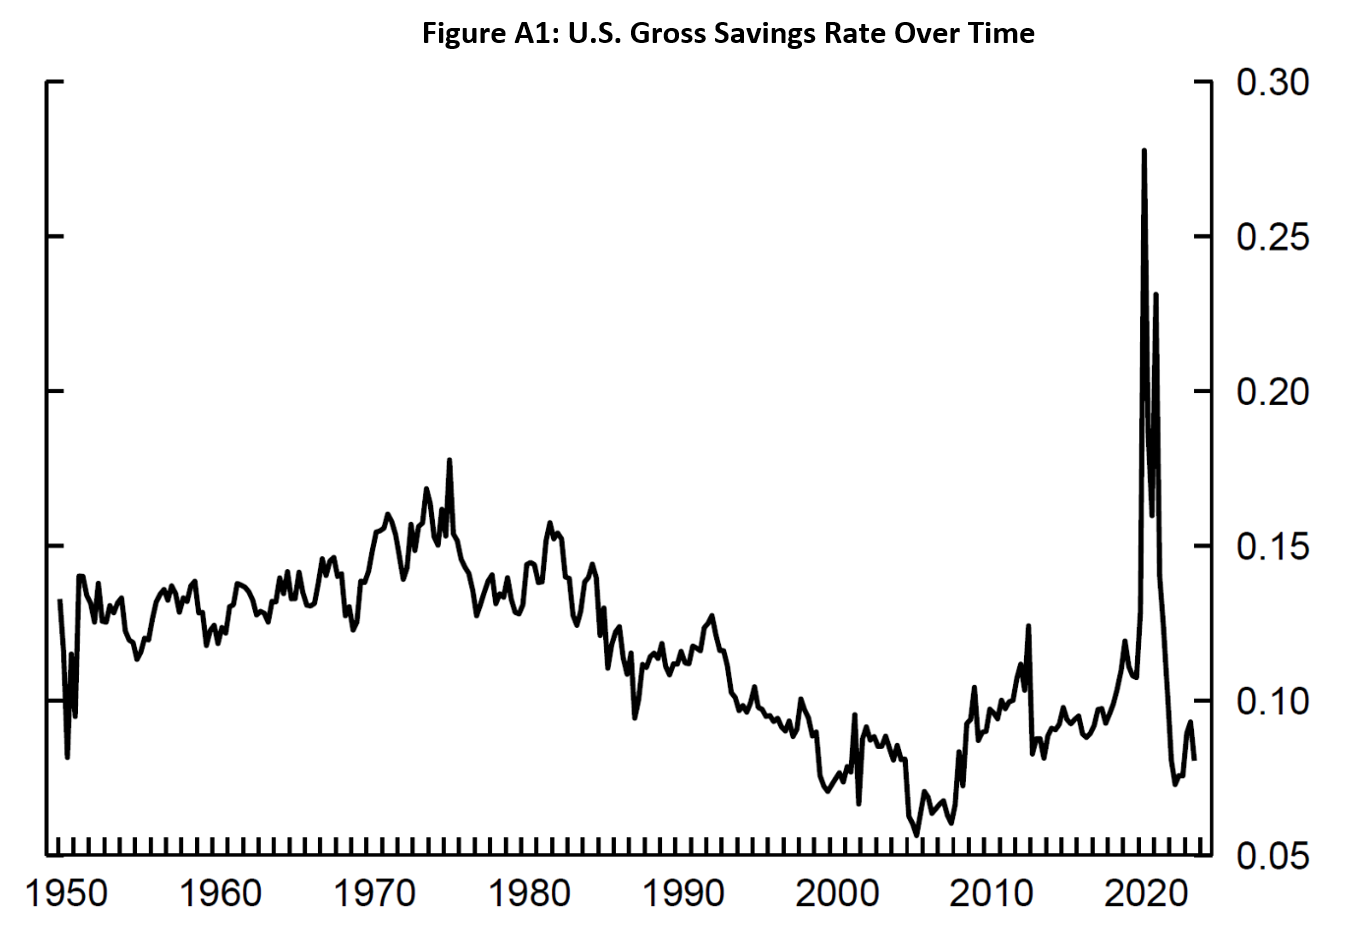
Note: The figure plots the monthly U.S. gross savings rate from 1950q1 to 2023q3. The gross savings rate is defined as the sum of net savings and consumption of fixed capital divided by disposable personal income.
Source: Haver Analytics; authors' calculations.
1. François de Soyres ([email protected]), Dylan Moore ([email protected]) and Julio Ortiz ([email protected]) are with the Board of Governors of the Federal Reserve System. The views expressed in this note are our own, and do not represent the views of the Board of Governors of the Federal Reserve, nor any other person associated with the Federal Reserve System. Return to text
2. Our updated estimates reflect newly released data as well as historical revisions. Return to text
3. We choose to display our linear trend estimate here rather than our Hamilton filter estimate to showcase the difference between excess savings estimates based solely on the level of nominal savings and the savings rate. The Hamilton filter approach extracts a time varying trend which is another difference relative to these other estimates. Return to text
4. For reference, we plot the evolution of the U.S. savings rate from 1950 in the appendix. The U.S. savings rate exhibits important low-frequency variations that could favor a time-varying trend estimation, such as the Hamilton filter. That said, given the short duration of the COVID episode, one could potentially favor a linear trend. We do not take a firm stand in this debate and show the results using both methodologies. Return to text
de Soyres, François, Dylan Moore, and Julio Ortiz (2023). "An update on Excess Savings in Selected Advanced Economies," FEDS Notes. Washington: Board of Governors of the Federal Reserve System, December 15, 2023, https://doi.org/10.17016/2380-7172.3426.
Disclaimer: FEDS Notes are articles in which Board staff offer their own views and present analysis on a range of topics in economics and finance. These articles are shorter and less technically oriented than FEDS Working Papers and IFDP papers.