FEDS Notes
June 12, 2020
Assessing the Resiliency of Non-DFAST Banks to a Financial Shock
Kevin F. Kiernan and Cindy M. Vojtech1
1. Summary
Every year the Federal Reserve Board conducts stress tests on large bank holding companies (BHCs) to ensure that those institutions will remain healthy enough to lend to households and businesses even in a significant downturn. This note analyzes the resiliency of the banking industry by also stressing banks that are not subject to that annual Dodd-Frank Act stress test (DFAST). This is a more complete stress shock than Vojtech (2019) because it captures banks of all sizes and stresses the entire bank. The earlier analysis focused on BHCs larger than $3 billion and on a specific vulnerability: commercial real estate. Also note that this stress shock exercise was completed prior to disruptions caused by the COVID-19 pandemic. If larger losses than DFAST are used, more banks would fall below regulatory thresholds.
Non-DFAST banks make up roughly 25 percent of banking assets. While it is unlikely for a systemic risk to originate from this minority, it is important to understand potential vulnerabilities in this part of the banking system because widespread failures among this group could materially affect regional economic performance and exacerbate a downturn. In addition to the size disparity, there are significant differences between DFAST and non-DFAST banks in terms of balance sheet composition and loan portfolio composition.2 Loans make up a larger share of total assets at non-DFAST banks than at their DFAST counterparts (figure 1). There is also variation within loan holdings (figure 2). Non-DFAST banks hold more of their portfolio in commercial real estate (CRE) loans and less in commercial and industrial (C&I) loans. Thus, banks in this sector may be susceptible to common shocks, making their performance highly correlated. Almost all credit card loans are held by DFAST banks while almost all farm loans are held by non-DFAST banks. On the other hand, the two bank groups hold similar shares of their loan book in mortgages.
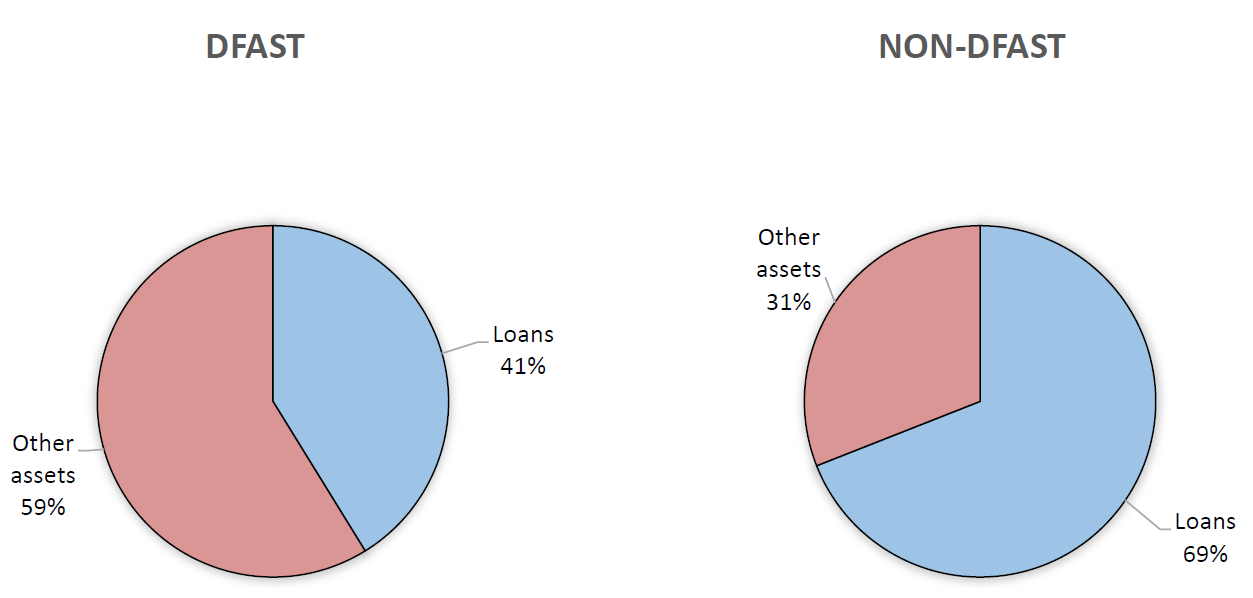
Source: Federal Reserve Board, Form FR Y-9C, Consolidated Financial Statements for Bank Holding Companies; Consolidated Reports of Condition and Income, FFIEC 031/041.
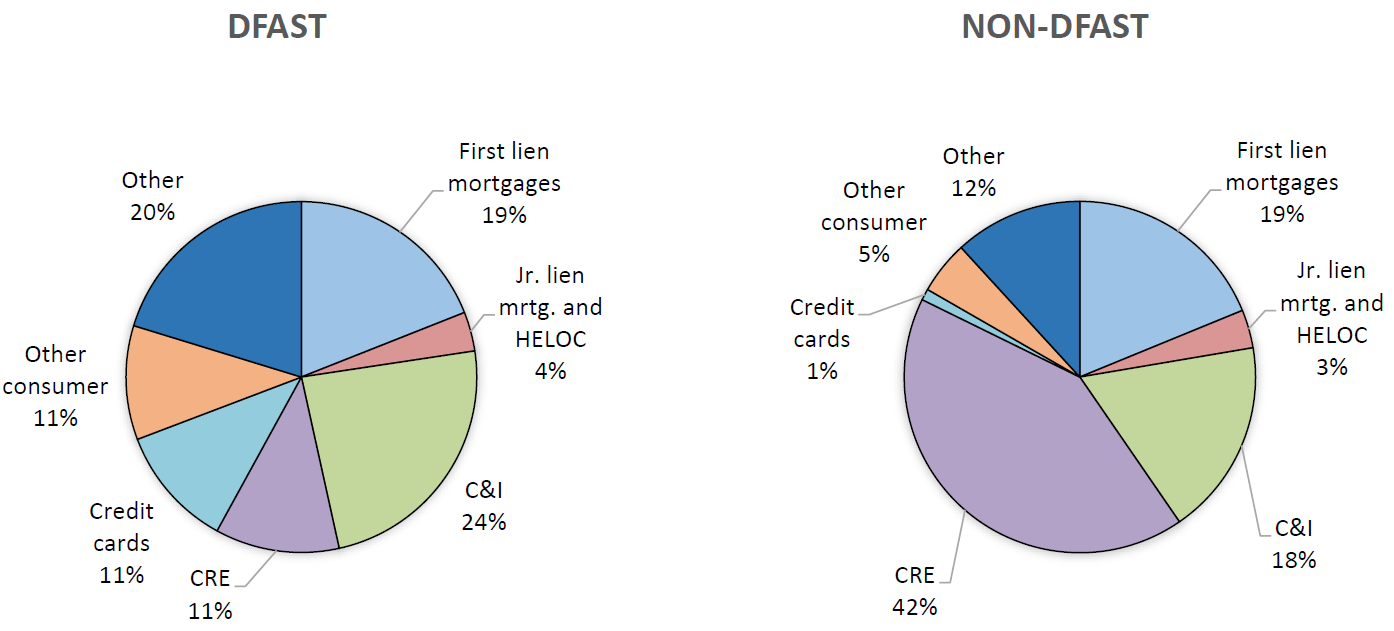
Source: Federal Reserve Board, Form FR Y-9C, Consolidated Financial Statements for Bank Holding Companies; Consolidated Reports of Condition and Income, FFIEC 031/041.
Common equity tier 1 (CET1) capital is the highest quality of capital in the regulatory framework. As shown in figure 3, non-DFAST banks, on average, fund more of their balance sheet with such capital than DFAST banks. However, even those higher capital buffers did not protect this sector from bank failures during the Global Financial Crisis (GFC). This figure also illustrates the dramatic increase in capital following the GFC with DFAST banks more than doubling their capital ratios. This significant increase in capital at the largest banks is partially driven by new regulations such as stress testing.
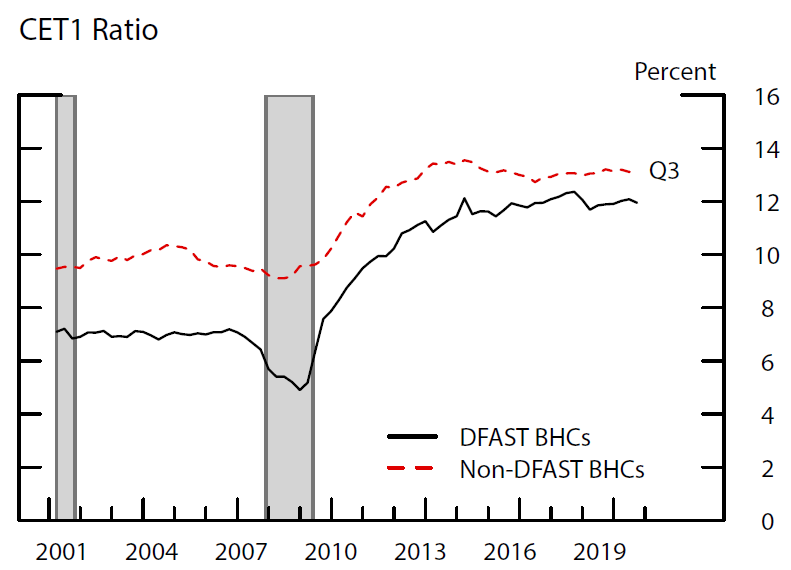
Note: DFAST group is defined as the 33 BHCs from the 2018 exercise. Shaded areas are NBER recessions.
Source: Federal Reserve Board, Form FR Y-9C, Consolidated Financial Statements for Bank Holding Companies; Consolidated Reports of Condition and Income, FFIEC 031/041.
Those larger capital stocks offer strong protection from a variety of stresses. After applying the loss rates generated by the DFAST 2017, 2018, and 2019 exercises, our analysis shows that the vast majority of banks would have enough capital to weather a large negative shock without dipping below regulatory minimums. A small number of banks in our sample breach the minimum 4.5 percent CET1 threshold, and these banks represent less than 2 percent of banking system assets. However, using a higher threshold, the banks falling below 7 percent CET1 (the minimum plus the required capital conservation buffer) represent 4 to 11 percent of industry assets depending on the severity of the DFAST loss rates. The easiest method of restoring capital for banks that fall below 7 percent is to reduce lending, which could have adverse effects on the communities they serve.
The regulatory agencies recently finalized rules allowing community banks (banks with less than $10 billion in consolidated assets) to qualify for simplified regulatory requirements if their regulatory leverage ratio is above 9 percent.3 About one-third of the banks that fall below the 4.5 percent CET1 minimum in this hypothetical exercise are banks that currently qualify for simplification under this new regulation. However, these banks make up a very small portion of the industry, less than 4 percent of community banking assets, and community banks have 7 percent of industry assets.
Finally, geographic analysis of the stress losses shows that some states' deposits are more concentrated in banks falling below the 7 percent threshold. Those states could face more credit contraction in an economic downturn should banks need to shore up their capital positions. For example, averaging across DFAST results and using the most conservative loss projection method, 17 states have 20 percent or more of their deposit base exposed to banks that fall below a 7 percent CET1 ratio.
2. Data
All analysis in this note is done at the BHC level or at the bank level for banks without a holding company. For BHCs that file the FR Y-9C (since 2018:Q3, those with greater than $3 billion in assets), the consolidated financial information from that form is used. In 2019:Q3, there were 322 Y-9C BHCs comprising 86 percent of total loans and 91 percent of total assets in our sample. For the remaining institutions, Call Reports are used (FFIEC 031/041). Using relationship tables from the National Information Center (NIC), the results reported by commercial banks are rolled up to the parent holding company level. In this way, approximately 4,000 additional small banks are included. Throughout this note, the terms "banks" and "BHCs" are used interchangeably to refer to the set of parent holding companies and standalone commercial banks. We drop thrifts and financial holding companies that are not classified as BHCs.
To obtain estimates of loan losses, the public DFAST disclosures are used.4 These disclosures contain loan loss amounts by loan category for each of the DFAST BHCs. These values are used to project loan losses for the non-DFAST banks. Each loss projection method is tied to a particular DFAST exercise which carries a particular set of loss rates across loan portfolios and participating BHCs. Using our definition of BHCs, there are 32 stress-tested BHCs in DFAST 2017, 33 in 2018, and 16 in 2019.
3. Stress Test Analysis
In order to project capital at the end of the 9-quarter stress horizon, we start with the jump-off CET1 capital as of September 30, 2019. We add net income and subtract dividends over the forecast horizon. This generates ending CET1 capital. The forecasting methods for net income and dividends are described in the subsections that follow. Risk-weighted assets (RWA), the denominator of the CET1 ratio, are assumed to remain constant at the jump-off value for each bank. This constant RWA assumption has macroprudential benefits in that it does not allow banks to shrink their balance sheets in order to meet regulatory minimums. Such "shrinking to health" curtails credit provision. However, in a stress event, banks are likely to tighten lending standards as uncertainty rises, and banks will likely face lower demand from borrowers, putting downward pressure on RWA. At the same time, delinquent loans have higher risk weights than loans that remain current, and borrowers have historically drawn down existing credit lines in periods of stress, both of which put upward pressure on RWA. As a result, our assumption implies that these factors about offset.
3.1. Projection of Pre-Provision Net Revenue
In order to accurately estimate the overall effect of a nine-quarter severely adverse scenario, it is necessary to not only estimate loan losses but to estimate the pre-provision net revenue (PPNR) that an institution is likely to generate during the stress period. PPNR is defined as net interest income (interest income – interest expense) plus noninterest income minus noninterest expense. The composition of PPNR for non-DFAST BHCs is much different than DFAST BHCs. As a result, using DFAST disclosure data for PPNR is not practical. Instead, we use the experience during the GFC to generate PPNR forecasts. Specifically, we calculate the average percentage point decrease in nine-quarter PPNR as a share of assets during the GFC for each bank group (DFAST BHCs and non-DFAST BHCs). This decrease is then applied to each bank's cumulative trailing nine-quarter PPNR as a share of assets on September 30, 2019. As a robustness test, we also run the analysis using 80 percent and 120 percent of the total nine-quarter revenue. For comparison, the decline in PPNR as a share of assets for non-DFAST BHCs was approximately three times the size of the decline for DFAST BHCs during the GFC.
3.2. Net Income and Dividend Assumptions
To generate net income from PPNR, we need to account for loan loss provisions and income taxes. The provisions are set equal to the estimated loan losses. This effectively assumes that each bank will have the same level of loan loss reserves at the beginning and end of the exercise. The loan loss provision estimation techniques are described in the next subsection. Income taxes are projected using a 21 percent income tax rate, except for S corporations which are assumed to have a 0 percent tax rate.5
For the actual stress test, DFAST BHCs are assumed to pay the same annual dividend they did in the prior four quarters, but to discontinue repurchases. We follow the same assumption for our exercise. As shown in figure 4, since 2016, the DFAST BHCs have significantly increased the amount of capital returned to shareholders in the form of both dividends and share repurchases. Payout rates at these BHCs are now around 80 percent of net income available to common shareholders (NIAC). Non-DFAST BHCs have not exhibited this behavior, having maintained payout rates around 40 percent since 2015. In addition, non-DFAST BHCs primarily rely on dividends to return capital rather than repurchases. This is an important distinction in terms of vulnerabilities because the financial crisis demonstrated that banks were less willing to stop paying dividends than to stop repurchasing shares.6
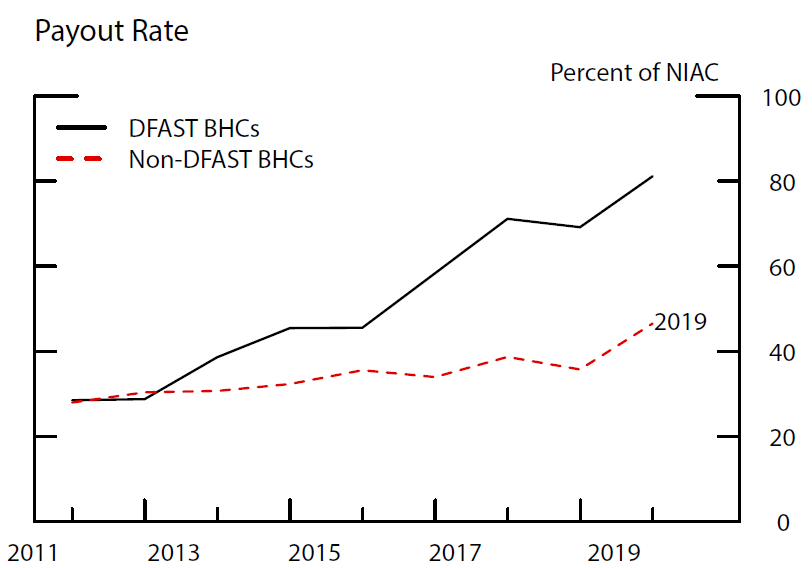
Note: The DFAST group is defined as the 33 BHCs from the 2018 exercise. Payout rate is defined as treasury stock purchases plus dividends on common shares plus retirements of common stock, and is shown as a percent of net income available to common shareholders (NIAC).
Source: Federal Reserve Board, Form FR Y-9C, Consolidated Financial Statements for Bank Holding Companies; Consolidated Reports of Condition and Income, FFIEC 031/041.
3.3. Loan Loss Analysis
For the DFAST BHCs in each exercise year, loan loss rates are available from the public stress test disclosures. Using the loan-category loss rates across BHCs, it is possible to estimate the losses that BHCs that are not subject to the stress test might have suffered under the severely adverse scenario. We use several techniques to arrive at loan loss estimates for the non-DFAST banks. The simplest estimation technique is the application of the DFAST averages to the non-DFAST BHCs. This method assumes that the average loss rate for each loan category across the DFAST BHCs in a given stress test exercise will be experienced by each non-DFAST BHC. Table 7 in the appendix reports the average DFAST loss rates by loan category.
Table 1 summarizes the industry-level results of the resiliency tests using our PPNR and dividend assumptions along with the loan loss information from DFAST 2017, 2018, and 2019. Columns 1, 4 and 7 show the results from the DFAST average. The first row shows that 69 BHCs are estimated to fall below the 4.5 percent minimum CET1 requirement using 2017 data, and the second row shows that these BHCs together represent 0.5 percent of banking assets. Using 2018 and 2019 data, the estimated industry effect is at most 1.8 percent of banking assets. The bottom two rows follow the same logic but use a 7.0 percent threshold that is equal to the minimum requirement and the capital conservation buffer of 2.5 percentage points. The number of banks projected to fall below 7.0 percent CET1 more than quadruples under this higher threshold, and the overall effect on banking assets is up to 6 percent, which is achieved when using the DFAST 2018 loan loss estimates. For comparison, 414 banks actually failed between 2008 and 2011.7
Table 1: Summary of Resiliency Tests for Banking System
| DFAST year: | 2017 | 2018 | 2019 | ||||||
|---|---|---|---|---|---|---|---|---|---|
| Estimation method: | (1) Avg. |
(2) OLS |
(3) QREG |
(4) Avg. |
(5) OLS |
(6) QREG |
(7) Avg. |
(8) OLS |
(9) QREG |
| Below 4.5 percent CET1 ratio | |||||||||
| BHCs [number] | 69 | 66 | 131 | 115 | 128 | 274 | 56 | 66 | 175 |
| Percent of banking assets [percent] | 0.5 | 0.3 | 0.6 | 0.9 | 0.6 | 1.6 | 1.8 | 0.8 | 1.3 |
| Below 7.0 percent CET1 ratio | |||||||||
| BHCs [number] | 307 | 368 | 585 | 525 | 579 | 942 | 236 | 373 | 679 |
| Percent of banking assets [percent] | 3.5 | 4.0 | 5.4 | 5.6 | 6.1 | 9.8 | 3.7 | 6.5 | 10.8 |
Source: Federal Reserve Board, Form FR Y-9C, Consolidated Financial Statements for Bank Holding Companies; Consolidated Reports of Condition and Income, FFIEC 031/041.
In an extension of Vojtech (2019), this note uses a second estimation technique by relating loan category loss rates to the bank-specific composition of the categories for which more granular information is available. Table 2 shows a breakdown of the DFAST loan categories for which more detail is available in bank regulatory reports. Using this additional detail, we are able to more accurately match bank losses in a given category to the nature of their lending in that category. This is done through a regression framework of the form
$$$$ \hat{y} = \alpha + \beta X, $$$$ where $$X$$ is the vector of shares of the components for the given loan category, with one category dropped for collinearity. For example, CRE is estimated as
$$$$ {CRE\ loss\ rate} = \alpha + \beta_1 {share\ of\ CRE\ loans\ in\ construction} + \beta_2 {share\ of\ CRE\ loans\ in\ multifamily}. $$$$In order to ensure the loss rate from each DFAST BHC contains useful information, that BHC must have at least 2.5 percent of its portfolio held in the category (table 2, column 1). For junior lien mortgages, a 1.0 percent threshold is used to support a large enough sample. We perform this loan composition estimation both in the form of a standard ordinary least squares (OLS) regression and in a quantile regression at the 75th percentile. Table 8 in the appendix details the number of firms included in each regression based on the thresholds described.
The results using the average loss rate estimates accounting for these loan composition effects are shown in table 1 (columns 2, 5, and 8). The estimated number of firms that experience stress is similar to the simple average method, and the effect as a percent of industry assets is muted. In 2017, using this additional granularly, 66 banks fall below the 4.5 percent minimum threshold, and these banks consist of 0.3 percent of industry assets. The number of firms that fall below the 7.0 percent threshold is larger than in the simpler approach, but the share of total BHC assets remains about the same at 4 percent. Overall, these results suggest that these additional firms are holding more of the riskier types of loans within the disclosure categories, such as construction and land development loans within their CRE portfolios.
Table 2: DFAST Loan Category Components
| DFAST Loan Category | Granular Components |
|---|---|
| First Lien Mortgage | None |
| Junior Lien Mortgage & HELOC | 1. Junior lien mortgage |
| 2. HELOC* | |
| C&I | None |
| CRE | 1. Construction & land development |
| 2. Multifamily | |
| 3. Nonfarm nonresidential* | |
| Credit Cards | None |
| Other Consumer | 1. Auto loans |
| 2. Other consumer loans* | |
| Other | 1. Loans to banks |
| 2. Loans to nonbank financials | |
| 3. Other loans** |
* designates the dropped category. Return to table
** Farm loans and loans to foreign governments were also included in other loans because DFAST BHCs do not have a lot of these types of loans. Regression coefficients were volatile when the further breakout was used. Return to table
The results using the more detailed data (i.e., table 2) and quantile regressions at the 75th percentile are also shown in table 1 (columns 3, 6, and 9). Because this is a much more conservative assumption (higher loan loss rates), more banks are projected to fall below the thresholds. When using the most conservative assumption and the most severe scenario (2019 DFAST, column 9), 11 percent of banking assets are affected at the 7.0 percent threshold.
As a robustness test, panels A and B of table 6 in the appendix show the results of the estimation exercises with the banks' PPNR adjusted downward and upward, respectively. The results are broadly similar to the main results with a small number of non-DFAST BHCs representing a small share of system assets falling below the 4.5 percent threshold and a much larger number falling below 7.0 percent. Comparing the most severe scenarios across the two PPNR assumptions, banks falling below 7.0 percent CET1 represent 7 percent of industry assets or 15 percent of industry assets. This sensitivity of changes to the PPNR assumption demonstrates the importance of bank profitability in mitigating the effects of negative shocks.
As mentioned above, regulators have recently approved rules whereby community banks (defined as those with consolidated assets below $10 billion) can operate under simplified regulations if they maintain regulatory leverage ratios above 9.0 percent.8 We identify 3,423 banks that meet those requirements as of September 30, 2019 and see how they perform under the loss estimates described above. Those results are summarized in table 3. Across the various loss estimation methods, some community banks fall below the 4.5 percent CET1 ratio and large numbers fall below the 7.0 percent threshold. These results suggest that the loss absorbency of a high leverage ratio may not be sufficient for some banks. However, banks falling below the 4.5 percent threshold make up less than 4 percent community banking assets, or 0.3 percent of industry assets. Using the 7.0 percent threshold, industry effects are still limited to 1.5 percent of industry assets.
Table 3: Resiliency for Community Banks: BHCs with Total Assets Below $10 billion and a Leverage Ratio Greater than 9.0 percent
| DFAST year: | 2017 | 2018 | 2019 | ||||||
|---|---|---|---|---|---|---|---|---|---|
| Estimation method: | (1) Avg. |
(2) OLS |
(3) QREG |
(4) Avg. |
(5) OLS |
(6) QREG |
(7) Avg. |
(8) OLS |
(9) QREG |
| Below 4.5 percent CET1 ratio | |||||||||
| Community BHCs [number] | 23 | 20 | 40 | 39 | 41 | 101 | 18 | 20 | 60 |
| Percent of CB assets [percent] | 0.8 | 0.8 | 1.3 | 1.2 | 1.3 | 3.4 | 0.4 | 0.6 | 1.7 |
| Below 7.0 percent CET1 ratio | |||||||||
| Community BHCs [number] | 117 | 146 | 278 | 236 | 266 | 492 | 87 | 154 | 342 |
| Percent of CB assets [percent] | 4.3 | 5.4 | 9.9 | 10.6 | 10.1 | 20.7 | 3.3 | 5.7 | 13.2 |
| Number of community banks >9.0 percent leverage ratio | |||||||||
| Start | 3,423 | 3,423 | 3,423 | 3,423 | 3,423 | 3,423 | 3,423 | 3,423 | 3,423 |
| End | 1,811 | 1,345 | 1,096 | 1,571 | 1,132 | 861 | 1,975 | 1,372 | 1,056 |
| Difference | 1,612 | 2,078 | 2,327 | 1,852 | 2,291 | 2,562 | 1,448 | 2,051 | 2,367 |
Source: Federal Reserve Board, Form FR Y-9C, Consolidated Financial Statements for Bank Holding Companies; Consolidated Reports of Condition and Income, FFIEC 031/041;
If a bank falls below the 7.0 percent threshold, it is using its conservation buffer. As a result, that bank would face restrictions on payout policies which would decrease the possibility of the bank falling below the regulatory minimum of 4.5 percent. For the banks that fell below 4.5 percent under our hypothetical scenarios, we rerun the stress tests and turn off dividends. Table 4 summarizes the results. Stopping dividend payments stops about half the banks from breaching regulatory minimums.
Table 4: Summary of Resiliency Tests Without Dividends BHCs that fall below 4.5 percent CET1 ratio
| DFAST year: | 2017 | 2018 | 2019 | ||||||
|---|---|---|---|---|---|---|---|---|---|
| Estimation method: | (1) Avg. |
(2) OLS |
(3) QREG |
(4) Avg. |
(5) OLS |
(6) QREG |
(7) Avg. |
(8) OLS |
(9) QREG |
| Original | |||||||||
| BHCs [number] | 69 | 66 | 131 | 115 | 128 | 274 | 56 | 66 | 175 |
| Percent of banking assets [percent] | 0.5 | 0.3 | 0.6 | 0.9 | 0.6 | 1.6 | 1.8 | 0.8 | 1.3 |
| No dividend | |||||||||
| BHCs [number] | 39 | 32 | 52 | 53 | 55 | 116 | 32 | 32 | 74 |
| Percent of banking assets [percent] | 0.2 | 0.1 | 0.2 | 0.4 | 0.2 | 0.5 | 1.5 | 0.6 | 0.7 |
| Community Banks | |||||||||
| Original | |||||||||
| Community BHCs [number] | 23 | 20 | 40 | 39 | 41 | 101 | 18 | 20 | 60 |
| Percent of CB assets [percent] | 0.8 | 0.8 | 1.3 | 1.2 | 1.3 | 3.4 | 0.4 | 0.6 | 1.7 |
| No dividend | |||||||||
| Community BHCs [number] | 10 | 7 | 13 | 13 | 13 | 34 | 8 | 7 | 21 |
| Percent of CB assets [percent] | 0.1 | 0.1 | 0.3 | 0.2 | 0.3 | 0.8 | 0.1 | 0.1 | 0.5 |
Source: Federal Reserve Board, Form FR Y-9C, Consolidated Financial Statements for Bank Holding Companies; Consolidated Reports of Condition and Income, FFIEC 031/041;
Another way to assess the resiliency of BHCs is to understand the sources of their vulnerabilities. Namely, what loan portfolios are driving losses? Figure 5 shows loan loss composition for the DFAST BHCs and the non-DFAST BHCs across the three estimation methods. The loan loss rates from DFAST 2017, 2018, and 2019 are applied to the loan types, and composition graphs are generated using the average dollar loss estimate for each loan type across the three DFAST exercises. As highlighted in Vojtech (2019), CRE is much more important for the non-DFAST BHCs (purple). Approximately half of non-DFAST loan losses come from CRE. As expected, given less exposure to credit card loans, non-DFAST BHCs have a much smaller percent of their losses from credit cards (light blue). The composition of losses is about the same across the three estimation methods. However, the dollar losses range from an average of $193 billion to $243 billion.
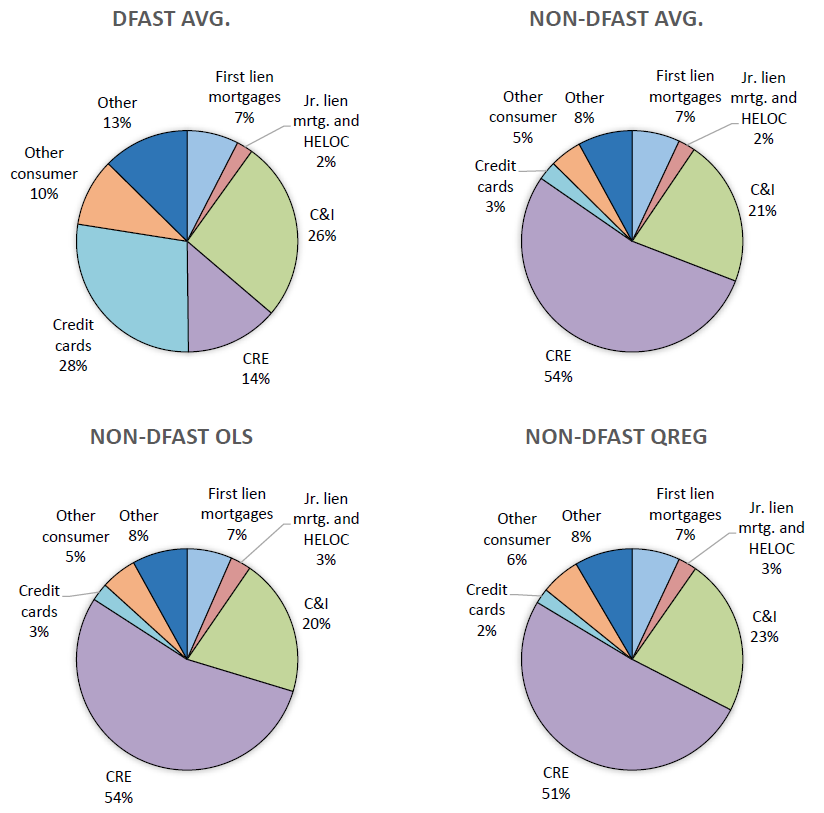
This figure shows the composition of loan losses for DFAST BHCs and loan losses for non-DFAST BHCs using the three estimation methods described above. OLS is the loan composition method, and QREG is the quantile regression at the 75th percentile using the loan composition detail.
Source: Federal Reserve Board, Form FR Y-9C, Consolidated Financial Statements for Bank Holding Companies; Consolidated Reports of Condition and Income, FFIEC 031/041; DFAST 2017 results, DFAST 2018 results, DFAST 2019 results.
4. Geographic Analysis
A final way to assess the resiliency of the entire financial system is to understand what geographic areas are more vulnerable to a severe shock. Using FDIC Summary of Deposit data, we match those BHCs that fall below the 7.0 percent CET1 threshold to their deposits in each state. Those states that have a higher share of deposits in such banks are likely to have more financial strain. The shares of such deposits in each state averaged across the three years of DFAST exercises in this analysis are summarized in table 5. For brevity only two forecast methods are shown—average and quantile—that generally capture the forecast range, somewhat mild to severe. Using the average method, 11 states have more than 10 percent of their deposit base affected (column 2). However, under the much harsher assumption using a quantile regression at the 75th percentile, 17 states have 20 percent or more of their deposit base exposed to BHCs with CET1 ratios estimated to be less than 7.0 percent. Note that while some of these states have high exposures, they represent a small portion of the national deposit base. Those shares are listed in columns 3 and 6.
Table 5: Forecasts Averaging Across DFAST 2017, 2018, and 2019
Percentage points
| (1) | (2) | (3) | (4) | (5) | (6) | |
|---|---|---|---|---|---|---|
| State | Average | State Shr.Of U.S. | State | Quantile | State Shr.Of U.S. | |
| 1 | Vermont | 31.3 | 0.1 | Tennessee | 43.6 | 1.3 |
| 2 | Connecticut | 21.8 | 1.1 | Vermont | 39.7 | 0.1 |
| 3 | Tennessee | 17.7 | 1.3 | Mississippi | 36.8 | 0.4 |
| 4 | Pennsylvania | 13.4 | 3.2 | Arkansas | 28.0 | 0.6 |
| 5 | Rhode Island | 13.3 | 0.2 | Alabama | 27.1 | 0.8 |
| 6 | New Hampshire | 12.9 | 0.3 | Iowa | 27.1 | 0.7 |
| 7 | Iowa | 12.7 | 0.7 | Oklahoma | 25.4 | 0.7 |
| 8 | North Dakota | 12.6 | 0.2 | Connecticut | 25.2 | 1.1 |
| 9 | Alabama | 11.4 | 0.8 | Rhode Island | 25.0 | 0.2 |
| 10 | Maine | 10.8 | 0.2 | North Dakota | 24.2 | 0.2 |
| 11 | Kansas | 10.3 | 0.6 | Michigan | 23.8 | 1.8 |
| 12 | Oklahoma | 9.9 | 0.7 | New Hampshire | 22.7 | 0.3 |
| 13 | New Jersey | 9.6 | 2.7 | Wisconsin | 22.6 | 1.2 |
| 14 | Washington | 9.4 | 1.3 | Ohio | 21.9 | 2.9 |
| 15 | Alaska | 8.9 | 0.1 | Pennsylvania | 21.5 | 3.2 |
| 16 | Wisconsin | 8.9 | 1.2 | Louisiana | 20.1 | 0.8 |
| 17 | Mississippi | 8.8 | 0.4 | Georgia | 20.0 | 2.0 |
| 18 | Oregon | 8.4 | 0.6 | Alaska | 19.0 | 0.1 |
| 19 | Nebraska | 8.3 | 0.5 | Nebraska | 18.1 | 0.5 |
| 20 | Massachusetts | 7.4 | 3.2 | Indiana | 17.9 | 1.1 |
Source: Federal Deposit Insurance Corporation, Summary of Deposits (June 2018); Federal Financial Institutions Examination Council, Form FFIEC 031, Consolidated Reports of Condition and Income for a Bank with Domestic and Foreign Offices, and Form FFIEC 041, Consolidated Reports of Condition and Income for a Bank with Domestic Offices Only (December 31, 2018); Federal Reserve Board, Form FR Y-9C, Consolidated Financial Statements for Bank Holding Companies;
References
Hirtle, Beverly (2016). "Bank Holding Company Dividends and Repurchases during the Financial Crisis," Federal Reserve Bank of New York Staff Reports, no. 666, March 14, revised April 2016, https://www.newyorkfed.org/research/staff_reports/sr666.html.
Vojtech, Cindy M. (2019). "Assessing the Resiliency of the Banking Industry to a Commercial Real Estate Price Shock," FEDS Notes. Washington: Board of Governors of the Federal Reserve System, May 30, 2019, https://doi.org/10.17016/2380-7172.2380.
Appendix
Table 6: Robustness Tests for Banking System
Panel A: 80 percent of Baseline Nine-quarter PPNR
| DFAST year: | 2017 | 2018 | 2019 | ||||||
|---|---|---|---|---|---|---|---|---|---|
| Estimation method: | (1) Avg. |
(2) OLS |
(3) QREG |
(4) Avg. |
(5) OLS |
(6) QREG |
(7) Avg. |
(8) OLS |
(9) QREG |
| Below 4.5 percent CET1 ratio | |||||||||
| BHCs [number] | 90 | 95 | 187 | 143 | 191 | 369 | 68 | 93 | 242 |
| Percent of banking assets [percent] | 0.8 | 0.5 | 0.9 | 1.0 | 1.2 | 3.2 | 1.9 | 0.9 | 1.9 |
| Below 7.0 percent CET1 ratio | |||||||||
| BHCs [number] | 435 | 480 | 796 | 701 | 787 | 1,189 | 320 | 503 | 919 |
| Percent of banking assets [percent] | 7.5 | 7.8 | 10.8 | 11.0 | 11.8 | 14.8 | 8.4 | 9.9 | 14.4 |
Panel B: 120 percent of Baseline Nine-quarter PPNR
| DFAST year: | 2017 | 2018 | 2019 | ||||||
|---|---|---|---|---|---|---|---|---|---|
| Estimation method: | (1) Avg. |
(2) OLS |
(3) QREG |
(4) Avg. |
(5) OLS |
(6) QREG |
(7) Avg. |
(8) OLS |
(9) QREG |
| Below 4.5 percent CET1 ratio | |||||||||
| BHCs [number] | 61 | 57 | 96 | 94 | 100 | 212 | 54 | 58 | 127 |
| Percent of banking assets [percent] | 0.4 | 0.2 | 0.3 | 0.6 | 0.3 | 0.9 | 1.8 | 0.7 | 0.9 |
| Below 7.0 percent CET1 ratio | |||||||||
| BHCs [number] | 248 | 264 | 436 | 394 | 440 | 738 | 170 | 272 | 527 |
| Percent of banking assets [percent] | 1.6 | 1.4 | 3.1 | 2.6 | 3.1 | 6.5 | 2.4 | 2.5 | 5.7 |
Source: Federal Reserve Board, Form FR Y-9C, Consolidated Financial Statements for Bank Holding Companies; Consolidated Reports of Condition and Income, FFIEC 031/041.
Table 7: Average DFAST Loss Rates by Loan Category
Percentage points
| 2017 | 2018 | 2019 | |
|---|---|---|---|
| First lien mortgages | 2.2 | 2.7 | 1.4 |
| Jr. lien mrtg. and HELOC | 4.5 | 4.9 | 2.6 |
| C&I | 6.4 | 7.3 | 6.3 |
| CRE | 7 | 8.3 | 6.4 |
| Credit cards | 13.7 | 14.4 | 16.8 |
| Other consumer | 5.9 | 5.5 | 4.7 |
| Other | 3.6 | 4 | 3.6 |
| Total | 5.8 | 6.4 | 5.7 |
Source: Federal Reserve Board, Form FR Y-9C, Consolidated Financial Statements for Bank Holding Companies; Consolidated Reports of Condition and Income, FFIEC 031/041.
Table 8: Sample Sizes for Loss Rate Regressions
Firm count
| Loan Category | 2017 | 2018 | 2019 |
|---|---|---|---|
| Jr. lien mortgage & HELOC | 25 | 24 | 10 |
| Commercial real estate | 28 | 29 | 15 |
| Other consumer loans | 25 | 27 | 11 |
| Other loans | 29 | 29 | 16 |
Note: Sample is restricted to firms with greater than 2.5 percent of total loans in each category except for Jr. Lien Mortgages and HELOC where the threshold is 1 percent.
Source: Federal Reserve Board, Form FR Y-9C, Consolidated Financial Statements for Bank Holding Companies.
1. The analysis in this note is based entirely on publicly available information. We thank William Bassett, Jose Berrospide, Andrew Cohen, and Robert Sarama for comments. Return to text
2. For the summary statistics in the first part of this note, the DFAST group is defined using the BHCs subject to the 2018 test. The non-DFAST group is defined as all other banking institutions. The 2018 DFAST BHCs are: Ally Financial, American Express, Bank of America, Bank of New York Mellon, Barclays, BB&T, BBVA Compass, BMO Financial, BNP Paribas USA (formerly BancWest), Capital One, Citigroup, Citizens Financial, Deutsche Bank, Discover, Fifth Third, Goldman Sachs, HSBC, Huntington, JPMorgan, KeyCorp, M&T Bank, Morgan Stanley, MUFG, Northern Trust, PNC Financial, RBC USA, Regions Financial, Santander, State Street, SunTrust, TD Group, U.S. Bancorp, and Wells Fargo. All BHCs above $3 billion in consolidated assets are captured through a mandatory filing, the FR Y-9C form. All other BHCs and standalone banks are captured using Call Report (FFIEC 031 and 041) data. Return to text
3. See the related press release here https://www.federalreserve.gov/newsevents/pressreleases/bcreg20191029a.htm. Return to text
4. 2017: https://www.federalreserve.gov/publications/files/2017-dfast-methodology-results-20170622.pdf Return to text
2018: https://www.federalreserve.gov/publications/files/2018-dfast-methodology-results-20180621.pdf
2019: https://www.federalreserve.gov/publications/files/2019-dfast-results-20190621.pdf
5. We do not account for deferred tax assets (DTAs) because we are not calculating a quarter-by-quarter estimate of net income. If DTAs were included, they would offset losses and perhaps keep some banks from falling below regulatory capital thresholds. Return to text
6. See for example Hirtle (2016). Return to text
7. Based on Federal Deposit Insurance Corporation (FDIC) bank failure data. Return to text
8. In order to match the regulation as closely as possible, we also exclude banks with off-balance sheet exposures greater than 25 percent of assets or combined trading assets and liabilities greater than 5 percent of assets. Using the public data, off-balance sheet exposures are the sum of unused commitments, letters of credit, sold credit derivative protection, securities lending and borrowing, and off-balance sheet securitization exposures. Return to text
Kiernan, Kevin F., and Cindy M. Vojtech (2020). "Assessing the Resiliency of Non-DFAST Banks to a Financial Shock," FEDS Notes. Washington: Board of Governors of the Federal Reserve System, June 12, 2020, https://doi.org/10.17016/2380-7172.2514.
Disclaimer: FEDS Notes are articles in which Board staff offer their own views and present analysis on a range of topics in economics and finance. These articles are shorter and less technically oriented than FEDS Working Papers and IFDP papers.