FEDS Notes
July 15, 2022
Fiscal policy and excess inflation during Covid-19: a cross-country view
François de Soyres, Ana Maria Santacreu and Henry Young1
The recent surge in inflation in many countries around the world and the fiscal stimulus provided in the face of the COVID-19 pandemic has renewed interest in analyzing the potential role of large fiscal spending as a driver of price increases.
In this note, we examine how fiscal support impacted the balance between supply and demand across countries during the COVID-19 crisis. Our findings suggest that fiscal stimulus boosted the consumption of goods without any noticeable impact on production, increasing excess demand pressures in good markets. As a result, fiscal support contributed to price tensions. Indeed, focusing on inflation through February 2022 which does not capture many disruptions associated with the war in Ukraine, we show that countries with large fiscal stimulus, or with high exposure to foreign stimulus through international trade, experienced stronger inflation outbursts. Our back-of-the-envelope illustrative calculations suggest that U.S. fiscal stimulus during the pandemic contributed to an increase in inflation of about 2.5 percentage points (ppt) in the U.S and 0.5 ppt in the United Kingdom.
1. The Covid Crisis and fiscal policy responses around the world
The COVID-19 pandemic greatly disrupted economic activity all over the world. Due to a mix of government-imposed restrictions and voluntary personal decisions, mobility levels, as measured by Google's geo-location tracking data from smartphones, collapsed in March 2020. Since then, mobility has improved, although with some volatility that tracked closely the successive waves of the pandemic (see figure 1).

Note: Mobility is a simple average of Google's grocery, workplace, retail, recreation, and transportation mobility. Series are smoothed using a 7−day moving average and aggregates are weighted by population. Aggregates are constructed using Federal Reserve Board country classifications. AFE comprise of Canada, France, Germany, Italy, Japan, Spain, and the United Kingdom. EME comprise of Argentina, Brazil, Chile, Colombia, Hong Kong, Korea, Indonesia, Malaysia, Philippines, Singapore, Taiwan and Thailand. Series end on March 26, 2022.
Source: Google Community Mobility Reports.
The pandemic affected both the supply and demand side of the economy, hampering firms' ability to produce, as well as consumers' ability to consume. Unlike previous recessions, consumption of goods and services behaved very differently (see figure 2). In advanced economies, where the data allow real consumption expenditures across goods and services to be discernible more easily, consumption of services fell dramatically and then started recovering slowly as containment policies eased and vaccines were made widely available.2 In contrast, goods consumption fell by less during the beginning of the pandemic and experienced a strong recovery thereafter. Industrial production, however, was slow to adjust, creating a discrepancy between supply and demand in the goods' markets that likely played a role in the depletion of inventories and ultimately in recent price tensions.3
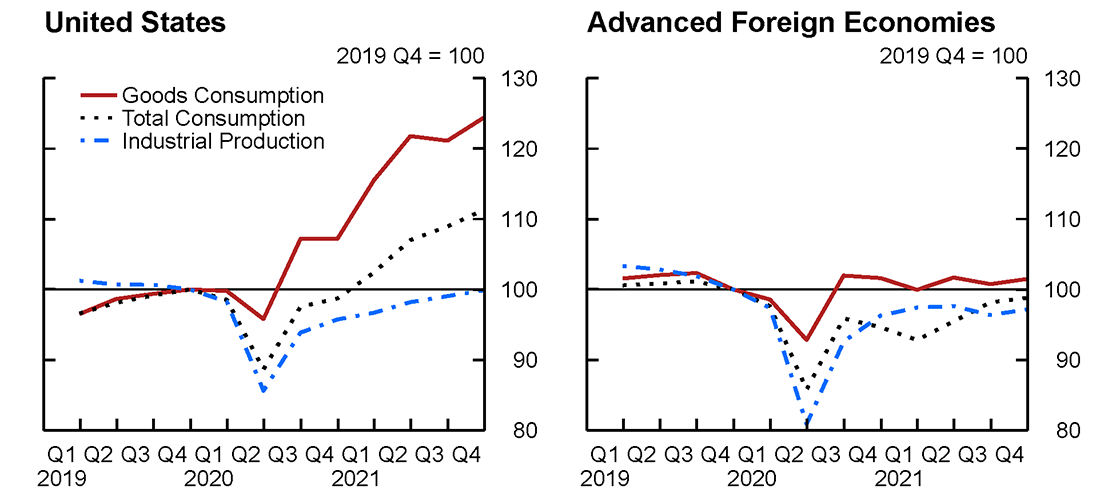
Note: All series end in 2021 Q4. Industrial production data are aggregated to the quarterly frequency by taking the respective average of the monthly values. Aggregates are constructed using real GDP weights. Total industrial production excluding construction series are used when possible, but some series use manufacturing industrial production instead due to data availability. The Advanced Foreign Economies aggregate comprise of Canada, France, Germany, Italy, Japan, and the United Kingdom.
Source: Bureau of Economic Analysis; OECD National Quarterly Accounts; Haver Analytics.
To mitigate the health and economic fallout of the pandemic, many governments engaged in massive fiscal support programs. Using the IMF's data, we define each country's total fiscal stimulus as the percent change in cumulative spending above the country-specific pre-pandemic trend. As shown in figure 3, the extent of fiscal support is large and heterogeneous across countries.
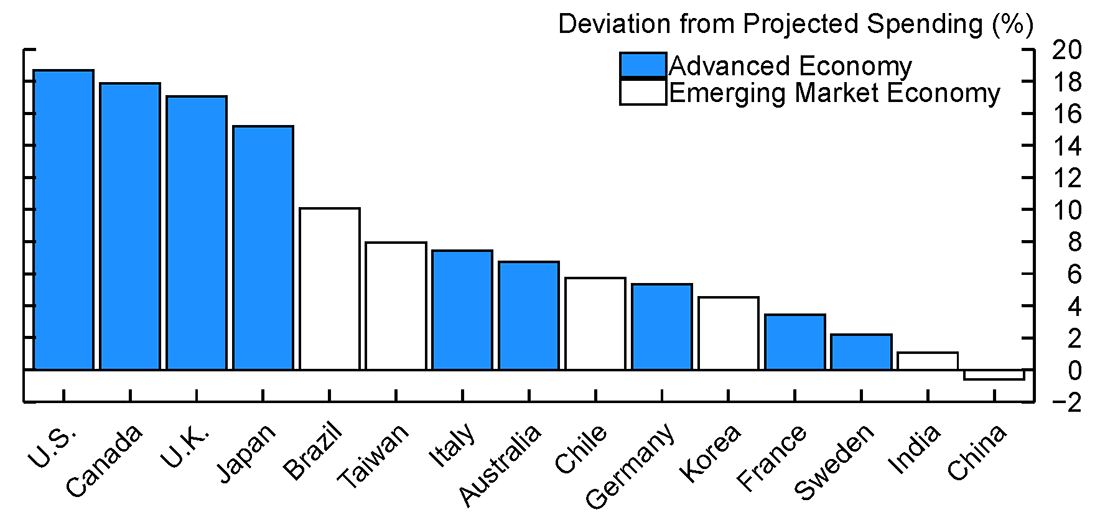
Note: Deviation from projected spending is constructed by calculating the percent change between each government's fiscal spending in 2020 against a 2020 projected value. The projected value is calculated by taking the average fiscal spending growth rate between 2015−2019 and forecasting out a year. Federal Reserve Board country classifications are used to group countries into Advanced Economy and Emerging Market Economy categories.
Source: IMF World Economic Outlook January 2022; staff calculations.
2. Fiscal Support, Consumption, and Production During Recovery Periods of the Pandemic
While the pandemic and associated public health restrictions were the main drivers of economic fluctuations over the past two years, fiscal stimulus policies might have shaped the response of consumption and production to changes in mobility. Here, we investigate the association between the size of total fiscal stimulus and the path of consumption and Industrial Production during the COVID-19 pandemic, by evaluating: (i) the elasticity of demand and supply to lockdowns, and (ii) the impact of fiscal stimulus on this elasticity.
Empirical Setup.
Our empirical strategy consists of projecting quarterly real consumption and production growth on the growth rate in mobility in the same quarter. We also interact these variables with country-specific 2020 fiscal stimulus. Our objective is to analyze how fiscal support affected the country-level consumption and production in response to mobility fluctuations.4
On the one hand, in periods of mobility decline, we expect fiscal support to help household's "soften the blow" of the activity reduction, and hence expect a smaller decline in consumption in countries with large stimulus. Hence, in these periods, fiscal support is expected to counterbalance the effect of mobility, which means that the interaction term takes an opposite sign compared to the standalone mobility one. On the other hand, in periods of economic reopening and mobility rebound, we expect fiscal support to amplify the consumption increase, which implies that the interaction term takes the same sign as mobility.
Baseline Results.
We find that governments that provided generous fiscal support mitigated the drop in goods consumption in periods of lockdowns, while boosting consumption in periods of increased mobility. The effect of fiscal stimulus on services consumption, however, is insignificant. Finally, our results reveal that generous fiscal spending did not significantly contribute to supply expansion: countries with larger fiscal support did not have a significantly different association between mobility and Industrial Production. In other words, supply did not adjust quickly enough to meet the sharp increase in demand for goods.
Using our point estimates and country-specific values of fiscal support, figure 4 quantifies the role of fiscal support in shaping the response of goods consumption to fluctuations in mobility. The United States is the most impacted country, with consumption decreasing significantly less when mobility drops and rebounding significantly more when mobility increases.
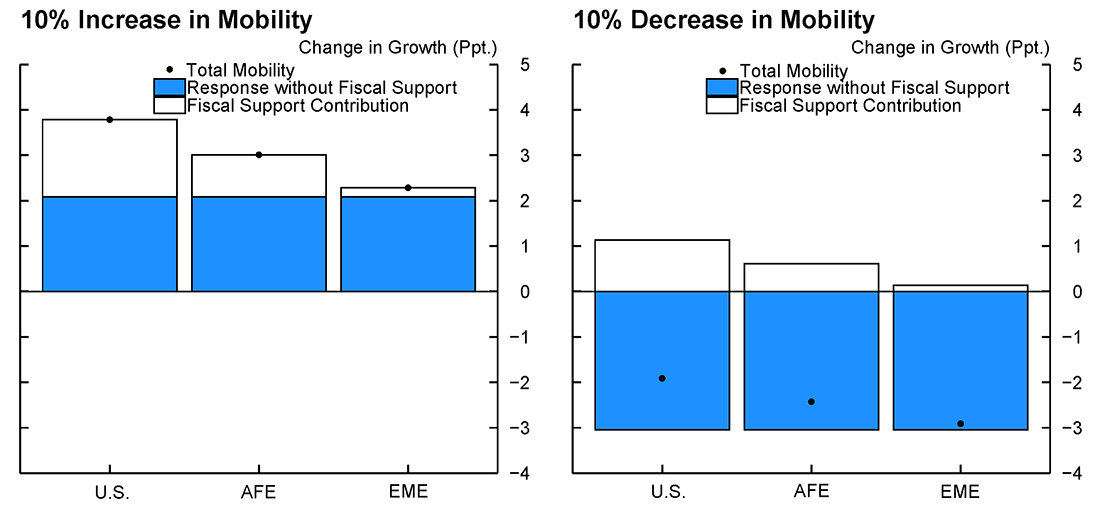
Note: Aggregates are constructed using real GDP weights. The AFE aggregate comprise of 19 countries and the EME aggregate comprise of 24 countries. Countries are classified using Federal Reserve Board country classifications.
Source: Staff calculations.
3. Fiscal Support and Inflation
The previous section highlighted that fiscal support boosted goods consumption demand without any noticeable impact on the supply of goods. Hence, the large increase in demand triggered by the fiscal stimulus policy, together with the slow pace of adjustment in production, likely contributed to the current imbalance in the goods market, resulting in the depletion of inventories, pronounced bottlenecks, and ultimately inflation.
The steep surge in goods consumption in countries with large fiscal support may have also created extra demand in other countries through an increase in demand for imports. This demand surge was met by limited supply capacity. Indeed, while both production, transportation and shipping capacity have adapted to increasing global value chain participation over the past few decades, the necessary infrastructure appeared to be quite inelastic in the short run. To further investigate this intuition, we turn to a cross-country regression analysis. For each country, we compute "excess inflation" by taking the 2021Q4 12-months inflation rate and subtract the average rate of inflation each country experienced during the 2015-2019 period. We then construct several measures of exposure to domestic and foreign fiscal stimulus and project excess inflation on such measures.
First, Exposure to Domestic Fiscal Stimulus captures each country's fiscal support, as presented in figure 3. Second, Exposure to Foreign Fiscal Stimulus measures a country's exposure to foreign stimulus and contains two parts: (i) a "vertical" component which is defined as a trade-weighted average of other countries' stimulus measures, and (ii) an "horizontal" component capturing the exposure of each country's import-partners to third countries' fiscal stimulus. Intuitively, the United States can be exposed to fiscal stimulus from Canada, both through a high import share (i.e, imported inflation) and through a high export share (i.e., higher demand from Canada). This captures vertical foreign exposure. Moreover, the price of Canada's exports to the United States may be pushed up by Canada's exposure to Mexico's fiscal stimulus. This captures horizontal foreign exposure.
We find that excess inflation is significantly correlated with each country's domestic stimulus, as well as with exposure to foreign stimulus. When taken separately or when used in conjunction with domestic fiscal stimulus, both vertical and horizontal exposure to foreign stimulus appear to be significantly correlated with domestic excess inflation. Moreover, our results show that excess inflation is also strongly related to our aggregated measure of Foreign Exposure.
Before describing our results further, we need to acknowledge several limitations in our analysis. Our estimation relies on the association between excess inflation and exposure to domestic and foreign fiscal stimulus, but it might be the case that countries that engaged in larger fiscal support are also those that have been the worst hit by the pandemic and thus had a greater recovery. In such a case, and if the severity of the pandemic is itself positively correlated with excess inflation in the recovery period over and beyond the effect of fiscal support, then we would suffer from an omitted variable issue bias. Moreover, the bias would be positive because our fiscal stimulus variable would capture both the direct effect of the pandemic and the effect of the fiscal spending. Future work on this topic would gain from addressing such concern. For the moment, the results should be viewed as illustrative, highlighting perhaps the higher end of potential price pressures from fiscal stimulus during the pandemic.
Back-of-the-Envelope Calculation: Quantifying the Impact of Fiscal Stimulus on Inflation.
Keeping in mind the caveats described above, figure 5.1 presents the impact of domestic and foreign exposure on excess inflation for several regions, based on our regression estimates. The impact of domestic fiscal stimulus on inflation is highest in the United States. Canada, a country with strong trade links with the U.S., features a high level of excess inflation related to exposure to foreign fiscal stimulus. In large economies, not surprisingly, domestic stimulus is a more important driver of excess inflation than foreign stimulus. For example, domestic stimulus is associated with a 2.5 (ppt) in excess inflation in the United States, 1.8 ppt in the Euro Area.
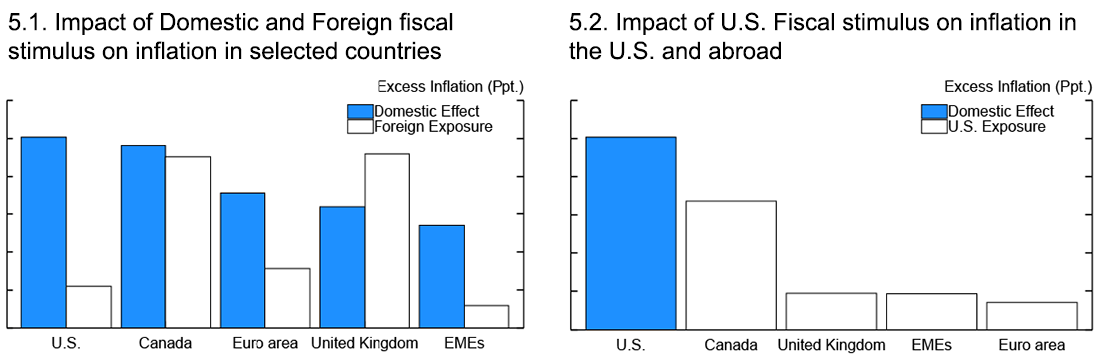
Aggregates are constructed using real GDP weights. The Euro area comprise of France, Germany, italy and Spain. EMEs comprise of 32 countries using Federal Reserve Board country classifications.
Source: Staff calculations.
Conversely, smaller economies are relatively more sensitive to foreign stimulus. In figure 5.2, we derive a measure of "international spillover" of U.S. fiscal stimulus. In particular, we isolate the share of U.S. stimulus in foreign exposure for several countries and compute the associated excess inflation in those countries. Our estimation implies that US fiscal stimulus was associated with an excess inflation of about 0.5 percentage points in the United Kingdom.
4. Conclusion.
The COVID-19 pandemic hampered firms' ability to produce and consumers' ability to consume. In response to economic disturbances, many governments resorted to large fiscal stimulus. This policy was successful at boosting consumption which, together with relatively inelastic supply, may have led to supply chain bottlenecks and price tensions.
However, one should also recognize the positive role played by generous government support throughout this unprecedented crisis. The large spending supported a strong economic rebound, with both GDP and employment recovering at a remarkable pace, likely preventing worse outcomes despite the price pressures that may have resulted from the spending.
References.
Amiti, Mary; Heise, Sebastian and Wang, Aidan. "High Import Prices along the Global Supply Chain Feed Through to U.S. Domestic Prices." Federal Reserve Bank of New York Liberty Street Economics, November 8, 2021.
Leibovici, Fernando and Dunn, Jason. "Supply Chain Bottlenecks and Inflation: The Role of Semiconductors." Federal Reserve Bank of St. Louis Economic Synopses, 2021, No. 28.
Ana Maria Santacreu and Jesse LaBelle, "Supply Chain Disruptions During the COVID-19 Recession," Economic Synopses, No. 2, 2022.
Santacreu, Ana Maria; Leibovici, Fernando and Jesse, LaBelle. "Global Value Chains and U.S. Economic Activity During COVID-19." Federal Reserve Bank of St. Louis Review, Third Quarter 2021, 103(3), pp. 271-88.
Santacreu, Ana Maria and LaBelle, Jesse. "Rethinking Global Value Chains During COVID-19: Part 1." Federal Reserve Bank of St. Louis Economic Synopses, 2021a, No. 16.
Santacreu, Ana Maria and Jesse LaBelle. "Rethinking Global Value Chains During COVID-19: Part 2." Federal Reserve Bank of St. Louis Economic Synopses, 2021b, No. 17.
Santacreu, Ana Maria and Jesse LaBelle, "Global Supply Chain Disruptions and Inflation During the COVID-19 Pandemic," Federal Reserve Bank of St. Louis Review, Forthcoming 2022.
Sargent, Thomas J. and Wallace, Neil. "Some Unpleasant Monetarist Arithmetic." Federal Reserve Bank of Minneapolis Quarterly Review, Fall 1981, pp. 1-15.
Sims, Christopher A. "Stepping on a Rake: The Role of Fiscal Policy in the Inflation of the 1970s, https://doi.org/10.1016/j.euroecorev.2010.11.010." European Economic Review, 2011, 55(1): 48-56.
Kehoe, Timothy and Nicolini, Juan Pablo (editors). "Monetary and Fiscal History of Latin America, 1960-2017", 2021, University of Minnesota Press
1. François de Soyres ([email protected]) and Henry Young ([email protected]) are with the Board of Governors of the Federal Reserve System. Ana Maria Santacreu ([email protected]) is with the Federal Reserve Bank of St Louis. The views expressed in this note are our own, and do not represent the views of the Federal Reserve Bank of Saint Louis, the Board of Governors of the Federal Reserve, nor any other person associated with the Federal Reserve System. Return to text
2. See Santacreu and LaBelle (2022) Return to text
3. Several aspects of this line of reasoning, including the role of semiconductors and the importance of supply-chain bottlenecks, have been documented in recent contributions such as Amiti et al. (2021), Leibovici and Dunn (2021), Santacreu et al. (2021), Santacreu and LaBelle (2021a, 2021b, 2022) Return to text
4. In our baseline specifications, we use country fixed effects to account for unobservable factors such as heterogeneous trend growth across countries. Our results are qualitatively similar with different fixed effects. Return to text
de Soyres, François, Ana Maria Santacreu, and Henry Young (2022). "Fiscal policy and excess inflation during Covid-19: a cross-country view," FEDS Notes. Washington: Board of Governors of the Federal Reserve System, July 15, 2022, https://doi.org/10.17016/2380-7172.3083.
Disclaimer: FEDS Notes are articles in which Board staff offer their own views and present analysis on a range of topics in economics and finance. These articles are shorter and less technically oriented than FEDS Working Papers and IFDP papers.