FEDS Notes
May 26, 2020
How do children spend their time? Time use and skill development in the PSID
Hannah Hall and Eric Nielsen
As income and wealth inequality have grown in the United States in recent decades, the large and growing differences in household expenditures on children from advantaged versus disadvantaged backgrounds have increasingly become a matter of public concern. High socioeconomic status (SES) households (those with high incomes and/or high levels of parental education) increasingly spend more money on physical goods (books, tuition, computers, etc.) and more time on "enrichment" activities such as homework, tutoring, reading, and extracurricular activities that are thought to directly foster cognitive (academic) skills. Differences in these investments could plausibly contribute to the large childhood skill gaps observed by household SES.1
In this note, we use detailed time diary data to document some basic facts about how children spend their time. We find that enrichment activities are a significant use of time for many children. Nonetheless, other activities, such as watching television and socializing with friends, take up a much larger share of the typical child's schedule (along with sleep and school, which dominate). We also document notable differences in childhood time use by household SES. Children from high-SES households spend substantially more time on enrichment activities than children from low-SES households. Enrichment time is highest in high school and lowest in elementary school for high-SES children, whereas the reverse is true for low-SES children. Finally, children who spend more time on enrichment spend less time sleeping, watching television, playing, and socializing.
The analysis in this note builds on and supplements our analysis in Caetano et al. (2020a), which uses the same data to produce novel estimates of the causal effects of enrichment on cognitive and non-cognitive skills.2 We provide further evidence to reinforce a key argument in that paper: the apparent substitution towards enrichment time away from sleep, play, and social activities may have negative consequences for skill development, particularly for non-cognitive (i.e. behavioral) skills.
We use time diary data from 1997, 2002, and 2007, available as part of the Child Development Supplements (CDS) of the Panel Study of Income Dynamics (PSID).3 These diaries give detailed breakdowns of each child's time use over a full 24 hours for one weekend day and one weekday, which we aggregate to the weekly level.4 In addition to the rich time diary data, the PSID and CDS also contain various academic achievement test scores as well as numerous variables related to behavioral problems that we use to construct standardized cognitive and non-cognitive skill measures.5 Our sample covers school-age children, with roughly one-third of the sample in elementary school and kindergarten, one third in middle school, and one third in high school.
We aggregate the hundreds of time uses in the raw time diary data into a number of intuitive aggregates, shown in Figure 1. The upper left panel shows the average shares of a typical week devoted to a number of different time uses. Not surprisingly, sleep is the single largest use of time, at about 40 percent (about 9.5 hours per day). Time spent in school is next, at 19 percent (or 6.3 hours per school day), followed by duties/chores, a catch-all category including meals, commuting, chores, and personal hygiene, at 15 percent. Overall, enrichment activities comprise about 3 percent of total time use, substantially less than TV and other passive leisure activities (11 percent) or play and social activities (7 percent). The upper right panel shows that enrichment time is largely composed of homework (66 percent) and reading (20 percent).6 The bottom left panel shows that play and socializing are widely spread among a number of activities, while the bottom right shows that passive leisure activities are dominated by TV.7
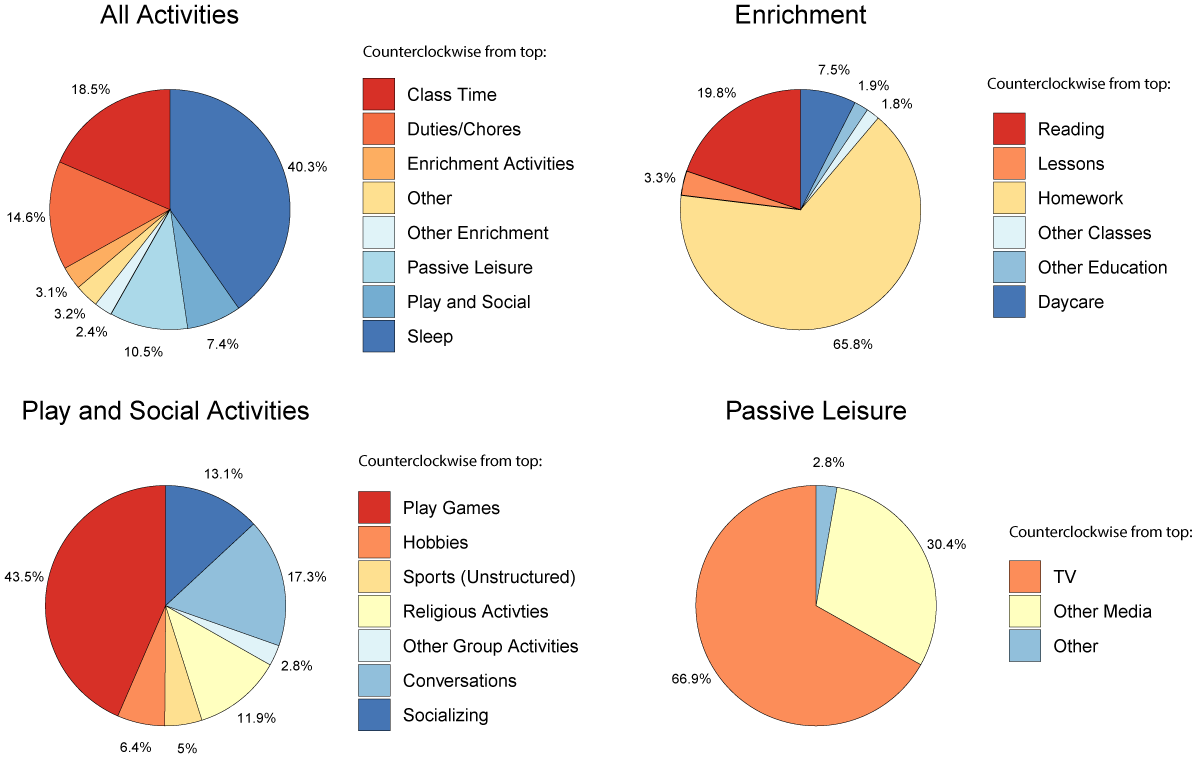
Note: Panels plot the average division of time into different categories over a typical week for our full PSID/CDS sample, pooling the 1997, 2002 and 2007 CDS waves.
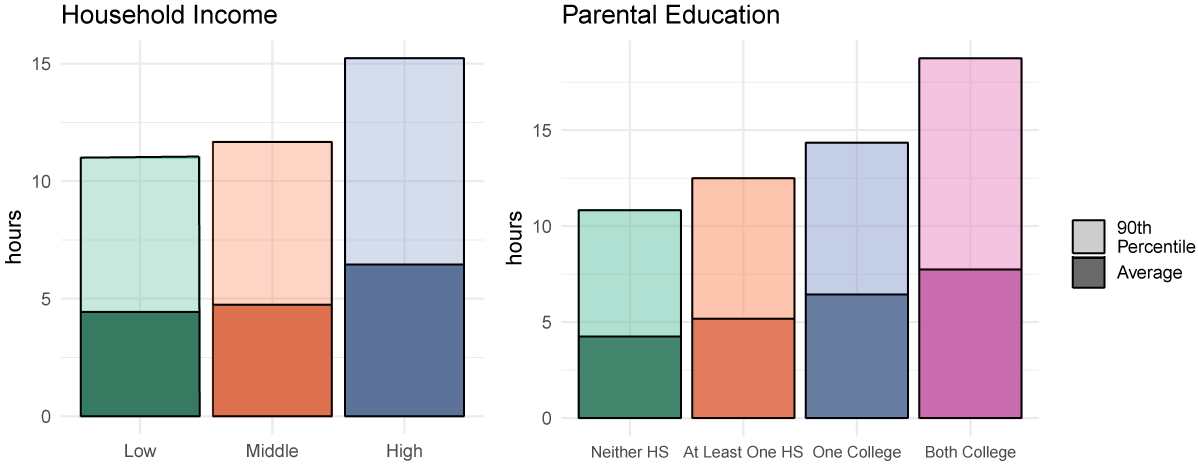
Note: Panels plot enrichment time over a typical week for our full PSID/CDS sample, pooling the 1997, 2002 and 2007 CDS waves. "Both College" indicates that both parents in the household have college degrees, "One College" indicates only one parent has a college degree, "At Least One HS" indicates at least one parent has completed high school but not college, and "Neither HS" indicates neither parent has completed high school. The solid areas show the mean enrichment times for each SES group, while the shaded areas show the corresponding 90th percentiles.
On average, children in our sample spend about 5.2 hours per week engaged in enrichment activities. However, as Figure 2 shows, children from high-SES households spend notably more time on enrichment. Dividing the sample into three equally-sized groups by household income, we see that the top third of the sample spends on average about 6.5 hours per week on enrichment, roughly 40 percent (or about 2 hours/week) more than the bottom two income groups.8 The top right panel likewise shows a clear positive relationship between parental education and enrichment time. For instance, children in households where both parents completed college spend on average 8 hours/week on enrichment, which is 67 percent more than children in households where neither parent has completed college.
In addition to averages, Figure 2 also shows the 90th percentiles of enrichment for each SES group. Here the differences are even starker – children from high-SES households are substantially more likely to engage in extraordinary amounts of enrichment. The 90th percentile child from a high-income household spends about 4 hours more on enrichment per week than the 90th percentile children from middle- and low-income households (15 hours/week versus 11). Similarly, the gap between the 90th percentile for households where both parents finished college and the 90th percentile for households where at neither parent attended college is about 7 hours/week.
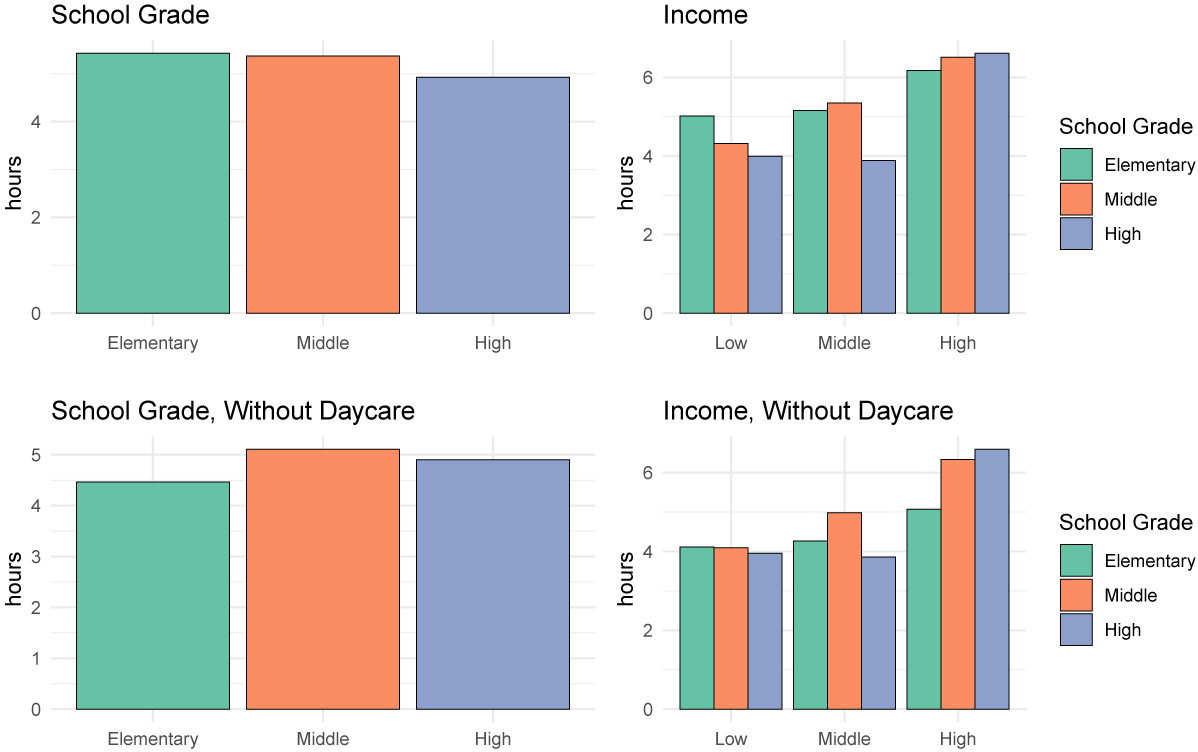
Key identifies bars in order from left to right.
Note: Panels plot the average enrichment time over a typical week for our full PSID/CDS sample, pooling the 1997, 2002 and 2007 CDS waves. The top row of panels include before- and after-school care in enrichment time while the bottom row excludes them.
Figure 3 shows that, on average, enrichment time is slightly higher for children in elementary and middle school. However, breaking these averages down by household income reveals starkly different patterns. Among children from households in the bottom third of the income distribution, average enrichment time decreases from elementary school (5 hours/week) to high school (4 hours/week). Children in the top third, by contrast, engage in slightly more enrichment in high school than in earlier grades (and always at much higher levels than children in the bottom two-thirds). Removing daycare (including before- and after-school programs) from the definition of enrichment, as in the second row of Figure 3, strengthens the positive association between age and enrichment for high-income children while largely removing it for low-income children.9
The large enrichment time differences between children from high- and low-SES households are notable because enrichment time is strongly positively associated with both cognitive and non-cognitive skills.10 These strong associations are clearly visible in column (i) of Table 1, which shows the coefficient estimates of simple linear regression models relating enrichment time to skills. Moreover, the association between cognitive skills and enrichment remains significant and positive even after accounting for each child's demographic characteristics, as shown in column (ii).11 The signs and magnitudes of these regression estimates are consistent with the worry that differences in time use might contribute meaningfully to the large gaps in skills observed between children from high and low-SES households.
However, the regression estimates in columns (i) and (ii) of Table 1 are not causal – the true effects of enrichment time on skills might in fact be very different. To take just one example, children likely differ in their academic preparation. If better-prepared students are more willing or more able to spend time on enrichment, then the estimates in the first two columns of Table 1 will overstate the true effects of enrichment on skills, because the high-enrichment students would already have had relatively high skills even absent any gains from enrichment. More generally, the presence of any unobserved variable that is related both to the choice of enrichment time and to skills directly will make uncovering the true effects of enrichment on skills challenging.12
To circumvent this challenge, Caetano et al. (2020a,b) develop and implement a novel statistical correction that makes use of the fact that no child can spend less than zero time on enrichment. The children "bunched" at zero are special because they form a group where enrichment does not vary (by construction) but where unobservable variables still might. Therefore, variation in cognitive and non-cognitive skills in this "bunched" group must be coming from some combination of differences in observable characteristics (such as demographics), which can be accounted for, and differences in confounding unobserved variables (such as academic preparation). The bunched group thus allows one to estimate the direct effect of the confounders on skills, which in turn allows one to "undo" the bias created by these confounders in the estimates in the first two columns of Table 1.13
Following Caetano et al. (2020a), we utilize this correction to create more credible estimates of the causal effects of enrichment time on skills. Column (iii) of Table 1 shows that correcting for confounders completely alters the estimated relationships between enrichment and skills. For cognitive skills, the estimates go from being positive and statistically significant to negative and statistically insignificant – we cannot reject that enrichment time has no effect on cognitive skills. The non-cognitive effects go from being close to zero to being significantly negative, indicating that enrichment time may actually harm non-cognitive skills, at least on the margin. We see in column (iv) that this negative effect on non-cognitive skills is especially pronounced for high-school age children, while column (v) shows that this is particularly true for middle-income children.
Table 1: The Corrected Relationship Between Enrichment Time and Skills
| (i) Uncorrected | (ii) Uncorrected | (iii) Corrected | (iv) Corrected | (v) Corrected | |
|---|---|---|---|---|---|
| Grades | All | All | All | 9-12 | 9-12 |
| Income Tercile | All | All | All | All | Middle |
| Cognitive | 0.018** | 0.011** | -0.002 | -0.008 | -0.005 |
| (se) | (0.003) | (0.002) | (0.006) | (0.009) | (0.018) |
| Non-Cognitive | 0.006** | 0.003 | -0.019* | -0.039** | -0.060* |
| (se) | (0.003) | (0.003) | (0.01) | (0.014) | (0.034) |
| Controls | No | Yes | Yes | Yes | Yes |
Note: N=4,330. Column (i) presents OLS estimates of β from regressions of the form Skill = α + β Enrichment + ε. Columns (ii-vi) present OLS estimates of β from regressions of the from Skill = α + β Enrichment + γ Controls + ε, where Controls includes indicators for sample year, child grade, child race, and family income tercile. Bootstrapped standard errors in parentheses (500 iterations). ** p<0.05, * p<0.1. Table extracted from Caetano et al. (2020a).
How can we understand the perhaps surprising result that enrichment time has no effect on cognitive skills and significant negative effects on non-cognitive skills? First, it is important to note that the estimates in column (iii) of Table 1 only imply that the effect of the last hour of enrichment is zero or negative, not that the effect of enrichment is always zero or negative. There are likely diminishing returns to enrichment as there are for many other forms of investment. For any given child, the first hour of enrichment might be enormously beneficial even as the last hour contributes little (or contributes negatively, as for non-cognitive skills). Second, the estimates in Table 1 show the effects on skills of the last hour of enrichment relative to alternative uses of the same hour. Since everyone has the same number of hours per week, children who spend a lot of time on enrichment must be doing so at the expense of some other activities. If these activities are, on the margin, more productive for skills, then our approach will find a negative causal effect of enrichment.
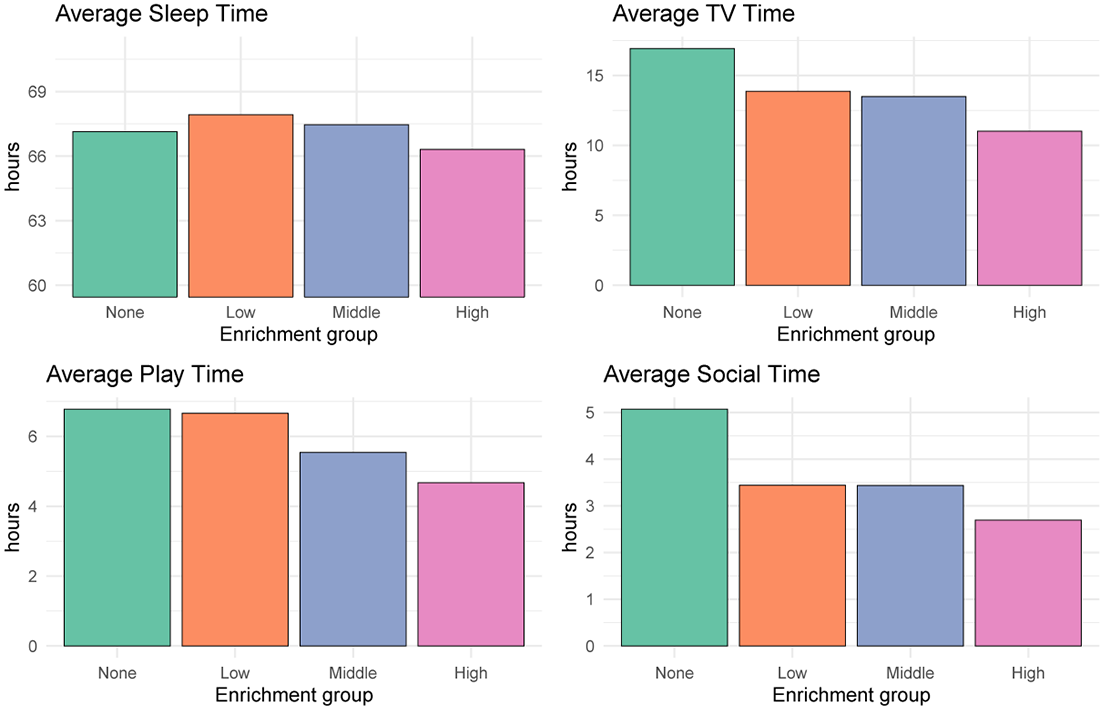
Note: Panels plot the average amount of time devoted in the typical week to various activities for four groups of children: (1) those who spend no time on enrichment, (2) those in the bottom third of the non-zero enrichment distribution, (3) those in the top half of the non-zero enrichment distribution, and (4) those in the top third of the non-zero enrichment distribution. Figure uses our full PSID/CDS sample, pooling the 1997, 2002 and 2007 CDS waves. Play time = games + unstructured sports, Social time = conversations + socializing
On which activities do children spend less time when they spend a lot of time on enrichment? Figure 4 above shows that such children spend less time sleeping, watching television, playing, and socializing, relative to children who engage in little (or no) enrichment. While TV might plausibly have a negative effect on skills, sleep, socializing, and playing all likely promote skill development, particularly non-cognitive skills. Indeed, the importance of sleep and play are well-documented.14 Figure 4 therefore provides suggestive evidence that children who engage in a lot of enrichment might "pay" for it in ways that are detrimental to their non-cognitive skills.
Finally, Figure 5 compares these alternative time uses (sleep, TV, play, and socializing) by the child's household income and grade in school. Not surprisingly given the positive association between income and enrichment time, higher-income children sleep less and watch less TV than lower-income children. They also spend significantly less time socializing, and this difference arises only in high school.
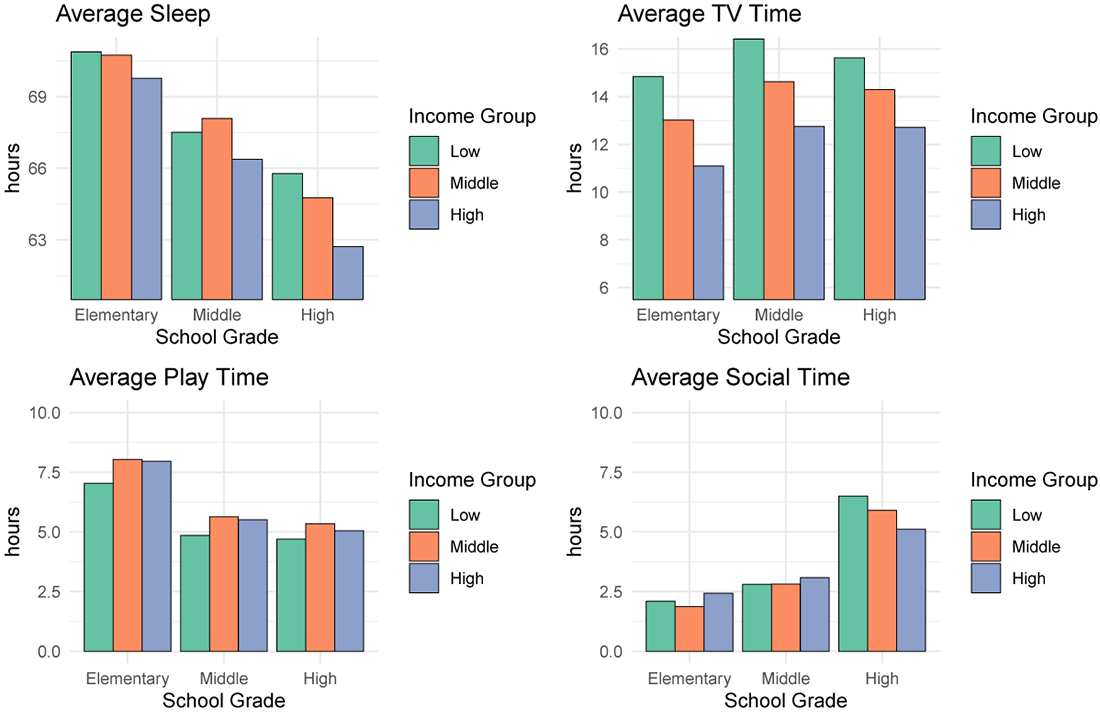
Key identifies bars in order from left to right.
Note: Panels plot the average division of time into different categories over a typical week for our full CDS sample, pooling the 1997, 2002 and 2007 CDS waves. play = games + unstructured sports, social = conversations + socializing
The differences in non-enrichment time use by age and household SES support the idea that substitution patterns between different activities might explain the corrected results for middle-income children in high school, presented in column (iv) of Table 1. For instance, while sleep time is lower in high school on average for all families, the difference relative to middle school is particularly large for the middle-income group. If, on the margin, middle-income youth are substituting enrichment for sleep in high school, and if sleep is quite valuable for non-cognitive skills, then this (as well as additional substitution between enrichment and potentially valuable activities such as play) could account for the very negative estimated effect of enrichment on non-cognitive skills for this group. The effects might be less negative for the low-income group because they may substitute more between enrichment and passive activities such as watching TV.
This note highlights the importance of understanding how children spend their time. Children from relatively advantaged backgrounds spend more time on enrichment activities directly related to cognitive skills. However, such children also spend less time on other activities (sleep, play, socializing) that may also be productive, particularly for non-cognitive skills. Children from advantaged households also differ from their less- advantaged peers on many observable dimensions, suggesting they likely also differ in unobservable ways. Together, these considerations make it difficult to determine whether and how time use contributes to the large differences in achievement between children from high- and low-SES households. Caetano et al. (2020a) makes progress on this question, presenting further evidence that much of the observed correlation between enrichment and skills is, in fact, driven by unobservable factors. That paper, as well as the evidence shown here, suggests that a fruitful avenue for future research would be to better understand how children substitute between different activities. The correction method used here could also be used to understand the causal effects of other uses of time (sports, television, etc.) on skills. Finally this method could be used in other settings with potentially endogenous variables that have bunching at naturally-occurring floors or ceilings.
References
Aguiar, M. and Hurst, E. (2007). Measuring Trends in Leisure: The Allocation of Time Over Five Decades. Quarterly Journal of Economics, 122:969–1006.
Bianchi, S. M. (2000). Maternal Employment and Time with Children: Dramatic Change of Surprising Continuity? Demography, 37:401–414.
Caetano, C., Caetano, G., and Nielsen, E. (2020a). Should Children Do More Enrichment Activities? Leveraging Bunching to Correct for Endogeneity. Finance and Economics Discussion Series 2020-036. Washington: Board of Governors of the Federal Reserve System, https://doi.org/10.17016/FEDS.2020.036.
Caetano, C., Caetano, G., and Nielsen, E. (2020b). Correcting Endogeneity Bias in Models with Bunching. Working Paper.
Caetano, G., Kinsler, J., and Teng, H. (2018). Towards causal estimates of children's time allocation on skill development. Forthcoming at Journal of Applied Econometrics.
Deming, D. (2009). Early childhood intervention and life-cycle skill development: Evidence from head start. American Economic Journal: Applied Economics, 1(3):111–34.
Doepke, M. and Zilibotti, F. (2017). Parenting With Style: Altruism and Paternalism in Intergenerational Preference Transmission. Econometrica, 85:1331–1371.
Doepke, M. and Zilibotti, F. (2019). Love, Money, and Parenting: How Economics Explains the Way We Raise Our Kids. Princeton University Press.
Duncan, G. and Murnane, R. (2011). Figure 1.6: Enrichment Expenditures on Children, 1972-2006, chapter 1, page 11. Russell Sage.
Fiorini, M. and Keane, M. P. (2014). How the allocation of children's time affects cognitive and noncognitive development. Journal of Labor Economics, 32(4):787–836.
Fort, M., Ichino, A., and Zanella, G. (2020). Cognitive and noncognitive costs of day care at age 0-2 for children in advantaged families. Journal of Political Economy, 128(1):158–205.
Gray, P. (2010). The decline of play and rise in children's mental disorders. Psychology Today (blog).
Gray, P. (2011). The decline of play and the rise of psychopathology in children and adolescents. American Journal of Play, 3(4):443–463.
Gray, P. (2019). Evolutionary functions of play: Practice, resilience, innovation, and cooperation. The Cambridge Handbook of Play: Developmental and Disciplinary Perspectives. Ramey, G. and Ramey, V. (2010). The Rug Rat Race. Working Paper 2010.
Todd, P. and Wolpin, K. (2007). The production of cognitive achievement in children: Home, school, and racial test score gaps. Journal of Human Capital, 1(1):91–136.
Walker, M. (2017). Why we sleep: Unlocking the power of sleep and dreams. Simon and Schuster.
1. See Aguiar and Hurst (2007); Bianchi (2000); Ramey and Ramey (2010); Duncan and Murnane (2011); Doepke and Zilibotti (2017, 2019). Return to text
2. See Todd and Wolpin (2007); Caetano et al. (2018); Fiorini and Keane (2014) for earlier work connecting time use to skill development. Return to text
3. The PSID is a long-running, longitudinal panel covering a nationally representative sample of 18,000 individuals in 5,000 households beginning in 1968. These individuals and their descendants/new household members are still being followed. This note makes use of the 1997, 2002, and 2007 waves of the CDS, which follows all children in PSID households as of the supplement survey dates. Our analysis sample of 4,330 children aged 5 to 18 is identical to the main sample in Caetano et al. (2020a). Please refer to Table 1 of that paper for summary statistics. Consistent with that paper, we pool the three CDS waves in most of our analysis. The sample is not nationally representative. Return to text
4. We exclude days marked by the survey respondent as "atypical," so our data should reflect the usual schedules of the children in our sample. Return to text
5. The cognitive measure is constructed using iterated principle factor analysis applied to the letter word, applied problems, and passage comprehension subtests of the Woodcock Johnson Revised Tests of Achievement, Form B. The non-cognitive measure is likewise constructed by applying iterated principle factor analysis to parental responses to 36 questions cataloguing the child's behavior. See Caetano et al. 2020a for more details on the construction of these skill measures. The availability of academic achievement and behavioral measures is one of the chief advantages of using the PSID data relative to other data sources on time use, such as the American Time Use Survey (ATUS) from the U.S. Census. Return to text
6. Our reading measure includes reading of any kind (magazines, books, etc.) that is not associated with school. Relevant for younger children, it also includes being read to by someone else (e.g. a parent). Return to text
7. As our data comes from before the widespread adoption of smartphones and other internet-connected devices, it is likely the mix of activities in our passive leisure category would look quite different today, with relatively less TV and relatively more social media/gaming/internet usage, particularly on mobile devices. Return to text
8. The average incomes in the bottom, middle, and top income groups are $20,787, $56,751, and $142,264, respectively, in 2007-constant dollars. Return to text
9. It is not clear whether time spent in before- and after-school programs or daycare should be counted as enrichment. Prior research on this topic reaches mixed conclusions, with some work suggesting that such programs might have positive effects for relatively disadvantaged children and zero or even negative effects of advantaged children. See Fort et al. (2020) and Deming (2009). Return to text
10. Table 1 is adapted from the empirical results in Caetano et al. (2020a). Return to text
11. In particular, the columns shows the coefficients on enrichment from regression models that include indicators for sample year, child grade, child race, family income tercile, indicators for whether the child has siblings, and indicators for whether the parents are living. Return to text
12. The confounding effect of unobservables such as prior academic preparation on choice of enrichment is explored more fully in Caetano et al. (2020a). Return to text
13. This statistical correction method, and the associated asymptotic theory, are developed more fully in
Caetano et al. (2020b). That paper contains identification and estimation results for a number of different assumption on the distribution of unobservables. In the most general case, one need only assume a weak form of symmetry, and one can allow for arbitrary dependence between observables and unobservables. Importantly, roughly 30% of the children in our data are bunched at zero enrichment time, so we are able to employ the most general identification strategy from Caetano et al. (2020b). Return to text
14. See Walker (2017) and Gray (2010, 2011, 2019). Return to text
Hall, Hannah, and Eric Nielsen (2020). "How do children spend their time? Time use and skill development in the PSID," FEDS Notes. Washington: Board of Governors of the Federal Reserve System, May 26, 2020, https://doi.org/10.17016/2380-7172.2577.
Disclaimer: FEDS Notes are articles in which Board staff offer their own views and present analysis on a range of topics in economics and finance. These articles are shorter and less technically oriented than FEDS Working Papers and IFDP papers.